518 Marlowe Dr · Ocean City, FL
Flood risk 6/10 · Moderate
- FEMA flood zone
- X (unshaded)
- Chance of flooding over 30 yrs
- 0.54%
- Est. flood insurance / yr
- $507 – $1,088
Fire risk 1/10 · Minimal
- Est. fire insurance / yr
- $947 – $1,759
Heat risk 10/10 · Severe
- Hot days now (above 104°F)
- 7 days/yr
- Hot days in 30 yrs
- 22 days/yr
Wind risk 9/10 · Severe
- Chance of severe wind over 30 yrs
- 99.0%
Air-quality risk 2/10 · Minimal
- Unhealthy air days now
- 1 days/yr
- Unhealthy air days in 30 yrs
- 2 days/yr
Risk factors via First Street. Map © Google.
Why this score? — see what drove the B- grade
The composite is a weighted blend of 9 inputs, each scored 0–100. Each bar is that input's sub-score; the figure is the points it added to the 100-point composite (weight × sub-score).
- Cash flow +25.0/30.0
- ARV discount +15.0/15.0
- DSCR +8.1/10.0
- 1% rule +6.2/10.0
- Schools +5.2/10.0
- Livability +3.9/5.0
- Rent growth +2.5/5.0
- Condition / age +2.5/5.0
- Appreciation +0.0/10.0
$175,000
🖨 Deal sheet (PDF) 📄 Offer letter ✓ Due diligence
Listing remarks
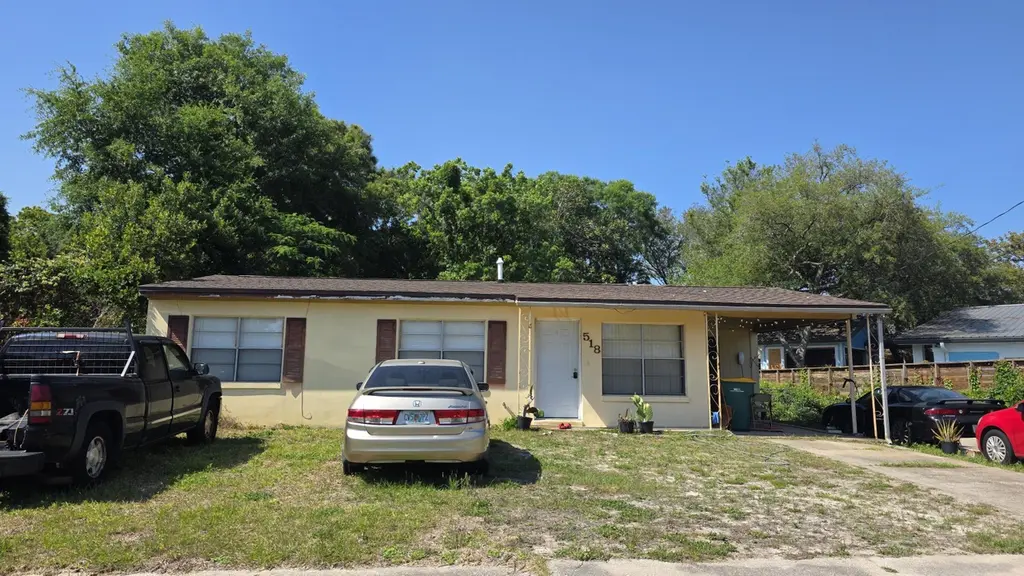
Investor opportunity in Fort Walton Beach! This 3-bedroom, 1-bath concrete block home offers 1,280 sq ft with a functional layout and additional living space with expansion potential. Major systems already updated: roof (2019), HVAC (2019), and water heater (2018). Property includes a covered carport and storage/laundry area. Ideal for renovation, resale, or rental portfolio addition. Convenient location near Eglin AFB, Hurlburt Field, shopping, and schools. Property sold as-is. Great opportunity for investors looking for their next project.
Key facts
- Covered carport
- Convenient location
- Storage laundry area
Tags
Property features AI
Finance
- HOA & community: Subdivision: WINTHROP PLACE, 1st Addition
Exterior
- Parking: Attached carport (1 carport space)
- Utilities: Electric service; Natural gas service; Public water; Public sewer; Gas water heater
- Home design: Ranch-style single-story home; Built in 1967
- Construction: Block, concrete, stucco and wood trim construction; Slab foundation
- Exterior features: Private yard; Lawn pump; Yard building; Chain link fencing; Interior, level lot; County road frontage (paved); Lot dimensions approximately 70 x 130
Interior
- Kitchen: Dishwasher; Refrigerator; Gas water heater
- Bedrooms: 3 bedrooms (master bedroom on the first floor); All bedrooms on the first floor
- Flooring: Parquet flooring; Tile flooring
- Bathrooms: 1 full bathroom
- Heating & cooling: Central air; Central heat; Natural gas heat
- Interior features: Washer/Dryer hookup; Central air conditioning; Central heating; Natural gas heating
- Laundry & utility: Washer/Dryer hookup
Neighborhood map
What this means for you Summary
Snapshot
- This is a 3-bed/1.0-bath single-family listed at $175k.
Deal economics
- At list price, monthly cash flow is $381 ($5k/yr) — positive.
- The deal already cash-flows at list — no discount required.
- Meets the 1% rule at list price ($2k rent vs $175k).
- Cap rate 8.9% vs local median 3.5% in Ocean City — top-decile yield for the area; either an underpriced asset or a hidden risk that comps aren't pricing in. Stress-test before assuming the spread holds.
Location & tenants
- Location reads 77/100 on livability (#179 in FL, #2,787 nationally) — a middle-class / working-renter tenant base. Strengths: commute A+, cost of living A+, housing A+; Watch: employment C-, amenities F.
- Okaloosa (other): math 60% / reading 60% proficiency, ranked #12 of 73 in FL (top 16%) — acceptable for families but not a draw, mixed tenant base, ~2y average lease.
- Zoned schools: Shalimar Elementary School (math 54% / reading 61%, grade C+, #764 of 2,144 statewide, top 36%, 614 students, 63% FRL); Choctawhatchee Senior High School (math 42% / reading 50%, grade D-, #220 of 667 statewide, top 33%, 1,677 students, 52% FRL) — zoned schools average 58% FRL vs 36% district-wide (21 pts higher); higher-poverty schools than district average — tighter screening recommended.
- Market conditions: Rents soft (-0.1%/yr); 224 active listings in the ZIP; 40 comparable units currently listed for rent nearby; rentals lingering (median 45d on market — plan ~5-8 weeks vacancy on turnover, expect pricing pressure); 62% of comp listings sitting > 30 days — soft ceiling on asking rent; 1,268 units permitted in Okaloosa County in 2024 (175 in 5+ unit buildings).
- This rent runs 33% of the median local income ($71k/yr) — at the standard rent-burdened threshold; future hikes will face affordability resistance.
Forward outlook
- Local home prices are declining (-3.0%/yr); year-one equity from $1k of loan paydown is wiped out by about $5k of value loss. Plan a longer hold.
- Okaloosa County population projected at +37% by 2050 — long-run rental-demand tailwind backs the buy-and-hold thesis.
Negotiation context
- Only 4 days on market — expect competitive offers; lowballing is unlikely to land.
- Current owner paid $52k; list at $175k implies a 237% gain — meaningful room to come down on a strong offer.
Risks & watch-outs
- Climate carrying-cost: major flood risk; severe wind risk, 99% chance of damaging wind over 30y; extreme-heat days projected 7→22/yr by 2055 (HVAC capex compounding) — expect insurance premiums to compound above CPI over the hold.
Questions for the listing agent
- Built in 1967 — when were the roof, HVAC, electrical panel, plumbing, and water heater last replaced?
- Is there a deadline driving the sale (1031 exchange, divorce, estate, relocation)? That informs how much negotiation room exists.
- Schools are F-rated, which usually means shorter tenancies and higher turnover. Who's the typical renter profile here, and what's been the actual vacancy rate?
- What's the average days-on-market for RENTAL listings here right now (not sales)? A rising rental-DOM trend means longer vacancies and softer asking-rent achievability than the comps imply.
- What's the recent tenant-quality profile in this submarket — average credit score on applications, eviction rate, late-payment / NSF rate, and stable-employment percentage? A property-management company in the area should have these aggregated.
- How much new for-sale + rental construction is in the pipeline within 1–3 miles? Heavy new supply typically softens prices + rents 12–24 months out; constrained supply supports both.
Investment metrics
- 1% rule
- 1.12% ✓
- Cap rate
- 8.90%
- Cash-on-cash
- 9.32%
- DSCR
- 1.41
- GRM
- 7.5
CMA / ARV
- ARV (on-the-fly)
- $305,920
- Comps found
- 12
Show comp detail 12 sales within ~0.75 mi
| Address | Dist | Beds/Ba | Sqft | Sold | Price | $/sf | Match |
|---|---|---|---|---|---|---|---|
| 518 Marlowe Dr | 0.00mi | 3/1.0 | 1,280 (0%) | 1mo | $165,000 | $129 | 100 |
| 48 Woodham Ave | 0.11mi | 3/2.0 | 1,296 (+1%) | 3mo | $200,000 | $154 | 87 |
| 103 Forest Dr | 0.32mi | 3/2.0 | 1,340 (+5%) | 2mo | $320,000 | $239 | 72 |
| 993 Kirkley Ct | 0.58mi | 3/2.0 | 1,324 (+3%) | 2mo | $339,000 | $256 | 62 |
| 725 Tuxedo Dr | 0.54mi | 3/1.5 | 1,309 (+2%) | 9mo | $323,000 | $247 | 61 |
| 150 Beach Dr | 0.70mi | 3/2.0 | 1,300 (+2%) | 0mo | $315,000 | $242 | 60 |
| 2283 Harlan Ave | 0.64mi | 3/2.0 | 1,348 (+5%) | 2mo | $354,000 | $263 | 56 |
| 33 Circle Dr | 0.55mi | 3/2.0 | 1,460 (+14%) | 1mo | $195,000 | $134 | 46 |
| 2234 Monahan Ct | 0.54mi | 3/2.0 | 1,152 (-10%) | 11mo | $298,900 | $259 | 45 |
| 274 NE Beachview Dr | 0.57mi | 3/1.5 | 1,468 (+15%) | 4mo | $211,000 | $144 | 44 |
| 236 NE Marshall Dr | 0.65mi | 3/1.0 | 1,144 (-11%) | 12mo | $240,000 | $210 | 42 |
| 994 Asaro Ct | 0.71mi | 3/2.0 | 1,440 (+12%) | 8mo | $300,000 | $208 | 35 |
Match score weights: distance 35% · size 25% · config 20% · recency 20%. Top-matched comps best support the ARV.
Projected returns pro-forma
-3.0% appreciation · 0.0% rent growth · sell at horizon
- IRR
- -5.6%
- Equity multiple
- 0.80×
- Total profit
- $-9,844
- Equity at exit
- $26,093
- IRR
- 0.2%
- Equity multiple
- 1.01×
- Total profit
- $509
- Equity at exit
- $15,131
Cash invested: $49,000 (down + closing). Projections, not guarantees.
Landlord ↔ Tenant lean methodology
- Overall (STATE)
- 87 Strongly Landlord-Friendly
- State Florida
- 87 Strongly Landlord-Friendly · R+3
- County
- — inherits STATE
- City
- — inherits STATE
ZIP-level market 32547
- Home prices YoY
- -29.3%
- Rents YoY
- -0.1%
- Active inventory
- 224
- Price-to-rent
- 7.5×
Monthly cashflow live
- Estimated rent
- $1,954 high interval (Pro) →
- Mortgage (P&I)
- −$918
- Tax from tax record
- −$173 /mo · $2,074/yr
- Insurance
- −$73
- HOA
- −$0
- Vacancy / Maint / Mgmt
- −$410
- Net cashflow
- $381
Break-even live
Sensitivity live
| Price | -10% $480 | -5% $430 | +0% $381 | +5% $331 | +10% $282 |
|---|---|---|---|---|---|
| Rent | -10% $226 | -5% $303 | +0% $381 | +5% $458 | +10% $535 |
| Rate | -1.0pp $469 | -0.5pp $425 | base $381 | +0.5pp $335 | +1.0pp $289 |
UW: 25.0% down · 7.5% · 30yr · 1.5% tax · 5.0% vac · 8.0% maint · 8.0% mgmt
Financing live
Cash to close
- Down payment
- $43,750
- Closing costs
- $5,250
- Reserves months
- —
- Total cash needed
- —
Loan-product check · same deal, 3 products live
Conventional
25% down · 7.5% · 30yr
- Down + closing
- —
- Monthly P&I
- —
- Monthly cashflow
- —
- DSCR
- —
- Eligible?
- —
Personal DTI + credit; lowest rate.
DSCR
20% down · 8.5% · 30yr
- Down + closing
- —
- Monthly P&I
- —
- Monthly cashflow
- —
- DSCR
- —
- Eligible?
- —
No personal income docs; deal must DSCR.
Hard money
10% down · 12.0% · 12mo
- Down + closing
- —
- Monthly P&I
- —
- Monthly cashflow
- —
- DSCR
- —
- Eligible?
- —
Short-term bridge; refi at stabilization.
Rent comps 40 comps
| Address | Beds | Baths | Sqft | Rent | $/sqft | DOM | Units | Dist |
|---|---|---|---|---|---|---|---|---|
| 349 Woodham Ct Fort Walton Beach, FL | 2.0 | 1.5 | 1184 | $1,450 | $1.22 | 44d | 1 | 0.10mi |
| 348 Woodham Ct Fort Walton Beach, FL | 2.0 | 2.0 | 1251 | $2,800 | $2.24 | 44d | 1 | 0.10mi |
| 214 Tooke St Unit A Fort Walton Beach, FL | 2.0 | 2.5 | 1144 | $1,750 | $1.53 | 44d | 1 | 0.12mi |
| 337 Woodham Ct Fort Walton Beach, FL | 2.0 | 1.5 | 1184 | $1,895 | $1.60 | 22d | 1 | 0.12mi |
| 333 Woodham Ct Fort Walton Beach, FL | 2.0 | 1.5 | 1200 | $1,600 | $1.33 | 44d | 1 | 0.13mi |
| 509 Trenton St Fort Walton Beach, FL | 4.0 | 1.5 | 1296 | $2,000 | $1.54 | 22d | 1 | 0.15mi |
| 16 Woodham Ave Fort Walton Beach, FL | 4.0 | 3.0 | 1600 | $2,000 | $1.25 | 44d | 1 | 0.16mi |
| 848 Stonegate Ct Unit 848 Fort Walton Beach, FL | 2.0 | 1.5 | 1200 | $1,500 | $1.25 | 44d | 1 | 0.21mi |
| 836 Stonegate Ct #836 Fort Walton Beach, FL | 2.0 | 1.5 | 1200 | $1,500 | $1.25 | 44d | 1 | 0.23mi |
| 121 Tooke St Fort Walton Beach, FL | 3.0 | 2.5 | 1510 | $2,000 | $1.32 | 44d | 1 | 0.23mi |
| 712 Newport Dr Fort Walton Beach, FL | 3.0 | 1.0 | 1100 | $1,650 | $1.50 | 44d | 1 | 0.46mi |
| 100 Scranton St Fort Walton Beach, FL | 3.0 | 2.5 | 1437 | $1,850 | $1.29 | 44d | 1 | 0.47mi |
| 941 Harrelson St Fort Walton Beach, FL | 2.0 | 2.5 | 1332 | $1,895 | $1.42 | 44d | 1 | 0.57mi |
| 413 Waterway Ln Fort Walton Beach, FL | 2.0 | 3.0 | 1350 | $1,475 | $1.09 | 44d | 1 | 0.57mi |
| 163 Rickey Ave Fort Walton Beach, FL | 1.0–2.0 | 1.0–2.0 | 995 | $1,300 | $1.31 | 44d | 2 | 0.62mi |
| 910 Barrow St Unit 7 Fort Walton Beach, FL | 2.0 | 2.0 | 1020 | $1,500 | $1.47 | 14d | 1 | 0.64mi |
| 726 Eglin Pkwy NE Unit C11 Fort Walton Beach, FL | 2.0 | 1.0 | 881 | $2,100 | $2.38 | 22d | 1 | 0.64mi |
| 1102 Tiki Too Ave Fort Walton Beach, FL | 2.0 | 2.5 | 1141 | $1,600 | $1.40 | 44d | 1 | 0.68mi |
| 936 Barrow St Unit 5 Fort Walton Beach, FL | 2.0 | 2.0 | 1020 | $1,500 | $1.47 | 44d | 1 | 0.69mi |
| 106 Valencia Dr Fort Walton Beach, FL | 3.0 | 1.5 | 1320 | $1,450 | $1.10 | 22d | 1 | 0.72mi |
| 321 Woodrow St NE Fort Walton Beach, FL | 1.0–3.0 | 1.0–2.0 | 1017 | $1,850 | $1.82 | 14d | 6 | 0.78mi |
| 615 Bob Sikes Blvd #7 Fort Walton Beach, FL | 2.0 | 1.0 | 1190 | $1,500 | $1.26 | 14d | 1 | 0.89mi |
| 615 Bob Sikes Blvd #5 Fort Walton Beach, FL | 2.0 | 1.5 | 1190 | $1,450 | $1.22 | 44d | 1 | 0.89mi |
| 589 Bob Sikes Blvd Fort Walton Beach, FL | 2.0 | 1.0 | 1190 | $1,500 | $1.26 | 44d | 1 | 1.00mi |
| 585 Bob Sikes Blvd Fort Walton Beach, FL | 2.0 | 1.0 | 1190 | $1,550 | $1.30 | 44d | 1 | 1.00mi |
| 5 Laguna St #104 Fort Walton Beach, FL | 2.0 | 2.0 | 1269 | $2,575 | $2.03 | 45d | 1 | 1.00mi |
| 604 Colonial Dr Fort Walton Beach, FL | 1.0–2.0 | 1.0–2.0 | 818 | $1,624 | $1.99 | 44d | 1 | 1.02mi |
| 696 Tyner St #41 Fort Walton Beach, FL | 2.0 | 1.5 | 960 | $1,550 | $1.61 | 14d | 1 | 1.02mi |
| 517 Scott Ln Fort Walton Beach, FL | 3.0 | 2.0 | 980 | $1,595 | $1.63 | 44d | 1 | 1.16mi |
| 115 Beal Pkwy NW Fort Walton Beach, FL | 2.0 | 2.5 | 1440 | $1,995 | $1.39 | 44d | 1 | 1.17mi |
| 800 Denton Blvd NW Fort Walton Beach, FL | 2.0 | 1.0 | 1000 | $1,600 | $1.60 | 14d | 1 | 1.18mi |
| 2415 Suwanee Ln Fort Walton Beach, FL | 2.0 | 1.5 | 1250 | $1,700 | $1.36 | 44d | 1 | 1.22mi |
| 2404 Suwanee Ln Fort Walton Beach, FL | 2.0 | 1.5 | 1242 | $1,700 | $1.37 | 22d | 1 | 1.23mi |
| 2400 Suwanee Ln Fort Walton Beach, FL | 2.0 | 1.5 | 1242 | $1,700 | $1.37 | 22d | 1 | 1.24mi |
| 120 Opp Blvd NE Fort Walton Beach, FL | 2.0 | 1.5 | 1240 | $1,700 | $1.37 | 22d | 1 | 1.26mi |
| 140 Opp Blvd NE Fort Walton Beach, FL | 2.0 | 1.5 | 896 | $1,750 | $1.95 | 44d | 1 | 1.27mi |
| 115 Hughes St NE Unit D2 Fort Walton Beach, FL | 2.0 | 1.0 | 1066 | $1,900 | $1.78 | 22d | 1 | 1.31mi |
| 790 Navy St Fort Walton Beach, FL | 2.0 | 1.0 | 900 | $1,300 | $1.44 | 14d | 1 | 1.31mi |
| 45 Warwick Dr Shalimar, FL | 2.0 | 2.0 | 1150 | $2,800 | $2.43 | 22d | 1 | 1.33mi |
| 400 Rhonda Kay Ct #66 Fort Walton Beach, FL | 3.0 | 1.5 | 1256 | $1,650 | $1.31 | 44d | 1 | 1.43mi |
Listing history 4 events
-
2026-05-01status Pending
-
2026-04-27$175,000 Active
-
1992-08-01soldstatus $52,000
-
1977-01-01soldstatus $10,181
ⓘ Source: listings_history table (triggers on properties + properties_extension) + one-shot
backfill from property_details.listing_events for pre-trigger history.
Tax reassessment forecast FL · Resets to sale price
- Current annual tax
- $2,074 · $173/mo
- Projected year-2 tax
- $2,074 · $173/mo
- Expected delta
- $0/yr ($0/mo · 0.0%)
ⓘ Screening estimate from a state-policy table — verify with the county assessor before closing.
Climate risk First Street
- Flood 6/10 Major FEMA zone X (unshaded) · 54% chance over 30 yrs
- Wildfire 1/10 Low
- Heat 10/10 Extreme 7 d/yr ≥104°F today · 22 d/yr by 30 yrs out
- Wind 9/10 Extreme 99% chance of damaging wind over 30 yrs
- Air quality 2/10 Low 1 unhealthy d/yr today · 2 by 30 yrs out
Nearby sold comps map
Loading sold comps map…
Walkable amenities ~0.75 mi
Loading nearby amenities…
Taxation est. · year 1
- Rental income
- $23,454
- − Mortgage interest
- −$9,803
- − Property taxes
- −$2,074
- − Insurance
- −$875
- − Repairs & maintenance
- −$1,876
- − Management
- −$1,876
- − Depreciation
- −$5,091
- Taxable income
- $1,859
- Est. tax owed @ 24.0%
- −$446
- After-tax cash flow
- $4,121/yr
For passive investors: Depreciation is non-cash, so a rental often shows a tax loss while cash-flowing — sheltering income. Rental losses are passive: they offset passive income freely, and up to $25,000/yr can offset ordinary (W-2) income if you actively participate and your MAGI is under $100k (phasing out to $0 by $150k); unused losses carry forward. On sale, claimed depreciation is recaptured at up to 25%, and gains may owe capital-gains tax (a 1031 exchange can defer both). Figures are a year-1 estimate at your 24.0% rate — not tax advice; consult a CPA.
Schools (NCES district)
- District
- Okaloosa
- NCES district ID
- 1201380
- Math proficiency
- 60% ▼ -12.00%
- Reading proficiency
- 60% ▼ -4.00%
- Median HH income
- $55,601
- Composite
- 51.62/100
- National rank
- #1705
- State rank
- #12 of 73 in FL
Livability — Ocean City
- Score
- 77/100
- State rank
- #179
- US rank
- #2787
Category grades
Schools grade is shown separately in the Schools card above.
Census & demographics
- Census place
- Ocean City, FL
- County
- Okaloosa County · 194,352 people
- Metro
- Crestview-Fort Walton Beach-Destin, FL
- Population (ZIP)
- 35,527
- Household income
- $70,711
- Rent vs Own
- Severe rent burden
- 1203.0
Population outlook (Okaloosa County) Hauer SSP2
- Today (2025)
- 235,133 people
- By 2030
- 253,483 · +7.8%
- By 2040
- 289,537 · +23.1%
- By 2050
- 322,954 · +37.3%
- By 2075
- 399,624 · +70.0%
- By 2100
- 425,311 · +80.9%
Race, ethnicity, and origin ACS 2023
- Neighborhood character
- Diverse neighborhood (Simpson 0.60)
- Race & ethnicity
- White 59% Hispanic / Latino 19% Two or more races 14% Black 11% Asian 3%
- Hispanic origin (detail)
- Mexican 5% Puerto Rican 3% Dominican 1%
- Common ancestry
- Slovak 2% Lithuanian 2% Scotch-Irish 2%
- Foreign-born
- 15% · Canada, Vietnam, Jamaica
- Languages at home
- 81% English-only · Spanish 14% Other Indo-European 1% Vietnamese 1%
Political lean MEDSL · Okaloosa
- 2024 margin
- Solid R (+42.4) · D 28.2% · R 70.7% · Other 1.1%
- 2008→2024 swing
- +2.5pp toward D · 2008: -44.9pp · 2024: -42.4pp
- All cycles
- 2024: R+42.4 2020: R+39.1 2016: R+47.8 2012: R+49.4 2008: R+44.9
Not yet ingested
- Civics
- —
Market trends
- HPI YoY
- ▼ -111.28%
- Current HPI
- 268.6497
- Rent YoY
- ▼ -0.13%
- Metro
- Crestview-Fort Walton Beach-Destin, FL
- State GDP YoY
- ▲ 3.28%
- F500 in state
- 36
Industry mix (Fortune 500 HQ in FL)
| Industry | F500 HQs | Revenue |
|---|---|---|
| Industrial Technology | 2 | $29B |
|
||
| Insurance | 2 | $17B |
|
||
| Retail | 1 | $60B |
|
||
| Technology Distribution | 1 | $58B |
|
||
| Homebuilding | 1 | $35B |
|
||
| Technology Manufacturing | 1 | $35B |
|
||
Price history
+1618.9% since first listed4 events — show timeline
- 2026-05-01 Pending — ECAR
- 2026-04-27 Listed $175,000 ECAR
- 1992-08-01 Sold (Public Records) $52,000 Public Records
- 1977-01-01 Sold (Public Records) $10,181 Public Records
Property tax history
+6.4%/yrLatest (2025): $2,074 · +6.2% YoY. Source: county tax records.
Cash-flow waterfall
monthlySold comps — $/sqft
last 12 mo · ≤1 miLoading sold comps…