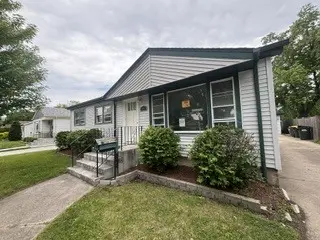
308 Queens Ln · Thornton, IL
Flood risk 1/10 · Minimal
- FEMA flood zone
- X (unshaded)
- Chance of flooding over 30 yrs
- 0.0%
- Est. flood insurance / yr
- $473 – $860
Fire risk 3/10 · Minor
- Est. fire insurance / yr
- $804 – $1,492
Heat risk 3/10 · Minor
- Hot days now (above 102°F)
- 7 days/yr
- Hot days in 30 yrs
- 15 days/yr
Wind risk 2/10 · Minimal
- Chance of severe wind over 30 yrs
- 0.0%
Air-quality risk 4/10 · Minor
- Unhealthy air days now
- 4 days/yr
- Unhealthy air days in 30 yrs
- 5 days/yr
Risk factors via First Street. Map © Google.
Why this score? — see what drove the D- grade
The composite is a weighted blend of 9 inputs, each scored 0–100. Each bar is that input's sub-score; the figure is the points it added to the 100-point composite (weight × sub-score).
- Cash flow +15.1/30.0
- 1% rule +6.9/10.0
- DSCR +4.6/10.0
- Livability +3.8/5.0
- ARV discount +2.9/15.0
- Rent growth +2.5/5.0
- Condition / age +2.5/5.0
- Schools +0.7/10.0
- Appreciation +0.0/10.0
$184,900
🖨 Deal sheet (PDF) 📄 Offer letter ✓ Due diligence
Listing remarks
Fresh price on a freshly updated Thornton home! This well-maintained 3 bedroom, 1 bath home showcases updated flooring, fresh paint, updated lighting, and newer doors throughout. At 1,119 sq ft the layout is functional, bright, and ready for immediate occupancy. Ideally situated near schools, parks, shopping, dining, and major transportation routes making this an outstanding value at the newly adjusted price.
Key facts
- Fresh paint
- Newer doors
- Updated flooring
Tags
Property features AI
Finance
- HOA & community: No master association fee required
Exterior
- Parking: Detached garage; Two garage parking spaces (two total parking spaces)
- Utilities: Public water; Public sewer
- Home design: Detached single-family home; One-story; Fee simple ownership; Built before 1978
- Construction: Vinyl siding
- Exterior features: School bus service
Interior
- Kitchen: Kitchen on the main level; Range; Dishwasher; Refrigerator; Eating area adjacent to the kitchen
- Bedrooms: Three bedrooms (all on the main level); Master bedroom on the main level
- Flooring: Carpet in living room and bedrooms; Vinyl flooring in kitchen and eating area
- Bathrooms: One full bathroom
- Heating & cooling: Natural gas heating; Central air conditioning
- Interior features: Six total rooms; Full unfinished basement
- Laundry & utility: Dedicated laundry room
Neighborhood map
What this means for you Summary
Snapshot
- This is a 3-bed/1.0-bath single-family listed at $185k.
Deal economics
- At list price, monthly cash flow is $61 ($738/yr) — positive.
- The deal already cash-flows at list — no discount required.
- Meets the 1% rule at list price ($2k rent vs $185k).
- Recommended offer: $179k (3.0% below list) — sets the bar for market timing.
Location & tenants
- Location reads 76/100 on livability (#183 in IL, #3,517 nationally) — a middle-class / working-renter tenant base. Strengths: commute A+, cost of living A+, housing A+; Watch: health & safety D+, amenities F.
- Thornton Twp Hsd 205 (suburban): math 7% / reading 8% proficiency, ranked #594 of 620 in IL (top 96%) — low school quality limits family demand, transient renter base, plan for 1-2y turnover.
- Zoned schools: Wolcott School (255 students, 0% FRL); Thornwood High School (math 8% / reading 9%, grade F, #584 of 693 statewide, top 85%, 1,996 students, 0% FRL).
- Market conditions: 9 active listings in the ZIP; 1 comparable units currently listed for rent nearby; 6,272 units permitted in Cook County in 2024 (4,658 in 5+ unit buildings).
Forward outlook
- Local home prices are declining (-3.0%/yr); year-one equity from $1k of loan paydown is wiped out by about $6k of value loss. Plan a longer hold.
Negotiation context
- It's been on market 31 days — a 3% lower offer ($179k) is reasonable based on typical stale-listing flexibility.
- Current owner paid $88k; list at $185k implies a 110% gain — meaningful room to come down on a strong offer.
Risks & watch-outs
- Watch-outs: property tax is 4.1% of price; built in 1958 — expect roof / HVAC / electrical / plumbing capex.
Questions for the listing agent
- It's been on market 31 days. Have you received any prior offers? Is the seller open to a 3% concession, seller financing, or rate buy-down credit?
- Built in 1958 — when were the roof, HVAC, electrical panel, plumbing, and water heater last replaced?
- Property tax is high relative to price — has the assessment been appealed recently, and will the sale trigger a re-assessment?
- Is there a deadline driving the sale (1031 exchange, divorce, estate, relocation)? That informs how much negotiation room exists.
- Schools are F-rated, which usually means shorter tenancies and higher turnover. Who's the typical renter profile here, and what's been the actual vacancy rate?
- The area grade is low — what's the realistic commute time and amenity access for the typical tenant pool here? Any planned neighborhood developments (good or bad) we should know about?
- What's the average days-on-market for RENTAL listings here right now (not sales)? A rising rental-DOM trend means longer vacancies and softer asking-rent achievability than the comps imply.
- What's the recent tenant-quality profile in this submarket — average credit score on applications, eviction rate, late-payment / NSF rate, and stable-employment percentage? A property-management company in the area should have these aggregated.
- How much new for-sale + rental construction is in the pipeline within 1–3 miles? Heavy new supply typically softens prices + rents 12–24 months out; constrained supply supports both.
Investment metrics
- 1% rule
- 1.19% ✓
- Cap rate
- 6.69%
- Cash-on-cash
- 1.42%
- DSCR
- 1.06
- GRM
- 7.0
CMA / ARV
- ARV (on-the-fly)
- $167,850
- Comps found
- 12
Show comp detail 12 sales within ~0.75 mi
| Address | Dist | Beds/Ba | Sqft | Sold | Price | $/sf | Match |
|---|---|---|---|---|---|---|---|
| 413 Water St | 0.05mi | 2/1.0 (-1) | 1,155 (+3%) | 8mo | $169,500 | $147 | 80 |
| 816 Sunnyside Ave | 0.25mi | 4/1.5 (+1) | 1,106 (-1%) | 4mo | $189,500 | $171 | 76 |
| 112 Cora Ct | 0.26mi | 3/1.5 | 1,113 (-0%) | 11mo | $167,500 | $150 | 76 |
| 404 N Kinzie St | 0.13mi | 4/2.0 (+1) | 1,056 (-6%) | 2mo | $165,000 | $156 | 74 |
| 824 Highland Ave | 0.30mi | 3/1.5 | 1,106 (-1%) | 12mo | $160,000 | $145 | 72 |
| 913 Sunnyside Ave | 0.31mi | 3/1.5 | 1,073 (-4%) | 9mo | $122,910 | $115 | 69 |
| 113 N Hunter St | 0.33mi | 3/2.0 | 1,204 (+8%) | 1mo | $180,000 | $150 | 68 |
| 101 N Kinzie St | 0.35mi | 4/1.5 (+1) | 1,067 (-5%) | 5mo | $169,900 | $159 | 65 |
| 805 Highland Ave | 0.25mi | 4/2.0 (+1) | 1,060 (-5%) | 10mo | $225,000 | $212 | 62 |
| 104 Anne Ct | 0.38mi | 3/1.5 | 1,034 (-8%) | 8mo | $133,000 | $129 | 61 |
| 315 Blackstone St | 0.14mi | 3/2.0 | 1,259 (+12%) | 11mo | $125,000 | $99 | 60 |
| 300 Brownell St | 0.56mi | 2/1.0 (-1) | 1,040 (-7%) | 9mo | $146,000 | $140 | 50 |
Match score weights: distance 35% · size 25% · config 20% · recency 20%. Top-matched comps best support the ARV.
Projected returns pro-forma
-3.0% appreciation · 3.0% rent growth · sell at horizon
- IRR
- -13.8%
- Equity multiple
- 0.50×
- Total profit
- $-25,768
- Equity at exit
- $27,569
- IRR
- -4.8%
- Equity multiple
- 0.69×
- Total profit
- $-16,267
- Equity at exit
- $15,987
Cash invested: $51,772 (down + closing). Projections, not guarantees.
Landlord ↔ Tenant lean methodology
- Overall (STATE)
- 43 Moderately Tenant-Leaning
- State Illinois
- 43 Moderately Tenant-Leaning · D+7
- County
- — inherits STATE
- City
- — inherits STATE
ZIP-level market 60476
- Home prices YoY
- -20.4%
- Active inventory
- 9
- Price-to-rent
- 7.0×
Monthly cashflow live
- Estimated rent
- $2,200 medium interval (Pro) →
- Mortgage (P&I)
- −$970
- Tax from tax record
- −$630 /mo · $7,558/yr
- Insurance
- −$77
- HOA
- −$0
- Vacancy / Maint / Mgmt
- −$462
- Net cashflow
- $61
Break-even live
Sensitivity live
| Price | -10% $166 | -5% $114 | +0% $61 | +5% $9 | +10% $-43 |
|---|---|---|---|---|---|
| Rent | -10% $-112 | -5% $-25 | +0% $61 | +5% $148 | +10% $235 |
| Rate | -1.0pp $155 | -0.5pp $109 | base $61 | +0.5pp $14 | +1.0pp $-35 |
UW: 25.0% down · 7.5% · 30yr · 1.5% tax · 5.0% vac · 8.0% maint · 8.0% mgmt
Financing live
Cash to close
- Down payment
- $46,225
- Closing costs
- $5,547
- Reserves months
- —
- Total cash needed
- —
Loan-product check · same deal, 3 products live
Conventional
25% down · 7.5% · 30yr
- Down + closing
- —
- Monthly P&I
- —
- Monthly cashflow
- —
- DSCR
- —
- Eligible?
- —
Personal DTI + credit; lowest rate.
DSCR
20% down · 8.5% · 30yr
- Down + closing
- —
- Monthly P&I
- —
- Monthly cashflow
- —
- DSCR
- —
- Eligible?
- —
No personal income docs; deal must DSCR.
Hard money
10% down · 12.0% · 12mo
- Down + closing
- —
- Monthly P&I
- —
- Monthly cashflow
- —
- DSCR
- —
- Eligible?
- —
Short-term bridge; refi at stabilization.
Rent comps 1 comps
| Address | Beds | Baths | Sqft | Rent | $/sqft | DOM | Units | Dist |
|---|---|---|---|---|---|---|---|---|
| 208 Blackstone St Thornton, IL | 2.0 | 1.5 | 923 | $2,200 | $2.38 | 3d | 1 | 0.21mi |
Listing history 20 events
-
2026-06-21days on market $184,900 Active 31 DOM
-
2026-06-18status $184,900 Active 28 DOM
-
2026-06-18days on market $184,900 Contingent - No Showings 28 DOM
-
2026-06-17days on market $184,900 Contingent - No Showings 27 DOM
-
2026-06-16days on market $184,900 Contingent - No Showings 26 DOM
-
2026-06-16status $184,900 Contingent - No Showings 25 DOM
-
2026-06-15days on market $184,900 Active 25 DOM
-
2026-06-13days on market $184,900 Active 23 DOM
-
2026-06-13remarks 412-char remark
-
2026-06-13pricedays on market $184,900 Active 22 DOM
-
2026-06-09days on market $189,900 Active 19 DOM
-
2026-06-08days on market $189,900 Active 18 DOM
-
2026-06-07days on market $189,900 Active 17 DOM
-
2026-06-04days on market $189,900 Active 14 DOM
-
2026-06-03days on market $189,900 Active 13 DOM
-
2026-06-02days on market $189,900 Active 12 DOM
-
2026-06-01days on market $189,900 Active 11 DOM
-
2026-05-31days on market $189,900 Active 10 DOM
-
2026-05-21$189,900 Active
-
1995-12-19soldstatus $88,000
ⓘ Source: listings_history table (triggers on properties + properties_extension) + one-shot
backfill from property_details.listing_events for pre-trigger history.
Tax reassessment forecast IL · Partial reset (capped growth)
- Current annual tax
- $7,558 · $630/mo
- Projected year-2 tax
- $7,558 · $630/mo
- Expected delta
- $0/yr ($0/mo · 0.0%)
ⓘ Screening estimate from a state-policy table — verify with the county assessor before closing.
Climate risk First Street
- Flood 1/10 Low FEMA zone X (unshaded) · 0% chance over 30 yrs
- Wildfire 3/10 Moderate
- Heat 3/10 Moderate 7 d/yr ≥102°F today · 15 d/yr by 30 yrs out
- Wind 2/10 Low 0% chance of damaging wind over 30 yrs
- Air quality 4/10 Moderate 4 unhealthy d/yr today · 5 by 30 yrs out
Nearby sold comps map
Loading sold comps map…
Walkable amenities ~0.75 mi
Loading nearby amenities…
Taxation est. · year 1
- Rental income
- $26,400
- − Mortgage interest
- −$10,357
- − Property taxes
- −$7,558
- − Insurance
- −$924
- − Repairs & maintenance
- −$2,112
- − Management
- −$2,112
- − Depreciation
- −$5,379
- Taxable loss
- −$2,043
- Est. tax savings @ 24.0%
- +$490
- After-tax cash flow
- $1,228/yr
For passive investors: Depreciation is non-cash, so a rental often shows a tax loss while cash-flowing — sheltering income. Rental losses are passive: they offset passive income freely, and up to $25,000/yr can offset ordinary (W-2) income if you actively participate and your MAGI is under $100k (phasing out to $0 by $150k); unused losses carry forward. On sale, claimed depreciation is recaptured at up to 25%, and gains may owe capital-gains tax (a 1031 exchange can defer both). Figures are a year-1 estimate at your 24.0% rate — not tax advice; consult a CPA.
Schools (NCES district)
- District
- Thornton Twp Hsd 205
- NCES district ID
- 1738970
- Math proficiency
- 7% ▬ 0.00%
- Reading proficiency
- 8% ▼ -2.00%
- Median HH income
- $43,392
- Composite
- 6.92/100
- National rank
- #9976
- State rank
- #594 of 620 in IL
Livability — Thornton
- Score
- 76/100
- State rank
- #183
- US rank
- #3517
Category grades
Schools grade is shown separately in the Schools card above.
Census & demographics
- Census place
- Thornton, IL
- Population (ZIP)
- 1,876
Population outlook (Cook County) Hauer SSP2
- Today (2025)
- 5,347,519 people
- By 2030
- 5,357,703 · +0.2%
- By 2040
- 5,324,924 · -0.4%
- By 2050
- 5,230,762 · -2.2%
- By 2075
- 4,785,735 · -10.5%
- By 2100
- 4,188,836 · -21.7%
Race, ethnicity, and origin ACS 2023
- Neighborhood character
- Diverse neighborhood (Simpson 0.65)
- Race & ethnicity
- White 43% Black 35% Hispanic / Latino 20% Two or more races 3%
- Hispanic origin (detail)
- Mexican 19%
- Common ancestry
- Romanian 8% Iranian 3% Portuguese 1%
- Foreign-born
- 4% · Canada, Jamaica
- Languages at home
- 82% English-only · Spanish 16% Other Indo-European 1%
Political lean MEDSL · Cook
- 2024 margin
- Solid D (+42.0) · D 70.4% · R 28.4% · Other 1.2%
- 2008→2024 swing
- -11.4pp toward R · 2008: 53.4pp · 2024: 42.0pp
- All cycles
- 2024: D+42.0 2020: D+50.3 2016: D+53.0 2012: D+49.4 2008: D+53.4
Not yet ingested
- Civics
- —
Market trends
- HPI YoY
- ▼ -49.92%
- Current HPI
- 194.3119
- Rent YoY
- —
- Metro
- —
- State GDP YoY
- ▲ 1.59%
- F500 in state
- 60
Industry mix (Fortune 500 HQ in IL)
| Industry | F500 HQs | Revenue |
|---|---|---|
| Insurance | 4 | $201B |
|
||
| Consumer Goods | 4 | $87B |
|
||
| Industrial Machinery | 3 | $64B |
|
||
| Healthcare | 2 | $55B |
|
||
| Retail / Pharmacy | 1 | $148B |
|
||
| Agriculture / Food | 1 | $86B |
|
||
Price history
+115.8% since first listed2 events — show timeline
- 2026-05-21 Listed $189,900 MRED as Distributed by MLS Grid
- 1995-12-19 Sold (Public Records) $88,000 Public Records
Property tax history
+5.2%/yrLatest (2023): $7,558 · +33.9% YoY. Source: county tax records.
Cash-flow waterfall
monthlySold comps — $/sqft
last 12 mo · ≤1 miLoading sold comps…