1609 Eckert Ln · Gibsonville, NC
Flood risk No data
- FEMA flood zone
- —
- Chance of flooding over 30 yrs
- —
- Est. flood insurance / yr
- —
Fire risk No data
- Est. fire insurance / yr
- —
Heat risk No data
- Hot days now (above threshold)
- —
- Hot days in 30 yrs
- —
Wind risk No data
- Chance of severe wind over 30 yrs
- —
Air-quality risk No data
- Unhealthy air days now
- —
- Unhealthy air days in 30 yrs
- —
Risk factors via First Street. Map © Google.
Why this score? — see what drove the D grade
The composite is a weighted blend of 9 inputs, each scored 0–100. Each bar is that input's sub-score; the figure is the points it added to the 100-point composite (weight × sub-score).
- Cash flow +8.5/30.0
- ARV discount +8.3/15.0
- Appreciation +5.5/10.0
- Livability +3.7/5.0
- Schools +3.6/10.0
- Rent growth +3.5/5.0
- 1% rule +2.6/10.0
- Condition / age +2.5/5.0
- DSCR +2.3/10.0
$269,890
🖨 Deal sheet (PDF) 📄 Offer letter ✓ Due diligence
Listing remarks MLS
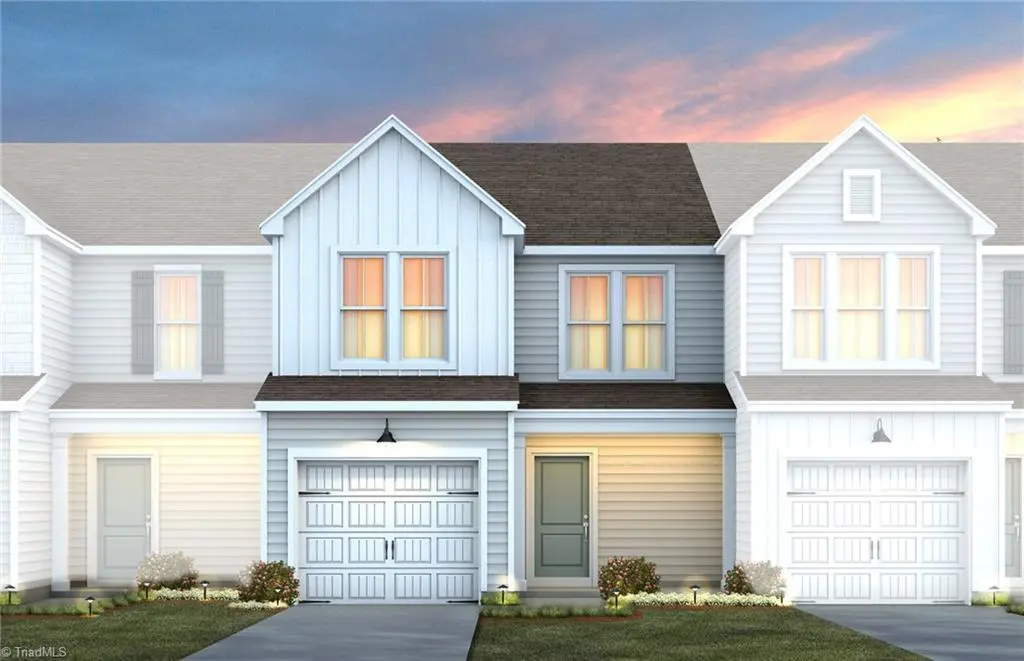
Hatton floorplan with 1,700+ sq ft of open-concept living, elegant finishes, and a spacious backyard made for entertaining. Convenient garage, close to amenities, and time to personalize design selections-make it truly your own before you move in.
Key facts
- Hatton floorplan
- Attached garage
- Large backyard
Tags
Property features AI
Finance
- Other: Building total area: 1,706 (building area provided)
- HOA & community: Association: Greensboro; Subdivision: Poets Walk; Publicly maintained road
Exterior
- Parking: Attached garage (1 car); Driveway; Garage door opener
- Security: Carbon monoxide detector(s); Smoke detector(s)
- Utilities: Public water; Public sewer; Gas water heating (tankless)
- Home design: Townhouse; Stick/site-built residential property; New construction (built 2026); Two levels; New construction entry
- Construction: Vinyl siding; Slab foundation
- Exterior features: Garden; Community pool
Interior
- Kitchen: Microwave; Dishwasher; Disposal; Gas cooktop; Free-standing range
- Bedrooms: Second-floor bedroom (10'9" x 11'5"); Second-floor bedroom (13'1" x 17'1"); Second-floor bedroom (11'1" x 11'4")
- Flooring: Carpet; Tile; Vinyl
- Bathrooms: 2 full bathrooms; 1 half bathroom
- Heating & cooling: Central air (zoned); Forced air heating (zoned); Natural gas heating
- Interior features: Pulldown attic stairs; Deadbolt(s); Kitchen island; Pantry; Separate shower; Solid surface counters
- Laundry & utility: Laundry room; Gas tankless water heater; Gas water heater
Neighborhood map
What this means for you Summary
Snapshot
- This is a 3-bed/2.5-bath townhouse listed at $270k.
Deal economics
- At list price, monthly cash flow is $-239 ($-3k/yr) — negative.
- To cash-flow at today's rent, offer at most $235k (12.8% below list).
- To meet the 1% rule (rent ≥ 1% of price), the offer needs to be $206k (23.8% below list).
- Recommended offer: $206k (23.8% below list) — sets the bar for 1% rule.
- Cap rate 5.2% vs local median 4.2% in Gibsonville — meaningfully above typical; check what's discounted (condition, days-on-market, listing class) to confirm the premium yield is real.
Location & tenants
- Location reads 73/100 on livability (#79 in NC) — a middle-class / working-renter tenant base. Strengths: employment A+, cost of living A+, housing A+; Watch: health & safety C-, amenities F, commute F.
- Guilford County Schools (urban): math 39% / reading 45% proficiency, ranked #99 of 178 in NC (top 56%) — families likely to look elsewhere, expect single-tenant / working-renter base with shorter leases.
- Zoned schools: Gibsonville Elementary (math 46% / reading 46%, grade D-, #551 of 1,410 statewide, top 40%, 564 students, 60% FRL); Eastern Guilford Middle (math 26% / reading 38%, grade F, #317 of 475 statewide, top 68%, 980 students, 75% FRL); Eastern Guilford High (math 25% / reading 37%, grade F, #454 of 535 statewide, top 85%, 1,198 students, 67% FRL) — zoned schools average 68% FRL vs 52% district-wide (15 pts higher); higher-poverty schools than district average — tighter screening recommended.
- Market conditions: Rents rising fast (+4.0%/yr); 105 active listings in the ZIP; 5 comparable units currently listed for rent nearby; rentals at typical pace (median 23d on market — plan ~3-4 weeks tenant-placement turnaround); solid renter incomes; 3,843 units permitted in Guilford County in 2024 (2,397 in 5+ unit buildings).
Forward outlook
- In year one you build about $5k of equity ($2k loan paydown + $3k appreciation (1.0% local appreciation)).
- Guilford County population projected at +26% by 2050 — long-run rental-demand tailwind backs the buy-and-hold thesis.
- By year 7, paydown + projected appreciation supports a ~$31k cash-out refi (75% LTV) — recoverable capital for the next deal without selling this one.
Negotiation context
- It's been on market 58 days — a 3% lower offer ($262k) is reasonable based on typical stale-listing flexibility.
- 2 sale attempts with the ask held roughly flat each time — persistent listings suggest the price (not the market) is what's stuck; bring a comps-based counter.
Questions for the listing agent
- What do current leases actually rent for vs. the listed asking? Can we see a recent rent roll and the last 12 months of T-12 income?
- It's been on market 58 days. Have you received any prior offers? Is the seller open to a 24% concession, seller financing, or rate buy-down credit?
- Is there a deadline driving the sale (1031 exchange, divorce, estate, relocation)? That informs how much negotiation room exists.
- Schools are D-rated, which usually means shorter tenancies and higher turnover. Who's the typical renter profile here, and what's been the actual vacancy rate?
- The area grade is low — what's the realistic commute time and amenity access for the typical tenant pool here? Any planned neighborhood developments (good or bad) we should know about?
- What's the average days-on-market for RENTAL listings here right now (not sales)? A rising rental-DOM trend means longer vacancies and softer asking-rent achievability than the comps imply.
- What's the recent tenant-quality profile in this submarket — average credit score on applications, eviction rate, late-payment / NSF rate, and stable-employment percentage? A property-management company in the area should have these aggregated.
- How much new for-sale + rental construction is in the pipeline within 1–3 miles? Heavy new supply typically softens prices + rents 12–24 months out; constrained supply supports both.
Investment metrics
- 1% rule
- 0.76% ✗
- Cap rate
- 5.23%
- Cash-on-cash
- -3.80%
- DSCR
- 0.83
- GRM
- 10.9
CMA / ARV
- ARV (on-the-fly)
- $274,666
- Comps found
- 12
Show comp detail 12 sales within ~0.75 mi
| Address | Dist | Beds/Ba | Sqft | Sold | Price | $/sf | Match |
|---|---|---|---|---|---|---|---|
| 1584 Eckert Ln | 0.05mi | 3/2.5 | 1,706 (0%) | 1mo | $274,590 | $161 | 97 |
| 1582 Eckert Ln | 0.05mi | 3/2.5 | 1,706 (0%) | 1mo | $280,700 | $165 | 97 |
| 1022 Poets Walk Rd | 0.03mi | 3/2.5 | 1,706 (0%) | 2mo | $268,390 | $157 | 97 |
| 937 Poets Walk Rd | 0.08mi | 3/2.5 | 1,706 (0%) | 1mo | $264,990 | $155 | 95 |
| 930 Poets Walk Rd | 0.10mi | 3/2.5 | 1,706 (0%) | 4mo | $274,990 | $161 | 92 |
| 922 Poets Walk Rd | 0.12mi | 3/2.5 | 1,706 (0%) | 4mo | $259,990 | $152 | 91 |
| 1024 Poets Walk Rd | 0.03mi | 3/2.5 | 1,558 (-9%) | 4mo | $252,500 | $162 | 81 |
| 941 Poets Walk Rd | 0.07mi | 3/2.5 | 1,558 (-9%) | 4mo | $239,990 | $154 | 79 |
| 939 Poets Walk Rd | 0.08mi | 3/2.5 | 1,558 (-9%) | 4mo | $249,990 | $160 | 79 |
| 1002 Poets Walk Rd | 0.06mi | 3/2.5 | 1,558 (-9%) | 6mo | $263,990 | $169 | 78 |
| 924 Poets Walk Rd | 0.11mi | 3/2.5 | 1,558 (-9%) | 4mo | $249,990 | $160 | 77 |
| 206 Cason Dr | 0.67mi | 2/2.0 (-1) | 1,642 (-4%) | 3mo | $315,000 | $192 | 53 |
Match score weights: distance 35% · size 25% · config 20% · recency 20%. Top-matched comps best support the ARV.
Projected returns pro-forma
1.02% appreciation · 4.0% rent growth · sell at horizon
- IRR
- -2.0%
- Equity multiple
- 0.90×
- Total profit
- $-7,870
- Equity at exit
- $92,358
- IRR
- 3.5%
- Equity multiple
- 1.44×
- Total profit
- $33,335
- Equity at exit
- $122,908
Cash invested: $75,569 (down + closing). Projections, not guarantees.
Landlord ↔ Tenant lean methodology
- Overall (STATE)
- 85 Strongly Landlord-Friendly
- State North Carolina
- 85 Strongly Landlord-Friendly · R+3
- County
- — inherits STATE
- City
- — inherits STATE
ZIP-level market 27377
- Home prices YoY
- 0.4%
- Rents YoY
- 4.0%
- Active inventory
- 105
- Price-to-rent
- 10.9×
Monthly cashflow live
- Estimated rent
- $2,058 high interval (Pro) →
- Mortgage (P&I)
- −$1,415
- Tax est. 1.5%
- −$337 /mo · $4,048/yr
- Insurance
- −$112
- HOA
- −$0
- Vacancy / Maint / Mgmt
- −$432
- Net cashflow
- $-239
Break-even live
Sensitivity live
| Price | -10% $-53 | -5% $-146 | +0% $-239 | +5% $-333 | +10% $-426 |
|---|---|---|---|---|---|
| Rent | -10% $-402 | -5% $-321 | +0% $-239 | +5% $-158 | +10% $-77 |
| Rate | -1.0pp $-103 | -0.5pp $-171 | base $-239 | +0.5pp $-309 | +1.0pp $-380 |
UW: 25.0% down · 7.5% · 30yr · 1.5% tax · 5.0% vac · 8.0% maint · 8.0% mgmt
Financing live
Cash to close
- Down payment
- $67,472
- Closing costs
- $8,097
- Reserves months
- —
- Total cash needed
- —
Loan-product check · same deal, 3 products live
Conventional
25% down · 7.5% · 30yr
- Down + closing
- —
- Monthly P&I
- —
- Monthly cashflow
- —
- DSCR
- —
- Eligible?
- —
Personal DTI + credit; lowest rate.
DSCR
20% down · 8.5% · 30yr
- Down + closing
- —
- Monthly P&I
- —
- Monthly cashflow
- —
- DSCR
- —
- Eligible?
- —
No personal income docs; deal must DSCR.
Hard money
10% down · 12.0% · 12mo
- Down + closing
- —
- Monthly P&I
- —
- Monthly cashflow
- —
- DSCR
- —
- Eligible?
- —
Short-term bridge; refi at stabilization.
Rent comps 5 comps
| Address | Beds | Baths | Sqft | Rent | $/sqft | DOM | Units | Dist |
|---|---|---|---|---|---|---|---|---|
| 1022 Poets Walk Rd Unit 1 Whitsett, NC | 3.0 | 2.5 | 1706 | $1,850 | $1.08 | 23d | 1 | 0.03mi |
| 941 Poets Walk Rd Whitsett, NC | 3.0 | 2.5 | 1598 | $1,850 | $1.16 | 25d | 1 | 0.09mi |
| 541 NC Highway 61 Whitsett, NC | 3.0 | 2.5 | 1422 | $1,839 | $1.29 | 16d | 10 | 0.12mi |
| 708 Hawthorn Ridge Dr Whitsett, NC | 3.0 | 2.0 | 2200 | $2,330 | $1.06 | 16d | 1 | 0.40mi |
| 225 Brycewood Dr Burlington, NC | 4.0 | 2.5 | 1929 | $1,860 | $0.96 | 25d | 1 | 0.90mi |
Listing history 19 events
-
2026-06-22days on market $269,890 Active 58 DOM
-
2026-06-18days on market $269,890 Active 55 DOM
-
2026-06-17days on market $269,890 Active 54 DOM
-
2026-06-16days on market $269,890 Active 53 DOM
-
2026-06-15days on market $269,890 Active 52 DOM
-
2026-06-14days on market $269,890 Active 50 DOM
-
2026-06-10days on market $269,890 Active 47 DOM
-
2026-06-09days on market $269,890 Active 46 DOM
-
2026-06-08days on market $269,890 Active 45 DOM
-
2026-06-07days on market $269,890 Active 44 DOM
-
2026-06-03days on market $269,890 Active 40 DOM
-
2026-06-02days on market $269,890 Active 39 DOM
-
2026-06-01days on market $269,890 Active 38 DOM
-
2026-05-31days on market $269,890 Active 37 DOM
-
2026-05-31days on market $269,890 Active 36 DOM
-
2026-05-08price $269,890 247-char remark
Show marketing remark (247 chars)
Hatton floorplan with 1,700+ sq ft of open-concept living, elegant finishes, and a spacious backyard made for entertaining. Convenient garage, close to amenities, and time to personalize design selections-make it truly your own before you move in.
-
2026-05-07price $269,890
-
2026-04-24$268,890 Active
-
2026-04-19$268,890 Active 247-char remark
Show marketing remark (247 chars)
Hatton floorplan with 1,700+ sq ft of open-concept living, elegant finishes, and a spacious backyard made for entertaining. Convenient garage, close to amenities, and time to personalize design selections-make it truly your own before you move in.
ⓘ Source: listings_history table (triggers on properties + properties_extension) + one-shot
backfill from property_details.listing_events for pre-trigger history.
Nearby sold comps map
Loading sold comps map…
Walkable amenities ~0.75 mi
Loading nearby amenities…
Taxation est. · year 1
- Rental income
- $24,695
- − Mortgage interest
- −$15,118
- − Property taxes
- −$4,048
- − Insurance
- −$1,349
- − Repairs & maintenance
- −$1,976
- − Management
- −$1,976
- − Depreciation
- −$7,851
- Taxable loss
- −$7,624
- Est. tax savings @ 24.0%
- +$1,830
- After-tax cash flow
- $-1,043/yr
For passive investors: Depreciation is non-cash, so a rental often shows a tax loss while cash-flowing — sheltering income. Rental losses are passive: they offset passive income freely, and up to $25,000/yr can offset ordinary (W-2) income if you actively participate and your MAGI is under $100k (phasing out to $0 by $150k); unused losses carry forward. On sale, claimed depreciation is recaptured at up to 25%, and gains may owe capital-gains tax (a 1031 exchange can defer both). Figures are a year-1 estimate at your 24.0% rate — not tax advice; consult a CPA.
Schools (NCES district)
- District
- Guilford County Schools
- NCES district ID
- 3701920
- Math proficiency
- 39% ▲ 1.00%
- Reading proficiency
- 45% ▲ 1.00%
- Median HH income
- $46,315
- Composite
- 35.78/100
- National rank
- #4842
- State rank
- #99 of 178 in NC
Livability — Gibsonville
- Score
- 73/100
- State rank
- #79
- US rank
- #5651
Category grades
Schools grade is shown separately in the Schools card above.
Census & demographics
- Census place
- Gibsonville, NC
- County
- Guilford County · 487,190 people
- City population
- 13,741
- Metro
- Greensboro-High Point, NC
- Population (ZIP)
- 10,885
- Household income
- $90,181
- Rent vs Own
- Severe rent burden
- 356.0
Population outlook (Guilford County) Hauer SSP2
- Today (2025)
- 584,596 people
- By 2030
- 616,851 · +5.5%
- By 2040
- 678,451 · +16.1%
- By 2050
- 734,788 · +25.7%
- By 2075
- 862,985 · +47.6%
- By 2100
- 948,704 · +62.3%
Race, ethnicity, and origin ACS 2023
- Neighborhood character
- Diverse neighborhood (Simpson 0.61)
- Race & ethnicity
- White 52% Black 34% Two or more races 8% Hispanic / Latino 5% Asian 2%
- Common ancestry
- Serbian 6% Italian 3% Lithuanian 1%
- Foreign-born
- 5% · Canada, China
- Languages at home
- 95% English-only · Spanish 2% Chinese 1% Other Indo-European 1%
Political lean MEDSL · Guilford
- 2024 margin
- Strong D (+21.8) · D 60.2% · R 38.4% · Other 1.4%
- 2008→2024 swing
- +3.5pp toward D · 2008: 18.4pp · 2024: 21.8pp
- All cycles
- 2024: D+21.8 2020: D+23.1 2016: D+20.0 2012: D+16.5 2008: D+18.4
Not yet ingested
- Civics
- —
Market trends
- HPI YoY
- ▲ 1.02%
- Current HPI
- 232.0638
- Rent YoY
- ▲ 4.00%
- Metro
- Greensboro-High Point, NC
- State GDP YoY
- ▲ 3.28%
- F500 in state
- 26
Industry mix (Fortune 500 HQ in NC)
| Industry | F500 HQs | Revenue |
|---|---|---|
| Financial Services | 2 | $213B |
|
||
| Retail | 2 | $95B |
|
||
| Industrial Conglomerate | 1 | $38B |
|
||
| Metals / Steel | 1 | $35B |
|
||
| Utilities | 1 | $30B |
|
||
| Industrial Machinery | 1 | $19B |
|
||
Price history
+0.4% since first listed4 events — show timeline
- 2026-05-08 Price Changed $269,890 Zillow
- 2026-05-07 Price Changed $269,890 Triad MLS
- 2026-04-24 Listed $268,890 Triad MLS
- 2026-04-19 Listed $268,890 Zillow
Cash-flow waterfall
monthlySold comps — $/sqft
last 12 mo · ≤1 miLoading sold comps…