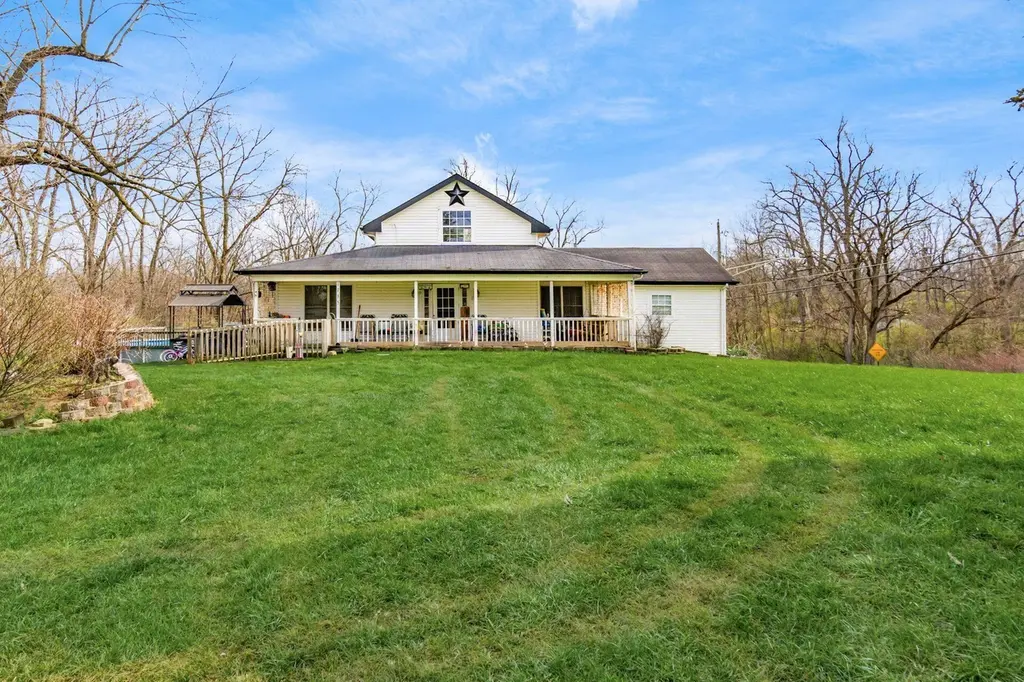
1735 Dyer Rd · Columbus, OH
Flood risk 1/10 · Minimal
- FEMA flood zone
- X (unshaded)
- Chance of flooding over 30 yrs
- 0.0%
- Est. flood insurance / yr
- $507 – $1,088
Fire risk 1/10 · Minimal
- Est. fire insurance / yr
- $713 – $1,323
Heat risk 3/10 · Minor
- Hot days now (above 100°F)
- 6 days/yr
- Hot days in 30 yrs
- 16 days/yr
Wind risk 2/10 · Minimal
- Chance of severe wind over 30 yrs
- 1.0%
Air-quality risk 3/10 · Minor
- Unhealthy air days now
- 2 days/yr
- Unhealthy air days in 30 yrs
- 3 days/yr
Risk factors via First Street. Map © Google.
Why this score? — see what drove the D grade
The composite is a weighted blend of 9 inputs, each scored 0–100. Each bar is that input's sub-score; the figure is the points it added to the 100-point composite (weight × sub-score).
- ARV discount +14.9/15.0
- Cash flow +9.7/30.0
- Livability +4.0/5.0
- Schools +3.8/10.0
- Rent growth +3.4/5.0
- 1% rule +2.8/10.0
- DSCR +2.7/10.0
- Condition / age +2.5/5.0
- Appreciation +0.0/10.0
$274,900
🖨 Deal sheet 📄 Offer letter ✓ Due diligence
Listing remarks MLS
Discover an exceptional 1.77-acre parcel located at 1735 Dyer Road, Columbus, OH 43123, positioned directly across from the new professional soccer training facility and adjacent to Maronda Homes' Sussex subdivision. This high-visibility corner site offers frontage on both Dyer Road and Lazar Road, creating flexible access and strong future development potential. The property currently includes two single-family homes--one is occupied and functional, while the second is not habitable. Utilities are present, and the surrounding area is experiencing rapid residential and commercial growth, making this an ideal opportunity for redevelopment, investment, or long-term hold. With its strategic location, expanding nearby amenities, and dual-road frontage, this parcel offers a rare chance to secure land in a fast-developing corridor just minutes from major routes, schools, and employment centers.
Key facts
- Dual road frontage
- 1.77 acre parcel
- 1.77 acre lot
Tags
Neighborhood map
What this means for you Summary
Snapshot
- This is a 3-bed/1.0-bath single-family listed at $275k.
Deal economics
- At list price, monthly cash flow is $-183 ($-2k/yr) — negative.
- To cash-flow at today's rent, offer at most $243k (11.8% below list).
- To meet the 1% rule (rent ≥ 1% of price), the offer needs to be $216k (21.6% below list).
- Recommended offer: $216k (21.6% below list) — sets the bar for 1% rule.
- Cap rate 5.5% vs local median 3.8% in Columbus — top-decile yield for the area; either an underpriced asset or a hidden risk that comps aren't pricing in. Stress-test before assuming the spread holds.
Location & tenants
- Location reads 81/100 on livability (#97 in OH, #1,491 nationally) — a professional / high-income tenant draw. Strengths: commute A+, cost of living A+, housing A+; Watch: employment C-, crime F.
- South-Western City (suburban): math 40% / reading 48% proficiency, ranked #500 of 656 in OH (top 76%) — families likely to look elsewhere, expect single-tenant / working-renter base with shorter leases.
- Market conditions: Rents rising (+3.7%/yr); 329 active listings in the ZIP; 7 comparable units currently listed for rent nearby; rentals at typical pace (median 15d on market — plan ~3-4 weeks tenant-placement turnaround); solid renter incomes; 8,139 units permitted in Franklin County in 2024 (5,940 in 5+ unit buildings).
Forward outlook
- Local home prices are declining (-3.0%/yr); year-one equity from $2k of loan paydown is wiped out by about $8k of value loss. Plan a longer hold.
- Franklin County population projected at +34% by 2050 — long-run rental-demand tailwind backs the buy-and-hold thesis.
Negotiation context
- It's been on market 101 days — a 9% lower offer ($250k) is reasonable based on typical stale-listing flexibility.
- 2 sale attempts since 2y ago with the ask held roughly flat each time — persistent listings suggest the price (not the market) is what's stuck; bring a comps-based counter.
- Current owner paid $25k; list at $275k implies a 1000% gain — meaningful room to come down on a strong offer.
Risks & watch-outs
- Watch-outs: built in 1940 — expect roof / HVAC / electrical / plumbing capex.
Questions for the listing agent
- What do current leases actually rent for vs. the listed asking? Can we see a recent rent roll and the last 12 months of T-12 income?
- It's been on market 101 days. Have you received any prior offers? Is the seller open to a 22% concession, seller financing, or rate buy-down credit?
- Built in 1940 — when were the roof, HVAC, electrical panel, plumbing, and water heater last replaced?
- Why hasn't it sold? Are there any deal-killer items the seller is aware of (foundation, flood, title, zoning, code violations)?
- Is there a deadline driving the sale (1031 exchange, divorce, estate, relocation)? That informs how much negotiation room exists.
- Crime grade is F in this area — have there been break-ins, vandalism, or insurance claims at this property in the last 3 years? What carrier currently insures it and at what premium?
- The area grade is low — what's the realistic commute time and amenity access for the typical tenant pool here? Any planned neighborhood developments (good or bad) we should know about?
- What's the average days-on-market for RENTAL listings here right now (not sales)? A rising rental-DOM trend means longer vacancies and softer asking-rent achievability than the comps imply.
- What's the recent tenant-quality profile in this submarket — average credit score on applications, eviction rate, late-payment / NSF rate, and stable-employment percentage? A property-management company in the area should have these aggregated.
- How much new for-sale + rental construction is in the pipeline within 1–3 miles? Heavy new supply typically softens prices + rents 12–24 months out; constrained supply supports both.
Investment metrics
- 1% rule
- 0.78% ✗
- Cap rate
- 5.49%
- Cash-on-cash
- -2.85%
- DSCR
- 0.87
- GRM
- 10.6
CMA / ARV
- ARV (median comp)
- $329,150
- List price
- $274,900
- Delta
- -16.48%
- Verdict
- UNDERPRICED
- Comps
- 20 within 1.0 mi
Show comp detail 12 sales within ~0.75 mi
| Address | Dist | Beds/Ba | Sqft | Sold | Price | $/sf | Match |
|---|---|---|---|---|---|---|---|
| 2815 Horsham Dr | 0.20mi | 3/2.5 | 1,571 (-2%) | 6mo | $329,990 | $210 | 77 |
| 1962 Dyer Rd | 0.35mi | 3/1.5 | 1,494 (-7%) | 1mo | $300,000 | $201 | 70 |
| 1345 Costigan Rd | 0.50mi | 3/2.0 | 1,592 (-0%) | 7mo | $297,500 | $187 | 66 |
| 1962 Limetree Ct | 0.54mi | 4/1.5 (+1) | 1,612 (+1%) | 3mo | $315,000 | $195 | 64 |
| 2564 Hardy Parkway St | 0.50mi | 4/2.0 (+1) | 1,588 (-1%) | 7mo | $250,000 | $157 | 61 |
| 1974 New Market Dr | 0.47mi | 3/1.5 | 1,440 (-10%) | 2mo | $264,900 | $184 | 58 |
| 2421 Indian Creek Ct | 0.48mi | 3/2.5 | 1,464 (-8%) | 1mo | $325,000 | $222 | 56 |
| 1463 Channel Pl | 0.39mi | 4/2.5 (+1) | 1,750 (+9%) | 2mo | $307,525 | $176 | 54 |
| 3006 Sussex Place Dr | 0.37mi | 3/2.5 | 1,380 (-14%) | 0mo | $285,000 | $207 | 54 |
| 1818 Rock Creek Dr | 0.57mi | 3/1.5 | 1,464 (-8%) | 7mo | $196,000 | $134 | 52 |
| 2564 Trailwind St | 0.32mi | 4/2.0 (+1) | 1,364 (-15%) | 5mo | $309,700 | $227 | 48 |
| 1497 Billingham Dr | 0.28mi | 4/2.5 (+1) | 1,838 (+15%) | 7mo | $340,000 | $185 | 45 |
Match score weights: distance 35% · size 25% · config 20% · recency 20%. Top-matched comps best support the ARV.
Projected returns pro-forma
-3.0% appreciation · 3.68% rent growth · sell at horizon
- IRR
- -20.3%
- Equity multiple
- 0.29×
- Total profit
- $-54,691
- Equity at exit
- $40,988
- IRR
- -12.0%
- Equity multiple
- 0.27×
- Total profit
- $-56,356
- Equity at exit
- $23,768
Cash invested: $76,972 (down + closing). Projections, not guarantees.
Landlord ↔ Tenant lean methodology
- Overall (STATE)
- 73 Landlord-Friendly
- State Ohio
- 73 Landlord-Friendly · R+6
- County
- — inherits STATE
- City
- — inherits STATE
ZIP-level market 43123
- Rents YoY
- 3.7%
- Active inventory
- 329
- Price-to-rent
- 10.6×
Monthly cashflow live
- Estimated rent
- $2,155 high interval (Pro) →
- Mortgage (P&I)
- −$1,442
- Tax from tax record
- −$329 /mo · $3,953/yr
- Insurance
- −$115
- HOA
- −$0
- Vacancy / Maint / Mgmt
- −$453
- Net cashflow
- $-183
Break-even live
UW: 25.0% down · 7.5% · 30yr · 1.5% tax · 5.0% vac · 8.0% maint · 8.0% mgmt
Financing live
Cash to close
- Down payment
- $68,725
- Closing costs
- $8,247
- Reserves months
- —
- Total cash needed
- —
Loan-product check · same deal, 3 products live
Conventional
25% down · 7.5% · 30yr
- Down + closing
- —
- Monthly P&I
- —
- Monthly cashflow
- —
- DSCR
- —
- Eligible?
- —
Personal DTI + credit; lowest rate.
DSCR
20% down · 8.5% · 30yr
- Down + closing
- —
- Monthly P&I
- —
- Monthly cashflow
- —
- DSCR
- —
- Eligible?
- —
No personal income docs; deal must DSCR.
Hard money
10% down · 12.0% · 12mo
- Down + closing
- —
- Monthly P&I
- —
- Monthly cashflow
- —
- DSCR
- —
- Eligible?
- —
Short-term bridge; refi at stabilization.
Rent comps 7 comps
| Address | Beds | Baths | Sqft | Rent | $/sqft | DOM | Units | Dist |
|---|---|---|---|---|---|---|---|---|
| 1690 Dyer Rd Grove City, OH | 3.0 | 1.5 | 1440 | $1,749 | $1.21 | 21d | 1 | 0.17mi |
| 2787 Horsham Dr Grove City, OH | 4.0 | 2.5 | 2026 | $2,599 | $1.28 | 1d | 1 | 0.17mi |
| 2656 Willowgate Rd Grove City, OH | 4.0 | 2.5 | 1820 | $2,625 | $1.44 | 1d | 1 | 0.41mi |
| 1576 Rock Creek Dr Grove City, OH | 3.0 | 2.5 | 1450 | $2,050 | $1.41 | 14d | 1 | 0.60mi |
| 2290 Turquoise Dr Grove City, OH | 3.0 | 1.0 | 1232 | $2,225 | $1.81 | 16d | 1 | 1.20mi |
| 2348 Warfield Dr Grove City, OH | 4.0 | 2.0 | 1262 | $1,825 | $1.45 | 44d | 1 | 1.23mi |
| 2422 Salem Ave Grove City, OH | 4.0 | 1.5 | 1910 | $2,555 | $1.34 | 1d | 1 | 1.43mi |
Listing history 5 events
-
2026-02-18$274,900 Active 901-char remark
Show marketing remark (901 chars)
Discover an exceptional 1.77-acre parcel located at 1735 Dyer Road, Columbus, OH 43123, positioned directly across from the new professional soccer training facility and adjacent to Maronda Homes' Sussex subdivision. This high-visibility corner site offers frontage on both Dyer Road and Lazar Road, creating flexible access and strong future development potential. The property currently includes two single-family homes--one is occupied and functional, while the second is not habitable. Utilities are present, and the surrounding area is experiencing rapid residential and commercial growth, making this an ideal opportunity for redevelopment, investment, or long-term hold. With its strategic location, expanding nearby amenities, and dual-road frontage, this parcel offers a rare chance to secure land in a fast-developing corridor just minutes from major routes, schools, and employment centers.
-
2025-11-25historical
-
2025-02-10price $304,000
-
2024-10-02$399,989 Active
-
1994-12-19soldstatus $25,000
ⓘ Source: listings_history table (triggers on properties + properties_extension) + one-shot
backfill from property_details.listing_events for pre-trigger history.
Tax reassessment forecast OH · Partial reset (capped growth)
- Current annual tax
- $3,953 · $329/mo
- Projected year-2 tax
- $4,121 · $343/mo
- Expected delta
- +$168/yr (+$14/mo · 4.2%)
ⓘ Screening estimate from a state-policy table — verify with the county assessor before closing.
Climate risk First Street
- Flood 1/10 Low FEMA zone X (unshaded) · 0% chance over 30 yrs
- Wildfire 1/10 Low
- Heat 3/10 Moderate 6 d/yr ≥100°F today · 16 d/yr by 30 yrs out
- Wind 2/10 Low 100% chance of damaging wind over 30 yrs
- Air quality 3/10 Moderate 2 unhealthy d/yr today · 3 by 30 yrs out
Nearby sold comps map
Loading sold comps map…
Walkable amenities ~0.75 mi
Loading nearby amenities…
Taxation est. · year 1
- Rental income
- $25,863
- − Mortgage interest
- −$15,399
- − Property taxes
- −$3,953
- − Insurance
- −$1,374
- − Repairs & maintenance
- −$2,069
- − Management
- −$2,069
- − Depreciation
- −$7,997
- Taxable loss
- −$6,999
- Est. tax savings @ 24.0%
- +$1,680
- After-tax cash flow
- $-516/yr
For passive investors: Depreciation is non-cash, so a rental often shows a tax loss while cash-flowing — sheltering income. Rental losses are passive: they offset passive income freely, and up to $25,000/yr can offset ordinary (W-2) income if you actively participate and your MAGI is under $100k (phasing out to $0 by $150k); unused losses carry forward. On sale, claimed depreciation is recaptured at up to 25%, and gains may owe capital-gains tax (a 1031 exchange can defer both). Figures are a year-1 estimate at your 24.0% rate — not tax advice; consult a CPA.
Schools (NCES district)
- District
- South-Western City
- NCES district ID
- 3904480
- Math proficiency
- 40% ▼ -18.00%
- Reading proficiency
- 48% ▼ -10.00%
- Median HH income
- $51,689
- Composite
- 37.95/100
- National rank
- #4305
- State rank
- #500 of 656 in OH
Livability — Columbus
- Score
- 81/100
- State rank
- #97
- US rank
- #1491
Category grades
Schools grade is shown separately in the Schools card above.
Census & demographics
- Census place
- Columbus, OH
- County
- Franklin County · 1,351,780 people
- City population
- 612,189
- Metro
- Columbus, OH
- Population (ZIP)
- 67,626
- Household income
- $91,008
- Rent vs Own
- Severe rent burden
- 1087.0
Population outlook (Franklin County) Hauer SSP2
- Today (2025)
- 1,456,139 people
- By 2030
- 1,556,890 · +6.9%
- By 2040
- 1,757,349 · +20.7%
- By 2050
- 1,950,539 · +34.0%
- By 2075
- 2,376,171 · +63.2%
- By 2100
- 2,636,796 · +81.1%
Race, ethnicity, and origin ACS 2023
- Neighborhood character
- Predominantly White (84%)
- Race & ethnicity
- White 84% Two or more races 6% Hispanic / Latino 5% Black 5% Asian 2%
- Common ancestry
- Romanian 2% Slovak 2% Italian 2%
- Foreign-born
- 4% · Canada, Vietnam, China
- Languages at home
- 93% English-only · Spanish 3% Russian/Polish/Slavic 1% Other Indo-European 1%
Political lean MEDSL · Franklin
- 2024 margin
- Strong D (+28.4) · D 63.7% · R 35.3% · Other 1.0%
- 2008→2024 swing
- +7.7pp toward D · 2008: 20.7pp · 2024: 28.4pp
- All cycles
- 2024: D+28.4 2020: D+31.4 2016: D+25.9 2012: D+21.7 2008: D+20.7
Not yet ingested
- Civics
- —
Market trends
- HPI YoY
- ▼ -241.42%
- Current HPI
- 238.709
- Rent YoY
- ▲ 3.68%
- Metro
- Columbus, OH
- State GDP YoY
- ▲ 1.98%
- F500 in state
- 48
Industry mix (Fortune 500 HQ in OH)
| Industry | F500 HQs | Revenue |
|---|---|---|
| Insurance | 3 | $145B |
|
||
| Industrial Machinery | 3 | $49B |
|
||
| Financial Services | 3 | $24B |
|
||
| Consumer Goods | 2 | $93B |
|
||
| Aerospace / Defense | 2 | $47B |
|
||
| Utilities | 2 | $33B |
|
||
Price history
+999.6% since first listed5 events — show timeline
- 2026-02-18 Listed $274,900 CBRMLS
- 2025-11-25 Listing Removed — CBRMLS
- 2025-02-10 Price Changed $304,000 CBRMLS
- 2024-10-02 Listed $399,989 CBRMLS
- 1994-12-19 Sold (Public Records) $25,000 Public Records
Property tax history
+4.6%/yrLatest (2024): $3,953 · -14.0% YoY. Source: county tax records.
Cash-flow waterfall
monthlySold comps — $/sqft
last 12 mo · ≤1 miLoading sold comps…