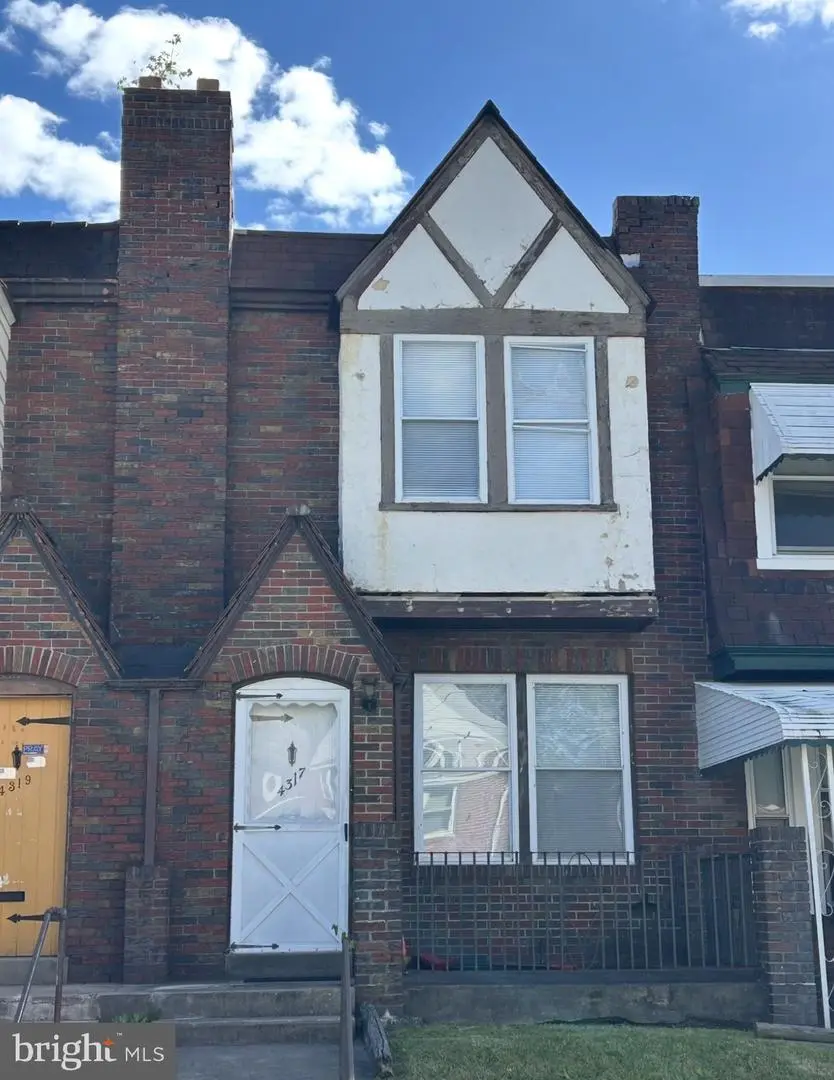
4317 Berger Ave · Baltimore, MD
Flood risk 1/10 · Minimal
- FEMA flood zone
- X (unshaded)
- Chance of flooding over 30 yrs
- 0.0%
- Est. flood insurance / yr
- $473 – $860
Fire risk 1/10 · Minimal
- Est. fire insurance / yr
- $755 – $1,403
Heat risk 7/10 · Major
- Hot days now (above 103°F)
- 7 days/yr
- Hot days in 30 yrs
- 15 days/yr
Wind risk 6/10 · Moderate
- Chance of severe wind over 30 yrs
- 27.0%
Air-quality risk 5/10 · Moderate
- Unhealthy air days now
- 6 days/yr
- Unhealthy air days in 30 yrs
- 8 days/yr
Risk factors via First Street. Map © Google.
Why this score? — see what drove the B grade
The composite is a weighted blend of 9 inputs, each scored 0–100. Each bar is that input's sub-score; the figure is the points it added to the 100-point composite (weight × sub-score).
- Cash flow +27.5/30.0
- ARV discount +15.0/15.0
- DSCR +9.6/10.0
- 1% rule +7.6/10.0
- Livability +3.8/5.0
- Rent growth +3.6/5.0
- Condition / age +2.5/5.0
- Schools +1.0/10.0
- Appreciation +0.0/10.0
$149,000
🖨 Deal sheet 📄 Offer letter ✓ Due diligence
Listing remarks
This charming 3-bedroom, 2-bathroom brick townhouse in Baltimore’s Frankford neighborhood offers 1,152 square feet of living space across two levels. Built in 1931, the home blends classic architectural character with modern upgrades, offering a fantastic opportunity for buyers seeking a property with a strong structural foundation and high-value interior updates.
Key facts
- Built 1931
- Listed 13 days
Property features AI
Finance
- Financial info: Ownership: Fee simple
Exterior
- Utilities: Public water; Public sewer; Hot water: other; Heating fuel: other; Cooling fuel: other
- Home design: Interior townhouse / rowhouse; Above-grade finished area reported by assessor
- Construction: Brick construction; Shingle roof; Foundation: other; Other structures above and below grade; Above-grade finished area: 1,152 (assessor); Below-grade unfinished area: 540 (assessor); Total below-grade area: 540
- Exterior features: Ground rent paid annually; No tidal water
Interior
- Bedrooms: Three bedrooms on the main level
- Bathrooms: Two full bathrooms (both on the main level)
- Heating & cooling: Radiator heating; Cooling: other system
- Interior features: Basement present (other type); Living area source: Assessor
Neighborhood map
What this means for you Summary
Snapshot
- This is a 3-bed/1.5-bath townhouse listed at $149k.
Deal economics
- At list price, monthly cash flow is $440 ($5k/yr) — positive.
- The deal already cash-flows at list — no discount required.
- Meets the 1% rule at list price ($2k rent vs $149k).
- Cap rate 9.8% vs local median 6.0% in Baltimore — top-decile yield for the area; either an underpriced asset or a hidden risk that comps aren't pricing in. Stress-test before assuming the spread holds.
Location & tenants
- Location reads 76/100 on livability (#90 in MD, #3,396 nationally) — a middle-class / working-renter tenant base. Strengths: amenities A+, commute A+, housing A+; Watch: schools D, crime F.
- Baltimore City Public Schools (urban): math 7% / reading 16% proficiency, ranked #24 of 24 in MD (top 100%) — low school quality limits family demand, transient renter base, plan for 1-2y turnover; 79% free/reduced lunch — lower-income household profile, screen leases tightly.
- Market conditions: Rents rising fast (+4.4%/yr); 173 active listings in the ZIP; 40 comparable units currently listed for rent nearby; rentals at typical pace (median 24d on market — plan ~3-4 weeks tenant-placement turnaround); 1,273 units permitted in Baltimore city in 2024 (1,104 in 5+ unit buildings).
- This rent runs 35% of the median local income ($65k/yr) — at the standard rent-burdened threshold; future hikes will face affordability resistance.
Forward outlook
- Local home prices are declining (-3.0%/yr); year-one equity from $1k of loan paydown is wiped out by about $4k of value loss. Plan a longer hold.
- Baltimore County population projected to shrink 4% by 2050 — rents likely to lag national; underwrite the cash flow, not the appreciation.
- At projected returns (-3.0% appreciation + 4.4% rent growth), your $42k cash investment doubles in ~8 years — after that, you're playing with house money.
Negotiation context
- Only 13 days on market — expect competitive offers; lowballing is unlikely to land.
- 4 sale attempts since 28y ago with the ask held roughly flat each time — persistent listings suggest the price (not the market) is what's stuck; bring a comps-based counter.
- Current owner paid $116k; 29% above their basis — modest negotiation headroom, anchor on the comps not their cost.
Risks & watch-outs
- Watch-outs: built in 1931 — expect roof / HVAC / electrical / plumbing capex.
- Climate carrying-cost: major wind risk, 27% chance of damaging wind over 30y; extreme-heat days projected 7→15/yr by 2055 (HVAC capex compounding) — expect insurance premiums to compound above CPI over the hold.
Questions for the listing agent
- Built in 1931 — when were the roof, HVAC, electrical panel, plumbing, and water heater last replaced?
- Is there a deadline driving the sale (1031 exchange, divorce, estate, relocation)? That informs how much negotiation room exists.
- Schools are D-rated, which usually means shorter tenancies and higher turnover. Who's the typical renter profile here, and what's been the actual vacancy rate?
- Crime grade is F in this area — have there been break-ins, vandalism, or insurance claims at this property in the last 3 years? What carrier currently insures it and at what premium?
- What's the average days-on-market for RENTAL listings here right now (not sales)? A rising rental-DOM trend means longer vacancies and softer asking-rent achievability than the comps imply.
- What's the recent tenant-quality profile in this submarket — average credit score on applications, eviction rate, late-payment / NSF rate, and stable-employment percentage? A property-management company in the area should have these aggregated.
- How much new for-sale + rental construction is in the pipeline within 1–3 miles? Heavy new supply typically softens prices + rents 12–24 months out; constrained supply supports both.
Investment metrics
- 1% rule
- 1.26% ✓
- Cap rate
- 9.84%
- Cash-on-cash
- 12.65%
- DSCR
- 1.56
- GRM
- 6.6
CMA / ARV
- ARV (on-the-fly)
- $205,056
- Comps found
- 12
Show comp detail 12 sales within ~0.75 mi
| Address | Dist | Beds/Ba | Sqft | Sold | Price | $/sf | Match |
|---|---|---|---|---|---|---|---|
| 4217 Berger Ave | 0.05mi | 3/2.5 | 1,168 (+1%) | 7mo | $185,000 | $158 | 86 |
| 4332 Berger Ave | 0.04mi | 3/2.0 | 1,212 (+5%) | 8mo | $175,000 | $144 | 81 |
| 4108 White Ave | 0.38mi | 3/2.0 | 1,152 (0%) | 5mo | $108,500 | $94 | 76 |
| 3723 Bayonne Ave | 0.56mi | 3/1.5 | 1,200 (+4%) | 0mo | $230,000 | $192 | 67 |
| 5016 Belair Rd | 0.48mi | 3/1.0 | 1,176 (+2%) | 10mo | $75,000 | $64 | 64 |
| 3828 Bayonne Ave | 0.52mi | 4/3.0 (+1) | 1,152 (0%) | 5mo | $233,000 | $202 | 60 |
| 5421 Belle Vista Ave | 0.29mi | 3/2.0 | 1,320 (+15%) | 8mo | $235,000 | $178 | 54 |
| 5026 Edgar Ter | 0.73mi | 3/2.0 | 1,200 (+4%) | 5mo | $245,000 | $204 | 53 |
| 5876 Belair Rd | 0.50mi | 2/1.5 (-1) | 1,044 (-9%) | 9mo | $149,000 | $143 | 48 |
| 4009 Belwood Ave | 0.47mi | 4/2.0 (+1) | 1,300 (+13%) | 3mo | $267,000 | $205 | 48 |
| 5903 Lillyan Ave | 0.57mi | 3/2.0 | 1,024 (-11%) | 7mo | $200,000 | $195 | 47 |
| 5904 Willet Ave | 0.72mi | 2/1.0 (-1) | 1,258 (+9%) | 5mo | $180,000 | $143 | 40 |
Match score weights: distance 35% · size 25% · config 20% · recency 20%. Top-matched comps best support the ARV.
Projected returns pro-forma
-3.0% appreciation · 4.43% rent growth · sell at horizon
- IRR
- 4.1%
- Equity multiple
- 1.16×
- Total profit
- $6,643
- Equity at exit
- $22,216
- IRR
- 14.9%
- Equity multiple
- 2.28×
- Total profit
- $53,575
- Equity at exit
- $12,883
Cash invested: $41,720 (down + closing). Projections, not guarantees.
Landlord ↔ Tenant lean methodology
- Overall (CITY)
- 12 Strongly Tenant-Friendly
- State Maryland
- 27 Tenant-Leaning · D+14
- County
- — inherits STATE
- City Baltimore
- 12 Strongly Tenant-Friendly · D+58
ZIP-level market 21206
- Rents YoY
- 4.4%
- Active inventory
- 173
- Price-to-rent
- 6.6×
Monthly cashflow live
- Estimated rent
- $1,877 high interval (Pro) →
- Mortgage (P&I)
- −$781
- Tax from tax record
- −$200 /mo · $2,396/yr
- Insurance
- −$62
- HOA
- −$0
- Vacancy / Maint / Mgmt
- −$394
- Net cashflow
- $440
Break-even live
UW: 25.0% down · 7.5% · 30yr · 1.5% tax · 5.0% vac · 8.0% maint · 8.0% mgmt
Financing live
Cash to close
- Down payment
- $37,250
- Closing costs
- $4,470
- Reserves months
- —
- Total cash needed
- —
Loan-product check · same deal, 3 products live
Conventional
25% down · 7.5% · 30yr
- Down + closing
- —
- Monthly P&I
- —
- Monthly cashflow
- —
- DSCR
- —
- Eligible?
- —
Personal DTI + credit; lowest rate.
DSCR
20% down · 8.5% · 30yr
- Down + closing
- —
- Monthly P&I
- —
- Monthly cashflow
- —
- DSCR
- —
- Eligible?
- —
No personal income docs; deal must DSCR.
Hard money
10% down · 12.0% · 12mo
- Down + closing
- —
- Monthly P&I
- —
- Monthly cashflow
- —
- DSCR
- —
- Eligible?
- —
Short-term bridge; refi at stabilization.
Rent comps 40 comps
| Address | Beds | Baths | Sqft | Rent | $/sqft | DOM | Units | Dist |
|---|---|---|---|---|---|---|---|---|
| 5632 Belair Rd Baltimore, MD | 3.0 | 1.5 | 1260 | $2,100 | $1.67 | 23d | 1 | 0.20mi |
| 4308 Hamilton Ave Baltimore, MD | 2.0 | 1.0 | 1110 | $1,416 | $1.28 | 23d | 1 | 0.23mi |
| 5424 Belle Vista Ave Baltimore, MD | 2.0 | 1.0 | 932 | $1,300 | $1.39 | 43d | 1 | 0.32mi |
| 4007 Biddison Ln Apt 1 Baltimore, MD | 2.0 | 1.0 | 1000 | $1,279 | $1.28 | 17d | 1 | 0.41mi |
| 4023 Belwood Ave Baltimore, MD | 3.0 | 1.0 | 1080 | $1,995 | $1.85 | 43d | 1 | 0.44mi |
| 4104 Parkwood Ave Baltimore, MD | 3.0 | 1.0 | 1224 | $2,800 | $2.29 | 23d | 1 | 0.49mi |
| 3802 Biddison Ln Baltimore, MD | 4.0 | 1.5 | 1443 | $2,024 | $1.40 | 11d | 1 | 0.51mi |
| 5906 Benton Heights Ave Baltimore, MD | 2.0 | 1.0 | 780 | $1,350 | $1.73 | 43d | 1 | 0.55mi |
| 4111 Century Rd Baltimore, MD | 3.0 | 1.5 | 1432 | $2,500 | $1.75 | 43d | 1 | 0.58mi |
| 4903 1/2 Hamilton Ave Unit A Baltimore, MD | 2.0 | 2.0 | 800 | $1,450 | $1.81 | 23d | 1 | 0.65mi |
| 4903 1/2 Hamilton Ave Apt B Baltimore, MD | 3.0 | 2.0 | 925 | $1,550 | $1.68 | 23d | 1 | 0.65mi |
| 4905 Hamilton Ave Apt B Baltimore, MD | 3.0 | 2.0 | 925 | $1,550 | $1.68 | 23d | 1 | 0.65mi |
| 4517 Woodlea Ave Baltimore, MD | 2.0 | 2.0 | 1326 | $1,900 | $1.43 | 2d | 1 | 0.65mi |
| 4924 Frankford Ave Baltimore, MD | 4.0 | 2.0 | 1176 | $2,600 | $2.21 | 23d | 1 | 0.66mi |
| 4907 Hamilton Ave Unit B Baltimore, MD | 3.0 | 2.0 | 925 | $1,699 | $1.84 | 43d | 1 | 0.66mi |
| 4909 Hamilton Ave Baltimore, MD | 2.0–3.0 | 2.0 | 862 | $1,550 | $1.80 | 2d | 5 | 0.68mi |
| 5904 Arizona Ave Unit B Baltimore, MD | 3.0 | 2.0 | 925 | $1,550 | $1.68 | 23d | 1 | 0.69mi |
| 3607 Bayonne Ave Unit 2 Baltimore, MD | 2.0 | 1.0 | 900 | $1,300 | $1.44 | 23d | 1 | 0.72mi |
| 5738 Cedonia Ave Baltimore, MD | 2.0 | 1.0 | 797 | $1,385 | $1.74 | 2d | 3 | 0.76mi |
| 5313 Todd Ave Baltimore, MD | 3.0 | 1.5 | 1280 | $1,800 | $1.41 | 16d | 1 | 0.87mi |
| 4901 Gunther Ave Baltimore, MD | 1.0–3.0 | 1.0–2.0 | 742 | $1,463 | $1.97 | 2d | 1 | 0.93mi |
| 4409 Moravia Rd Baltimore, MD | 2.0 | 1.0 | 861 | $1,385 | $1.61 | 43d | 3 | 0.95mi |
| 3309 Southern Ave Unit 2 Baltimore, MD | 2.0 | 1.0 | 1200 | $1,600 | $1.33 | 12d | 1 | 0.95mi |
| 5253 Cedgate Rd Unit 1 Baltimore, MD | 3.0 | 1.5 | 1152 | $2,200 | $1.91 | 43d | 1 | 1.07mi |
| 3021 Echodale Ave Unit 2 Baltimore, MD | 2.0 | 1.0 | 750 | $999 | $1.33 | 43d | 1 | 1.07mi |
| 3033 Hamilton Ave Unit 1R Baltimore, MD | 2.0 | 1.0 | 720 | $1,195 | $1.66 | 4d | 1 | 1.10mi |
| 4400 Asbury Ave Baltimore, MD | 3.0 | 2.0 | 1270 | $1,995 | $1.57 | 4d | 1 | 1.10mi |
| 3014 Hamilton Ave Unit 1 Baltimore, MD | 2.0 | 1.0 | 850 | $1,575 | $1.85 | 23d | 1 | 1.11mi |
| 5305 Moravia Rd Baltimore, MD | 3.0 | 1.0 | 679 | $1,993 | $2.93 | 2d | 1 | 1.14mi |
| 4320 Sheldon Ave Baltimore, MD | 3.0 | 1.5 | 1280 | $1,800 | $1.41 | 23d | 1 | 1.16mi |
| 4024 Eierman Ave Baltimore, MD | 3.0 | 2.0 | 1136 | $1,825 | $1.61 | 43d | 1 | 1.18mi |
| 6042 Barstow Rd Baltimore, MD | 1.0–3.0 | 1.0 | 736 | $1,527 | $2.07 | 2d | 1 | 1.20mi |
| 2900 Ailsa Ave Apt 2 Baltimore, MD | 3.0 | 1.0 | 1300 | $1,750 | $1.35 | 4d | 1 | 1.24mi |
| 6410 Walther Ave Baltimore, MD | 2.0 | 1.0–2.0 | 1195 | $1,995 | $1.67 | 43d | 7 | 1.26mi |
| 5938 Clayton Ave Baltimore, MD | 4.0 | 2.0 | 1296 | $2,872 | $2.22 | 16d | 1 | 1.30mi |
| 2807 Shirey Ave Baltimore, MD | 4.0 | 3.0 | 1190 | $2,500 | $2.10 | 14d | 1 | 1.31mi |
| 5611 Force Rd Baltimore, MD | 3.0 | 1.5 | 1296 | $1,850 | $1.43 | 43d | 1 | 1.34mi |
| 2805 Hamilton Ave Baltimore, MD | 4.0 | 2.0 | 1416 | $2,300 | $1.62 | 43d | 1 | 1.36mi |
| 3807 Fleetwood Ave Unit 2 Baltimore, MD | 3.0 | 1.0 | 937 | $1,550 | $1.65 | 4d | 1 | 1.38mi |
| 3807 Fleetwood Ave Unit 1 Baltimore, MD | 2.0 | 1.0 | 969 | $1,490 | $1.54 | 4d | 1 | 1.38mi |
Listing history 9 events
-
2026-06-18days on market $149,000 Active 13 DOM
-
2026-06-17days on market $149,000 Active 12 DOM
-
2026-06-16days on market $149,000 Active 11 DOM
-
2026-06-15days on market $149,000 Active 10 DOM
-
2026-06-13days on market $149,000 Active 8 DOM
-
2026-06-09days on market $149,000 Active 4 DOM
-
2026-06-08days on market $149,000 Active 3 DOM
-
2026-06-07remarks 366-char remark
-
2026-06-07$149,000 Active 2 DOM
ⓘ Source: listings_history table (triggers on properties + properties_extension) + one-shot
backfill from property_details.listing_events for pre-trigger history.
Tax reassessment forecast MD · Partial reset (capped growth)
- Current annual tax
- $2,396 · $200/mo
- Projected year-2 tax
- $2,396 · $200/mo
- Expected delta
- $0/yr ($0/mo · 0.0%)
ⓘ Screening estimate from a state-policy table — verify with the county assessor before closing.
Climate risk First Street
- Flood 1/10 Low FEMA zone X (unshaded) · 0% chance over 30 yrs
- Wildfire 1/10 Low
- Heat 7/10 Severe 7 d/yr ≥103°F today · 15 d/yr by 30 yrs out
- Wind 6/10 Major 27% chance of damaging wind over 30 yrs
- Air quality 5/10 Major 6 unhealthy d/yr today · 8 by 30 yrs out
Nearby sold comps map
Loading sold comps map…
Walkable amenities ~0.75 mi
Loading nearby amenities…
Taxation est. · year 1
- Rental income
- $22,525
- − Mortgage interest
- −$8,346
- − Property taxes
- −$2,396
- − Insurance
- −$745
- − Repairs & maintenance
- −$1,802
- − Management
- −$1,802
- − Depreciation
- −$4,335
- Taxable income
- $3,100
- Est. tax owed @ 24.0%
- −$744
- After-tax cash flow
- $4,534/yr
For passive investors: Depreciation is non-cash, so a rental often shows a tax loss while cash-flowing — sheltering income. Rental losses are passive: they offset passive income freely, and up to $25,000/yr can offset ordinary (W-2) income if you actively participate and your MAGI is under $100k (phasing out to $0 by $150k); unused losses carry forward. On sale, claimed depreciation is recaptured at up to 25%, and gains may owe capital-gains tax (a 1031 exchange can defer both). Figures are a year-1 estimate at your 24.0% rate — not tax advice; consult a CPA.
Schools (NCES district)
- District
- Baltimore City Public Schools
- NCES district ID
- 2400090
- Math proficiency
- 7% ▼ -9.00%
- Reading proficiency
- 16% ▼ -5.00%
- Median HH income
- $42,108
- Composite
- 10.08/100
- National rank
- #9805
- State rank
- #24 of 24 in MD
Livability — Baltimore
- Score
- 76/100
- State rank
- #90
- US rank
- #3396
Category grades
Schools grade is shown separately in the Schools card above.
Census & demographics
- Census place
- Baltimore, MD
- County
- Baltimore City · 558,601 people
- City population
- 588,727
- Metro
- Baltimore-Columbia-Towson, MD
- Population (ZIP)
- 48,902
- Household income
- $64,531
- Rent vs Own
- Severe rent burden
- 2317.0
Population outlook (Baltimore County) Hauer SSP2
- Today (2025)
- 624,249 people
- By 2030
- 621,541 · -0.4%
- By 2040
- 609,756 · -2.3%
- By 2050
- 597,249 · -4.3%
- By 2075
- 552,236 · -11.5%
- By 2100
- 513,934 · -17.7%
Race, ethnicity, and origin ACS 2023
- Neighborhood character
- Predominantly Black (73%)
- Race & ethnicity
- Black 73% White 20% Two or more races 3% Hispanic / Latino 3% Asian 2%
- Common ancestry
- Romanian 3% Ukrainian 1%
- Foreign-born
- 8% · Canada
- Languages at home
- 92% English-only · Spanish 2% Arabic 2% Other Indo-European 1%
Political lean MEDSL · Baltimore
- 2024 margin
- Solid D (+73.0) · D 85.2% · R 12.2% · Other 2.6%
- 2008→2024 swing
- -2.5pp toward R · 2008: 75.5pp · 2024: 73.0pp
- All cycles
- 2024: D+73.0 2020: D+76.6 2016: D+74.6 2012: D+76.4 2008: D+75.5
Not yet ingested
- Civics
- —
Market trends
- HPI YoY
- ▼ -191.83%
- Current HPI
- 284.5645
- Rent YoY
- ▲ 4.43%
- Metro
- Baltimore-Columbia-Towson, MD
- State GDP YoY
- ▲ 2.97%
- F500 in state
- 12
Industry mix (Fortune 500 HQ in MD)
| Industry | F500 HQs | Revenue |
|---|---|---|
| Aerospace / Defense | 1 | $71B |
|
||
| Utilities | 1 | $25B |
|
||
| Hotels | 1 | $24B |
|
||
| Consumer Goods | 1 | $7B |
|
||
| Real Estate | 1 | $6B |
|
||
| Chemicals | 1 | $2B |
|
||
Price history
+29.0% since first listed9 events — show timeline
- 2026-06-05 Listed $149,000 BRIGHT MLS
- 2025-11-24 Listing Removed — BRIGHT MLS
- 2025-09-24 Listed $159,999 BRIGHT MLS
- 2005-09-14 Sold (Public Records) $115,500 Public Records
- 2005-09-14 Sold (Public Records) $115,500 Public Records
- 1999-04-22 Delisted — MRIS
- 1999-01-28 Listed — MRIS
- 1998-08-04 Delisted — MRIS
- 1998-03-17 Listed — MRIS
Property tax history
-0.9%/yrLatest (2025): $2,396 · +6.0% YoY. Source: county tax records.
Cash-flow waterfall
monthlySold comps — $/sqft
last 12 mo · ≤1 miLoading sold comps…