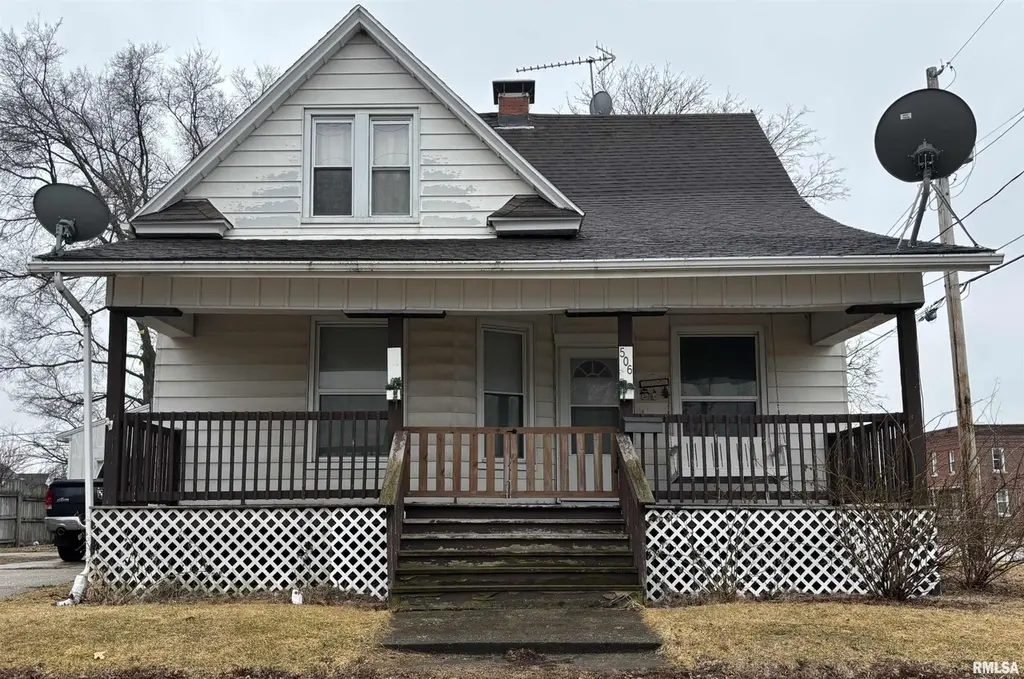
506 E Elm St · Canton, IL
Flood risk 1/10 · Minimal
- FEMA flood zone
- X (unshaded)
- Chance of flooding over 30 yrs
- 0.0%
- Est. flood insurance / yr
- $473 – $860
Fire risk 1/10 · Minimal
- Est. fire insurance / yr
- $804 – $1,492
Heat risk 3/10 · Minor
- Hot days now (above 105°F)
- 7 days/yr
- Hot days in 30 yrs
- 18 days/yr
Wind risk 2/10 · Minimal
- Chance of severe wind over 30 yrs
- 0.0%
Air-quality risk 2/10 · Minimal
- Unhealthy air days now
- 1 days/yr
- Unhealthy air days in 30 yrs
- 2 days/yr
Risk factors via First Street. Map © Google.
Why this score? — see what drove the C grade
The composite is a weighted blend of 9 inputs, each scored 0–100. Each bar is that input's sub-score; the figure is the points it added to the 100-point composite (weight × sub-score).
- Cash flow +26.9/30.0
- DSCR +9.3/10.0
- 1% rule +6.5/10.0
- ARV discount +4.6/15.0
- Livability +3.6/5.0
- Rent growth +2.5/5.0
- Condition / age +2.5/5.0
- Schools +1.8/10.0
- Appreciation +0.0/10.0
$104,500
🖨 Deal sheet (PDF) 📄 Offer letter ✓ Due diligence
Listing remarks MLS
This 3 BR, possible 4 BR, 2 full bath home is conveniently located on the corner of Elm and 5th and offers a fenced in back yard. It has a 20x16 detached garage. A covered porch with a swing. 1 bedroom on the main floor off the living room. 2 spacious bedrooms on the upper level. Partially finished basement offers a possible spacious 4th bedroom, basement also includes laundry room with washer and dryer and downstairs fridge, and a small room great for a den/office space. Dishwasher is included. AC unit recently fixed and in working condition. Upstairs toilet replaced in 2025. Newly remodeled bathroom. Kitchen has a walk-in pantry. Come and check this one out!!
Key facts
- 6,400 sq ft lot
- Garage
- Built 1902
Neighborhood map
What this means for you Summary
Snapshot
- This is a 3-bed/2.0-bath single-family listed at $104k.
Deal economics
- At list price, monthly cash flow is $290 ($3k/yr) — positive.
- The deal already cash-flows at list — no discount required.
- Meets the 1% rule at list price ($1k rent vs $104k).
- Recommended offer: $101k (3.0% below list) — sets the bar for market timing.
- Cap rate 9.6% vs local median 7.9% in Canton — meaningfully above typical; check what's discounted (condition, days-on-market, listing class) to confirm the premium yield is real.
Location & tenants
- Location reads 72/100 on livability (#318 in IL) — a middle-class / working-renter tenant base. Strengths: cost of living A+, housing A+, health & safety A+; Watch: crime C-, schools F, amenities F.
- Canton Union SD 66 (town): math 19% / reading 23% proficiency, ranked #417 of 620 in IL (top 67%) — low school quality limits family demand, transient renter base, plan for 1-2y turnover.
- Market conditions: 108 active listings in the ZIP; 1 comparable units currently listed for rent nearby; 14 units permitted in Fulton County in 2024 (0 in 5+ unit buildings).
Forward outlook
- Local home prices are declining (-3.0%/yr); year-one equity from $722 of loan paydown is wiped out by about $3k of value loss. Plan a longer hold.
- Fulton County population projected at -20% by 2050 — secular population decline; favor cash flow + early exit over multi-decade hold.
- At projected returns (-3.0% appreciation + 3.0% rent growth), your $29k cash investment doubles in ~10 years — after that, you're playing with house money.
Negotiation context
- It's been on market 41 days — a 3% lower offer ($101k) is reasonable based on typical stale-listing flexibility.
- 4 sale attempts since 13y ago with the ask held roughly flat each time — persistent listings suggest the price (not the market) is what's stuck; bring a comps-based counter.
- Current owner paid $86k; 22% above their basis — modest negotiation headroom, anchor on the comps not their cost.
Risks & watch-outs
- Watch-outs: built in 1902 — expect roof / HVAC / electrical / plumbing capex.
Questions for the listing agent
- It's been on market 41 days. Have you received any prior offers? Is the seller open to a 3% concession, seller financing, or rate buy-down credit?
- Built in 1902 — when were the roof, HVAC, electrical panel, plumbing, and water heater last replaced?
- Is there a deadline driving the sale (1031 exchange, divorce, estate, relocation)? That informs how much negotiation room exists.
- Schools are F-rated, which usually means shorter tenancies and higher turnover. Who's the typical renter profile here, and what's been the actual vacancy rate?
- What's the average days-on-market for RENTAL listings here right now (not sales)? A rising rental-DOM trend means longer vacancies and softer asking-rent achievability than the comps imply.
- What's the recent tenant-quality profile in this submarket — average credit score on applications, eviction rate, late-payment / NSF rate, and stable-employment percentage? A property-management company in the area should have these aggregated.
- How much new for-sale + rental construction is in the pipeline within 1–3 miles? Heavy new supply typically softens prices + rents 12–24 months out; constrained supply supports both.
Investment metrics
- 1% rule
- 1.15% ✓
- Cap rate
- 9.63%
- Cash-on-cash
- 11.90%
- DSCR
- 1.53
- GRM
- 7.3
CMA / ARV
- ARV (median comp)
- $98,197
- List price
- $104,500
- Delta
- 6.42%
- Verdict
- FAIR
- Comps
- 20 within 1.0 mi
Show comp detail 12 sales within ~0.75 mi
| Address | Dist | Beds/Ba | Sqft | Sold | Price | $/sf | Match |
|---|---|---|---|---|---|---|---|
| 17 N 5th Ave | 0.04mi | 3/2.0 | 980 (+9%) | 6mo | $18,000 | $18 | 79 |
| 62 N 5th Ave | 0.08mi | 2/1.0 (-1) | 798 (-11%) | 6mo | $67,000 | $84 | 63 |
| 335 Iris Ct | 0.59mi | 3/1.0 | 864 (-4%) | 3mo | $110,000 | $127 | 60 |
| 714 E Ash St | 0.38mi | 2/1.0 (-1) | 825 (-8%) | 0mo | $84,000 | $102 | 59 |
| 906 E Locust St | 0.33mi | 2/1.0 (-1) | 960 (+7%) | 7mo | $43,500 | $45 | 58 |
| 290 N 11th Ave | 0.50mi | 2/1.0 (-1) | 964 (+7%) | 0mo | $118,000 | $122 | 56 |
| 454 S 3rd Ave | 0.43mi | 3/1.0 | 1,024 (+14%) | 0mo | $9,000 | $9 | 53 |
| 944 E Walnut Ave | 0.37mi | 3/1.0 | 1,030 (+14%) | 2mo | $82,000 | $80 | 53 |
| 143 E Spruce St | 0.40mi | 2/1.0 (-1) | 998 (+11%) | 2mo | $49,900 | $50 | 53 |
| 476 Baxter Ct | 0.43mi | 2/1.0 (-1) | 792 (-12%) | 6mo | $45,000 | $57 | 46 |
| 660 N 9th Ave | 0.61mi | 2/1.0 (-1) | 800 (-11%) | 2mo | $83,000 | $104 | 43 |
| 649 Dean Ct | 0.56mi | 2/1.0 (-1) | 1,008 (+12%) | 4mo | $52,000 | $52 | 41 |
Match score weights: distance 35% · size 25% · config 20% · recency 20%. Top-matched comps best support the ARV.
Projected returns pro-forma
-3.0% appreciation · 3.0% rent growth · sell at horizon
- IRR
- 1.4%
- Equity multiple
- 1.05×
- Total profit
- $1,528
- Equity at exit
- $15,581
- IRR
- 11.0%
- Equity multiple
- 1.86×
- Total profit
- $25,042
- Equity at exit
- $9,035
Cash invested: $29,260 (down + closing). Projections, not guarantees.
Landlord ↔ Tenant lean methodology
- Overall (STATE)
- 43 Moderately Tenant-Leaning
- State Illinois
- 43 Moderately Tenant-Leaning · D+7
- County
- — inherits STATE
- City
- — inherits STATE
ZIP-level market 61520
- Active inventory
- 108
- Price-to-rent
- 7.3×
Monthly cashflow live
- Estimated rent
- $1,200 medium interval (Pro) →
- Mortgage (P&I)
- −$548
- Tax from tax record
- −$66 /mo · $795/yr
- Insurance
- −$44
- HOA
- −$0
- Vacancy / Maint / Mgmt
- −$252
- Net cashflow
- $290
Break-even live
Sensitivity live
| Price | -10% $349 | -5% $320 | +0% $290 | +5% $261 | +10% $231 |
|---|---|---|---|---|---|
| Rent | -10% $195 | -5% $243 | +0% $290 | +5% $338 | +10% $385 |
| Rate | -1.0pp $343 | -0.5pp $317 | base $290 | +0.5pp $263 | +1.0pp $236 |
UW: 25.0% down · 7.5% · 30yr · 1.5% tax · 5.0% vac · 8.0% maint · 8.0% mgmt
Financing live
Cash to close
- Down payment
- $26,125
- Closing costs
- $3,135
- Reserves months
- —
- Total cash needed
- —
Loan-product check · same deal, 3 products live
Conventional
25% down · 7.5% · 30yr
- Down + closing
- —
- Monthly P&I
- —
- Monthly cashflow
- —
- DSCR
- —
- Eligible?
- —
Personal DTI + credit; lowest rate.
DSCR
20% down · 8.5% · 30yr
- Down + closing
- —
- Monthly P&I
- —
- Monthly cashflow
- —
- DSCR
- —
- Eligible?
- —
No personal income docs; deal must DSCR.
Hard money
10% down · 12.0% · 12mo
- Down + closing
- —
- Monthly P&I
- —
- Monthly cashflow
- —
- DSCR
- —
- Eligible?
- —
Short-term bridge; refi at stabilization.
Rent comps 1 comps
| Address | Beds | Baths | Sqft | Rent | $/sqft | DOM | Units | Dist |
|---|---|---|---|---|---|---|---|---|
| 437 N 8th Ave Canton, IL | 2.0 | 1.0 | 690 | $1,200 | $1.74 | 14d | 1 | 0.41mi |
Listing history 11 events
-
2026-05-02status Pending 669-char remark
Show marketing remark (669 chars)
This 3 BR, possible 4 BR, 2 full bath home is conveniently located on the corner of Elm and 5th and offers a fenced in back yard. It has a 20x16 detached garage. A covered porch with a swing. 1 bedroom on the main floor off the living room. 2 spacious bedrooms on the upper level. Partially finished basement offers a possible spacious 4th bedroom, basement also includes laundry room with washer and dryer and downstairs fridge, and a small room great for a den/office space. Dishwasher is included. AC unit recently fixed and in working condition. Upstairs toilet replaced in 2025. Newly remodeled bathroom. Kitchen has a walk-in pantry. Come and check this one out!!
-
2026-03-22$104,500 Active 669-char remark
Show marketing remark (669 chars)
This 3 BR, possible 4 BR, 2 full bath home is conveniently located on the corner of Elm and 5th and offers a fenced in back yard. It has a 20x16 detached garage. A covered porch with a swing. 1 bedroom on the main floor off the living room. 2 spacious bedrooms on the upper level. Partially finished basement offers a possible spacious 4th bedroom, basement also includes laundry room with washer and dryer and downstairs fridge, and a small room great for a den/office space. Dishwasher is included. AC unit recently fixed and in working condition. Upstairs toilet replaced in 2025. Newly remodeled bathroom. Kitchen has a walk-in pantry. Come and check this one out!!
-
2026-03-05historical $104,500 669-char remark
Show marketing remark (669 chars)
This 3 BR, possible 4 BR, 2 full bath home is conveniently located on the corner of Elm and 5th and offers a fenced in back yard. It has a 20x16 detached garage. A covered porch with a swing. 1 bedroom on the main floor off the living room. 2 spacious bedrooms on the upper level. Partially finished basement offers a possible spacious 4th bedroom, basement also includes laundry room with washer and dryer and downstairs fridge, and a small room great for a den/office space. Dishwasher is included. AC unit recently fixed and in working condition. Upstairs toilet replaced in 2025. Newly remodeled bathroom. Kitchen has a walk-in pantry. Come and check this one out!!
-
2022-02-18soldstatus $86,000 218-char remark
Show marketing remark (218 chars)
Conveniently Located 3+ Bedroom Home! This Home is Roomy with an Awesome Open Staircase. Walk In Pantry! Newly Remodeled Bath! Partially Finished Basement! Detached Garage! Fenced in Yard! Come and Check this one out!
-
2021-12-04$89,900 218-char remark
Show marketing remark (218 chars)
Conveniently Located 3+ Bedroom Home! This Home is Roomy with an Awesome Open Staircase. Walk In Pantry! Newly Remodeled Bath! Partially Finished Basement! Detached Garage! Fenced in Yard! Come and Check this one out!
-
2021-08-06historical
-
2018-12-21soldstatus $53,000
-
2018-12-21soldstatus $53,100
-
2018-11-27$55,900
-
2013-02-20soldstatus $35,000
-
2013-01-25$33,900
ⓘ Source: listings_history table (triggers on properties + properties_extension) + one-shot
backfill from property_details.listing_events for pre-trigger history.
Tax reassessment forecast IL · Partial reset (capped growth)
- Current annual tax
- $795 · $66/mo
- Projected year-2 tax
- $1,584 · $132/mo
- Expected delta
- +$789/yr (+$66/mo · 99.2%)
ⓘ Screening estimate from a state-policy table — verify with the county assessor before closing.
Climate risk First Street
- Flood 1/10 Low FEMA zone X (unshaded) · 0% chance over 30 yrs
- Wildfire 1/10 Low
- Heat 3/10 Moderate 7 d/yr ≥105°F today · 18 d/yr by 30 yrs out
- Wind 2/10 Low 0% chance of damaging wind over 30 yrs
- Air quality 2/10 Low 1 unhealthy d/yr today · 2 by 30 yrs out
Nearby sold comps map
Loading sold comps map…
Walkable amenities ~0.75 mi
Loading nearby amenities…
Taxation est. · year 1
- Rental income
- $14,400
- − Mortgage interest
- −$5,854
- − Property taxes
- −$795
- − Insurance
- −$522
- − Repairs & maintenance
- −$1,152
- − Management
- −$1,152
- − Depreciation
- −$3,040
- Taxable income
- $1,885
- Est. tax owed @ 24.0%
- −$452
- After-tax cash flow
- $3,030/yr
For passive investors: Depreciation is non-cash, so a rental often shows a tax loss while cash-flowing — sheltering income. Rental losses are passive: they offset passive income freely, and up to $25,000/yr can offset ordinary (W-2) income if you actively participate and your MAGI is under $100k (phasing out to $0 by $150k); unused losses carry forward. On sale, claimed depreciation is recaptured at up to 25%, and gains may owe capital-gains tax (a 1031 exchange can defer both). Figures are a year-1 estimate at your 24.0% rate — not tax advice; consult a CPA.
Schools (NCES district)
- District
- Canton Union SD 66
- NCES district ID
- 1708280
- Math proficiency
- 19% ▼ -10.00%
- Reading proficiency
- 23% ▼ -12.00%
- Median HH income
- $42,657
- Composite
- 18.03/100
- National rank
- #8980
- State rank
- #417 of 620 in IL
Livability — Canton
- Score
- 72/100
- State rank
- #318
- US rank
- #6313
Category grades
Schools grade is shown separately in the Schools card above.
Census & demographics
- Census place
- Canton, IL
- Population (ZIP)
- 16,098
Population outlook (Fulton County) Hauer SSP2
- Today (2025)
- 33,356 people
- By 2030
- 32,144 · -3.6%
- By 2040
- 29,518 · -11.5%
- By 2050
- 26,775 · -19.7%
- By 2075
- 19,972 · -40.1%
- By 2100
- 13,580 · -59.3%
Race, ethnicity, and origin ACS 2023
- Neighborhood character
- Predominantly White (88%)
- Race & ethnicity
- White 88% Black 5% Hispanic / Latino 4% Two or more races 4% Native American 1%
- Common ancestry
- Slovak 3% Lithuanian 1% Romanian 1%
- Foreign-born
- 2% · Canada
- Languages at home
- 96% English-only · Spanish 3%
Political lean MEDSL · Fulton
- 2024 margin
- Strong R (+23.8) · D 37.1% · R 60.9% · Other 2.0%
- 2008→2024 swing
- -45.2pp toward R · 2008: 21.3pp · 2024: -23.8pp
- All cycles
- 2024: R+23.8 2020: R+20.1 2016: R+15.1 2012: D+11.1 2008: D+21.3
Not yet ingested
- Civics
- —
Market trends
- HPI YoY
- ▼ -88.00%
- Current HPI
- 123.8086
- Rent YoY
- —
- Metro
- —
- State GDP YoY
- ▲ 1.59%
- F500 in state
- 60
Industry mix (Fortune 500 HQ in IL)
| Industry | F500 HQs | Revenue |
|---|---|---|
| Insurance | 4 | $201B |
|
||
| Consumer Goods | 4 | $87B |
|
||
| Industrial Machinery | 3 | $64B |
|
||
| Healthcare | 2 | $55B |
|
||
| Retail / Pharmacy | 1 | $148B |
|
||
| Agriculture / Food | 1 | $86B |
|
||
Price history
+208.3% since first listed11 events — show timeline
- 2026-05-02 Pending — RMLSA as Distributed by MLS Grid
- 2026-03-22 Listed $104,500 RMLSA as Distributed by MLS Grid
- 2026-03-05 Coming Soon $104,500 RMLSA as Distributed by MLS Grid
- 2022-02-18 Sold (MLS) $86,000 RMLSA as Distributed by MLS Grid
- 2021-12-04 Listed $89,900 RMLSA as Distributed by MLS Grid
- 2021-08-06 Listing Removed — RMLSA as Distributed by MLS Grid
- 2018-12-21 Sold (Public Records) $53,100 Public Records
- 2018-12-21 Sold (MLS) $53,000 RMLSA as Distributed by MLS Grid
- 2018-11-27 Listed $55,900 RMLSA as Distributed by MLS Grid
- 2013-02-20 Sold (MLS) $35,000 RMLSA as Distributed by MLS Grid
- 2013-01-25 Listed $33,900 RMLSA as Distributed by MLS Grid
Property tax history
-1.9%/yrLatest (2024): $795 · +2.1% YoY. Source: county tax records.
Cash-flow waterfall
monthlySold comps — $/sqft
last 12 mo · ≤1 miLoading sold comps…