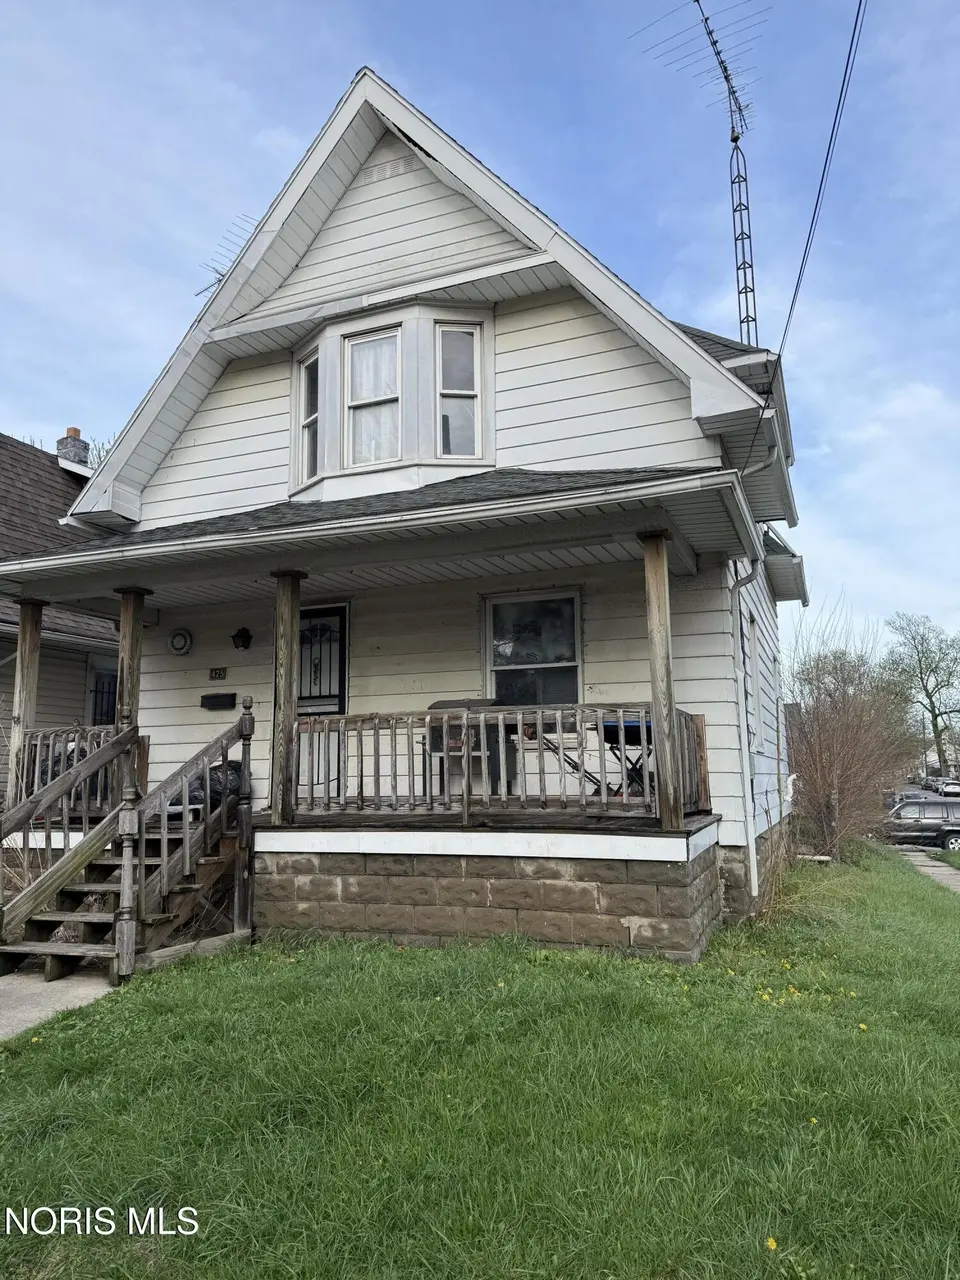
425 Spencer St · Toledo, OH
Flood risk 3/10 · Minor
- FEMA flood zone
- X (unshaded)
- Chance of flooding over 30 yrs
- 0.2%
- Est. flood insurance / yr
- $473 – $860
Fire risk 1/10 · Minimal
- Est. fire insurance / yr
- $713 – $1,323
Heat risk 3/10 · Minor
- Hot days now (above 101°F)
- 7 days/yr
- Hot days in 30 yrs
- 16 days/yr
Wind risk 2/10 · Minimal
- Chance of severe wind over 30 yrs
- —
Air-quality risk 2/10 · Minimal
- Unhealthy air days now
- 1 days/yr
- Unhealthy air days in 30 yrs
- 2 days/yr
Risk factors via First Street. Map © Google.
Why this score? — see what drove the C+ grade
The composite is a weighted blend of 9 inputs, each scored 0–100. Each bar is that input's sub-score; the figure is the points it added to the 100-point composite (weight × sub-score).
- Cash flow +24.4/30.0
- DSCR +7.9/10.0
- ARV discount +7.5/15.0
- 1% rule +5.9/10.0
- Appreciation +5.4/10.0
- Rent growth +4.5/5.0
- Livability +3.3/5.0
- Condition / age +2.5/5.0
- Schools +1.6/10.0
$99,900
🖨 Deal sheet 📄 Offer letter ✓ Due diligence
Listing remarks MLS
Come on Investors! Here's your chance to own a three bedroom two-story house already rented. Corner lot no windows and updated bathroom. Just minutes from downtown
Key facts
- Corner lot
- Updated bathroom
- 3,600 sq ft lot
Tags
Neighborhood map
What this means for you Summary
Snapshot
- This is a 3-bed/1.0-bath single-family listed at $100k.
Deal economics
- At list price, monthly cash flow is $202 ($2k/yr) — positive.
- The deal already cash-flows at list — no discount required.
- Meets the 1% rule at list price ($1k rent vs $100k).
- Recommended offer: $94k (6.0% below list) — sets the bar for market timing.
Location & tenants
- Location reads 66/100 on livability (#645 in OH) — a middle-class / working-renter tenant base. Strengths: cost of living A+, housing A+, health & safety A+; Watch: amenities C-, schools D-, crime F.
- Toledo City (urban): math 15% / reading 24% proficiency, ranked #634 of 656 in OH (top 97%) — low school quality limits family demand, transient renter base, plan for 1-2y turnover; 72% free/reduced lunch — lower-income household profile, screen leases tightly.
- Market conditions: Rents rising fast (+7.8%/yr); 99 active listings in the ZIP; 19 comparable units currently listed for rent nearby; rentals lingering (median 44d on market — plan ~5-8 weeks vacancy on turnover, expect pricing pressure); 53% of comp listings sitting > 30 days — soft ceiling on asking rent; lower-income renter base — watch delinquency; 415 units permitted in Lucas County in 2024 (122 in 5+ unit buildings).
- This rent runs 31% of the median local income ($42k/yr) — at the standard rent-burdened threshold; future hikes will face affordability resistance.
Forward outlook
- In year one you build about $1k of equity ($691 loan paydown + $749 appreciation (0.8% local appreciation)).
- Lucas County population projected at -16% by 2050 — secular population decline; favor cash flow + early exit over multi-decade hold.
- At projected returns (0.8% appreciation + 7.8% rent growth), your $28k cash investment doubles in ~5 years — after that, you're playing with house money.
Negotiation context
- It's been on market 65 days — a 6% lower offer ($94k) is reasonable based on typical stale-listing flexibility.
- 4 sale attempts since 3y ago with the ask held roughly flat each time — persistent listings suggest the price (not the market) is what's stuck; bring a comps-based counter.
- Current owner paid $50k; list at $100k implies a 100% gain — meaningful room to come down on a strong offer.
Risks & watch-outs
- Watch-outs: built in 1902 — expect roof / HVAC / electrical / plumbing capex.
Questions for the listing agent
- It's been on market 65 days. Have you received any prior offers? Is the seller open to a 6% concession, seller financing, or rate buy-down credit?
- Built in 1902 — when were the roof, HVAC, electrical panel, plumbing, and water heater last replaced?
- Why hasn't it sold? Are there any deal-killer items the seller is aware of (foundation, flood, title, zoning, code violations)?
- Is there a deadline driving the sale (1031 exchange, divorce, estate, relocation)? That informs how much negotiation room exists.
- Schools are D-rated, which usually means shorter tenancies and higher turnover. Who's the typical renter profile here, and what's been the actual vacancy rate?
- Crime grade is F in this area — have there been break-ins, vandalism, or insurance claims at this property in the last 3 years? What carrier currently insures it and at what premium?
- What's the average days-on-market for RENTAL listings here right now (not sales)? A rising rental-DOM trend means longer vacancies and softer asking-rent achievability than the comps imply.
- What's the recent tenant-quality profile in this submarket — average credit score on applications, eviction rate, late-payment / NSF rate, and stable-employment percentage? A property-management company in the area should have these aggregated.
- How much new for-sale + rental construction is in the pipeline within 1–3 miles? Heavy new supply typically softens prices + rents 12–24 months out; constrained supply supports both.
Investment metrics
- 1% rule
- 1.09% ✓
- Cap rate
- 8.72%
- Cash-on-cash
- 8.67%
- DSCR
- 1.39
- GRM
- 7.7
CMA / ARV
- ARV (median comp)
- $53,335
- List price
- $99,900
- Delta
- 87.31%
- Verdict
- OVERPRICED
- Comps
- 20 within 1.0 mi
Show comp detail 12 sales within ~0.75 mi
| Address | Dist | Beds/Ba | Sqft | Sold | Price | $/sf | Match |
|---|---|---|---|---|---|---|---|
| 317 Eldred Ave | 0.37mi | 3/1.5 | 1,108 (-2%) | 1mo | $45,000 | $41 | 76 |
| 1402 Prouty Ave | 0.20mi | 3/1.0 | 1,030 (-9%) | 1mo | $50,000 | $49 | 75 |
| 1152 Colton St | 0.25mi | 3/1.0 | 1,046 (-8%) | 1mo | $65,000 | $62 | 75 |
| 624 Carlton St | 0.33mi | 3/2.0 | 1,013 (-10%) | 2mo | $134,888 | $133 | 61 |
| 819 Lodge Ave | 0.55mi | 3/2.0 | 1,190 (+5%) | 1mo | $65,000 | $55 | 61 |
| 855 Brighton Ave | 0.64mi | 3/1.0 | 1,070 (-6%) | 2mo | $97,500 | $91 | 60 |
| 219 Storrs | 0.67mi | 3/1.0 | 1,056 (-7%) | 2mo | $81,800 | $77 | 56 |
| 752 Hampton Ave | 0.61mi | 2/1.5 (-1) | 1,182 (+4%) | 2mo | $85,900 | $73 | 56 |
| 819 Geneva Ave | 0.71mi | 3/1.0 | 1,212 (+7%) | 1mo | $105,000 | $87 | 54 |
| 829 Ogden Ave | 0.68mi | 3/1.0 | 1,220 (+8%) | 2mo | $100,000 | $82 | 54 |
| 119 Whiting Ave | 0.69mi | 3/1.0 | 1,224 (+8%) | 2mo | $45,000 | $37 | 52 |
| 1836 Finch St | 0.72mi | 3/2.0 | 1,188 (+5%) | 3mo | $85,950 | $72 | 52 |
Match score weights: distance 35% · size 25% · config 20% · recency 20%. Top-matched comps best support the ARV.
Projected returns pro-forma
0.75% appreciation · 7.8% rent growth · sell at horizon
- IRR
- 13.1%
- Equity multiple
- 1.68×
- Total profit
- $19,010
- Equity at exit
- $32,808
- IRR
- 19.9%
- Equity multiple
- 3.69×
- Total profit
- $75,286
- Equity at exit
- $42,613
Cash invested: $27,972 (down + closing). Projections, not guarantees.
Landlord ↔ Tenant lean methodology
- Overall (STATE)
- 73 Landlord-Friendly
- State Ohio
- 73 Landlord-Friendly · R+6
- County
- — inherits STATE
- City
- — inherits STATE
ZIP-level market 43609
- Home prices YoY
- 0.3%
- Rents YoY
- 7.8%
- Active inventory
- 99
- Price-to-rent
- 7.7×
Monthly cashflow live
- Estimated rent
- $1,085 high interval (Pro) →
- Mortgage (P&I)
- −$524
- Tax from tax record
- −$90 /mo · $1,078/yr
- Insurance
- −$42
- HOA
- −$0
- Vacancy / Maint / Mgmt
- −$228
- Net cashflow
- $202
Break-even live
UW: 25.0% down · 7.5% · 30yr · 1.5% tax · 5.0% vac · 8.0% maint · 8.0% mgmt
Financing live
Cash to close
- Down payment
- $24,975
- Closing costs
- $2,997
- Reserves months
- —
- Total cash needed
- —
Loan-product check · same deal, 3 products live
Conventional
25% down · 7.5% · 30yr
- Down + closing
- —
- Monthly P&I
- —
- Monthly cashflow
- —
- DSCR
- —
- Eligible?
- —
Personal DTI + credit; lowest rate.
DSCR
20% down · 8.5% · 30yr
- Down + closing
- —
- Monthly P&I
- —
- Monthly cashflow
- —
- DSCR
- —
- Eligible?
- —
No personal income docs; deal must DSCR.
Hard money
10% down · 12.0% · 12mo
- Down + closing
- —
- Monthly P&I
- —
- Monthly cashflow
- —
- DSCR
- —
- Eligible?
- —
Short-term bridge; refi at stabilization.
Rent comps 19 comps
| Address | Beds | Baths | Sqft | Rent | $/sqft | DOM | Units | Dist |
|---|---|---|---|---|---|---|---|---|
| 1321 Gordon St Toledo, OH | 3.0 | 1.0 | 1121 | $1,050 | $0.94 | 43d | 1 | 0.12mi |
| 1418 Colburn St Toledo, OH | 3.0 | 1.0 | 992 | $1,200 | $1.21 | 13d | 1 | 0.15mi |
| 532 Carlton St Toledo, OH | 3.0 | 1.0 | 1130 | $1,050 | $0.93 | 43d | 1 | 0.27mi |
| 523 Nicholas St Toledo, OH | 3.0 | 1.0 | 1290 | $1,350 | $1.05 | 13d | 1 | 0.29mi |
| 724 Spencer St Toledo, OH | 3.0 | 1.5 | 1127 | $1,100 | $0.98 | 43d | 1 | 0.40mi |
| 705 Nicholas St Toledo, OH | 2.0 | 1.0 | 1037 | $900 | $0.87 | 43d | 1 | 0.42mi |
| 2424 Broadway St Toledo, OH | 3.0 | 1.0 | 1416 | $1,049 | $0.74 | 13d | 1 | 0.63mi |
| 837 Colburn St Unit 1 Toledo, OH | 2.0 | 1.0 | 1178 | $700 | $0.59 | 43d | 1 | 0.75mi |
| 837 Colburn St Unit 2 Toledo, OH | 2.0 | 1.0 | 1158 | $695 | $0.60 | 23d | 1 | 0.75mi |
| 827 Colburn St Toledo, OH | 2.0 | 1.0 | 1092 | $750 | $0.69 | 43d | 1 | 0.77mi |
| 1734 Arlington Ave Toledo, OH | 2.0 | 1.0 | 700 | $800 | $1.14 | 13d | 1 | 0.82mi |
| 771 Orchard St Unit 7715 Toledo, OH | 2.0 | 1.0 | 1086 | $645 | $0.59 | 23d | 1 | 0.85mi |
| 2594 Broadway St Toledo, OH | 2.0 | 1.0 | 1076 | $825 | $0.77 | 43d | 1 | 0.85mi |
| 319 N Detroit Ave Toledo, OH | 3.0 | 1.0 | 1341 | $845 | $0.63 | 43d | 1 | 0.95mi |
| 1785 Tecumseh St Toledo, OH | 2.0 | 1.0 | 930 | $900 | $0.97 | 43d | 1 | 1.07mi |
| 2044 Arlington Ave Toledo, OH | 2.0 | 1.0 | 800 | $825 | $1.03 | 21d | 1 | 1.16mi |
| 307 Danberry St Toledo, OH | 2.0 | 1.0 | 988 | $950 | $0.96 | 43d | 1 | 1.18mi |
| 2314 Airline Ave Toledo, OH | 3.0 | 1.0 | 1123 | $1,478 | $1.32 | 23d | 1 | 1.33mi |
| 244 Knower St Toledo, OH | 3.0 | 1.0 | 1120 | $995 | $0.89 | 13d | 1 | 1.44mi |
Listing history 28 events
-
2026-06-18days on market $99,900 Active 65 DOM
-
2026-06-17days on market $99,900 Active 64 DOM
-
2026-06-16days on market $99,900 Active 63 DOM
-
2026-06-15days on market $99,900 Active 62 DOM
-
2026-06-14days on market $99,900 Active 60 DOM
-
2026-06-10days on market $99,900 Active 57 DOM
-
2026-06-09days on market $99,900 Active 56 DOM
-
2026-06-08days on market $99,900 Active 55 DOM
-
2026-06-07days on market $99,900 Active 54 DOM
-
2026-06-05days on market $99,900 Active 51 DOM
-
2026-06-03days on market $99,900 Active 50 DOM
-
2026-06-02days on market $99,900 Active 49 DOM
-
2026-06-01days on market $99,900 Active 48 DOM
-
2026-05-31days on market $99,900 Active 47 DOM
-
2026-05-30days on market $99,900 Active 46 DOM
-
2026-04-14$99,900 Active 163-char remark
Show marketing remark (163 chars)
Come on Investors! Here's your chance to own a three bedroom two-story house already rented. Corner lot no windows and updated bathroom. Just minutes from downtown
-
2025-10-27historical $1,050
-
2025-10-14price $50,000 313-char remark
Show marketing remark (313 chars)
Calling all investors. This is your chance to add this money maker to your portfolio. This spacious 3 bed, 1 bath home in south Toledo boasts fresh paint and stain throughout, newer windows, and updated bathroom! The possibilities are endless. Come see for yourself! Home sold AS-IS. Schedule through ShowingTime.
-
2025-08-22price $1,050
-
2025-07-30$1,200
-
2025-02-13historical $1,200
-
2024-12-12$1,200
-
2024-01-04soldstatus $50,000
-
2024-01-02status Pending 313-char remark
Show marketing remark (313 chars)
Calling all investors. This is your chance to add this money maker to your portfolio. This spacious 3 bed, 1 bath home in south Toledo boasts fresh paint and stain throughout, newer windows, and updated bathroom! The possibilities are endless. Come see for yourself! Home sold AS-IS. Schedule through ShowingTime.
-
2024-01-02soldstatus $50,000 Closed 313-char remark
Show marketing remark (313 chars)
Calling all investors. This is your chance to add this money maker to your portfolio. This spacious 3 bed, 1 bath home in south Toledo boasts fresh paint and stain throughout, newer windows, and updated bathroom! The possibilities are endless. Come see for yourself! Home sold AS-IS. Schedule through ShowingTime.
-
2023-12-21historical Contingent 313-char remark
Show marketing remark (313 chars)
Calling all investors. This is your chance to add this money maker to your portfolio. This spacious 3 bed, 1 bath home in south Toledo boasts fresh paint and stain throughout, newer windows, and updated bathroom! The possibilities are endless. Come see for yourself! Home sold AS-IS. Schedule through ShowingTime.
-
2023-12-20$55,000 Active 313-char remark
Show marketing remark (313 chars)
Calling all investors. This is your chance to add this money maker to your portfolio. This spacious 3 bed, 1 bath home in south Toledo boasts fresh paint and stain throughout, newer windows, and updated bathroom! The possibilities are endless. Come see for yourself! Home sold AS-IS. Schedule through ShowingTime.
-
1985-08-07soldstatus $24,000
ⓘ Source: listings_history table (triggers on properties + properties_extension) + one-shot
backfill from property_details.listing_events for pre-trigger history.
Tax reassessment forecast OH · Partial reset (capped growth)
- Current annual tax
- $1,078 · $90/mo
- Projected year-2 tax
- $1,318 · $110/mo
- Expected delta
- +$240/yr (+$20/mo · 22.3%)
ⓘ Screening estimate from a state-policy table — verify with the county assessor before closing.
Climate risk First Street
- Flood 3/10 Moderate FEMA zone X (unshaded) · 20% chance over 30 yrs
- Wildfire 1/10 Low
- Heat 3/10 Moderate 7 d/yr ≥101°F today · 16 d/yr by 30 yrs out
- Wind 2/10 Low
- Air quality 2/10 Low 1 unhealthy d/yr today · 2 by 30 yrs out
Nearby sold comps map
Loading sold comps map…
Walkable amenities ~0.75 mi
Loading nearby amenities…
Taxation est. · year 1
- Rental income
- $13,024
- − Mortgage interest
- −$5,596
- − Property taxes
- −$1,078
- − Insurance
- −$500
- − Repairs & maintenance
- −$1,042
- − Management
- −$1,042
- − Depreciation
- −$2,906
- Taxable income
- $861
- Est. tax owed @ 24.0%
- −$207
- After-tax cash flow
- $2,218/yr
For passive investors: Depreciation is non-cash, so a rental often shows a tax loss while cash-flowing — sheltering income. Rental losses are passive: they offset passive income freely, and up to $25,000/yr can offset ordinary (W-2) income if you actively participate and your MAGI is under $100k (phasing out to $0 by $150k); unused losses carry forward. On sale, claimed depreciation is recaptured at up to 25%, and gains may owe capital-gains tax (a 1031 exchange can defer both). Figures are a year-1 estimate at your 24.0% rate — not tax advice; consult a CPA.
Schools (NCES district)
- District
- Toledo City
- NCES district ID
- 3904490
- Math proficiency
- 15% ▼ -16.00%
- Reading proficiency
- 24% ▼ -13.00%
- Median HH income
- $32,137
- Composite
- 15.76/100
- National rank
- #9276
- State rank
- #634 of 656 in OH
Livability — Toledo
- Score
- 66/100
- State rank
- #645
- US rank
- #11442
Category grades
Schools grade is shown separately in the Schools card above.
Census & demographics
- Census place
- Toledo, OH
- County
- Lucas County · 380,724 people
- City population
- 280,811
- Metro
- Toledo, OH
- Population (ZIP)
- 21,404
- Household income
- $42,313
- Rent vs Own
- Severe rent burden
- 1603.0
Population outlook (Lucas County) Hauer SSP2
- Today (2025)
- 420,751 people
- By 2030
- 410,187 · -2.5%
- By 2040
- 384,019 · -8.7%
- By 2050
- 355,125 · -15.6%
- By 2075
- 291,683 · -30.7%
- By 2100
- 233,670 · -44.5%
Race, ethnicity, and origin ACS 2023
- Neighborhood character
- Diverse neighborhood (Simpson 0.66)
- Race & ethnicity
- White 47% Black 29% Hispanic / Latino 17% Two or more races 9%
- Hispanic origin (detail)
- Mexican 15%
- Common ancestry
- Romanian 5% Lithuanian 2% Italian 1%
- Foreign-born
- 4% · Canada, China
- Languages at home
- 92% English-only · Spanish 5% Arabic 1% French/Haitian/Cajun 1%
Political lean MEDSL · Lucas
- 2024 margin
- D (+12.6) · D 55.8% · R 43.2%
- 2008→2024 swing
- -18.9pp toward R · 2008: 31.4pp · 2024: 12.6pp
- All cycles
- 2024: D+12.6 2020: D+16.8 2016: D+17.4 2012: D+30.4 2008: D+31.4
Not yet ingested
- Civics
- —
Market trends
- HPI YoY
- ▲ 0.75%
- Current HPI
- 235.2515
- Rent YoY
- ▲ 7.80%
- Metro
- Toledo, OH
- State GDP YoY
- ▲ 1.98%
- F500 in state
- 48
Industry mix (Fortune 500 HQ in OH)
| Industry | F500 HQs | Revenue |
|---|---|---|
| Insurance | 3 | $145B |
|
||
| Industrial Machinery | 3 | $49B |
|
||
| Financial Services | 3 | $24B |
|
||
| Consumer Goods | 2 | $93B |
|
||
| Aerospace / Defense | 2 | $47B |
|
||
| Utilities | 2 | $33B |
|
||
Price history
+316.2% since first listed13 events — show timeline
- 2026-04-14 Listed $99,900 NORIS
- 2025-10-27 Rental Removed $1,050 APPFOLIO
- 2025-10-14 Price Changed $50,000 NORIS
- 2025-08-22 Price Changed $1,050 APPFOLIO
- 2025-07-30 Listed for Rent $1,200 APPFOLIO
- 2025-02-13 Rental Removed $1,200 APPFOLIO
- 2024-12-12 Listed for Rent $1,200 APPFOLIO
- 2024-01-04 Sold (Public Records) $50,000 Public Records
- 2024-01-02 Pending — NORIS
- 2024-01-02 Sold (MLS) $50,000 NORIS
- 2023-12-21 Contingent — NORIS
- 2023-12-20 Listed $55,000 NORIS
- 1985-08-07 Sold (Public Records) $24,000 Public Records
Property tax history
+4.5%/yrLatest (2025): $1,078 · +14.0% YoY. Source: county tax records.
Cash-flow waterfall
monthlySold comps — $/sqft
last 12 mo · ≤1 miLoading sold comps…