 Fourplex
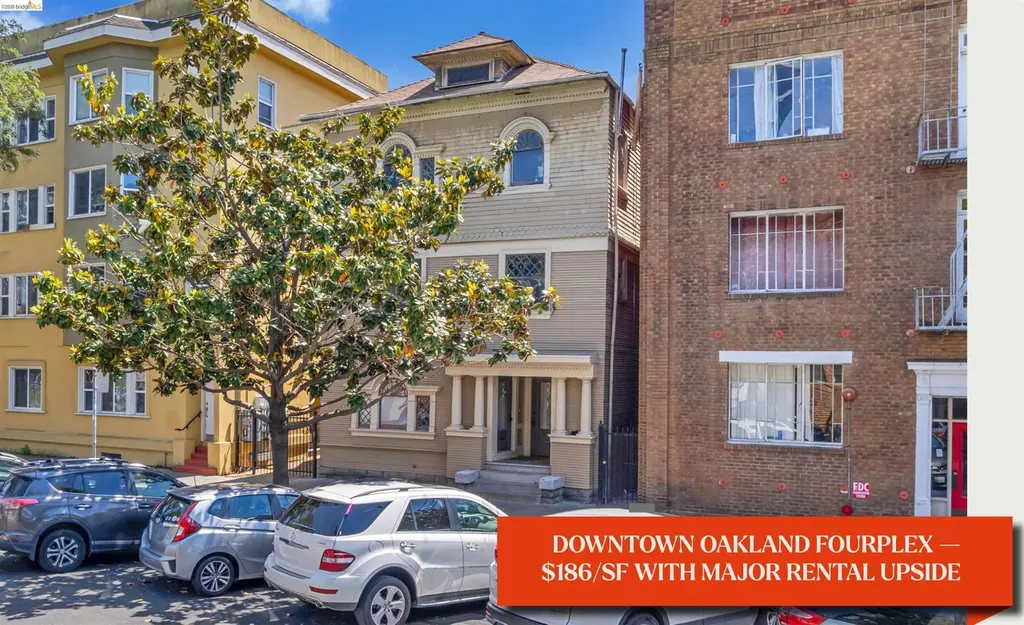
667 10th St · Oakland, CA
Flood risk 1/10 · Minimal
- FEMA flood zone
- X (unshaded)
- Chance of flooding over 30 yrs
- 0.0%
- Est. flood insurance / yr
- $507 – $1,088
Fire risk 1/10 · Minimal
- Est. fire insurance / yr
- $659 – $1,223
Heat risk 3/10 · Minor
- Hot days now (above 82°F)
- 7 days/yr
- Hot days in 30 yrs
- 15 days/yr
Wind risk 1/10 · Minimal
- Chance of severe wind over 30 yrs
- —
Air-quality risk 9/10 · Severe
- Unhealthy air days now
- 16 days/yr
- Unhealthy air days in 30 yrs
- 16 days/yr
Risk factors via First Street. Map © Google.
Why this score? — see what drove the B- grade
The composite is a weighted blend of 9 inputs, each scored 0–100. Each bar is that input's sub-score; the figure is the points it added to the 100-point composite (weight × sub-score).
- Cash flow +30.0/30.0
- 1% rule +10.0/10.0
- DSCR +10.0/10.0
- ARV discount +7.5/15.0
- Livability +3.6/5.0
- Rent growth +3.3/5.0
- Schools +3.0/10.0
- Condition / age +2.5/5.0
- Appreciation +0.0/10.0
$895,000
🖨 Deal sheet 📄 Offer letter ✓ Due diligence
Multi-family units
County records classify this as Multi-Family (2-4 Unit). Listing-text estimate: 4 units. confirmed
Listing remarks
A 1909 Victorian fourplex in the heart of downtown Oakland, priced at $186/SF in one of the city's most central addresses. The building carries its original character — bay windows, built-in cabinetry, hardwood floors — and the new 2025 roof takes the largest near-term capital item off the table. Gross annual rents of $96,756 grow to $125,484 at market as the vacant 2BR leases at $2,700 and the long-tenured 3BR turns toward $3,200, lifting net operating income from $58,000 to $82,000. Four electric meters and three gas meters keep operations clean, with the owner paying only garbage. The studio and adjacent 2BR can be combined into a larger unit, and the property's downtown mixe
Key facts
- Victorian fourplex
- Built-in cabinetry
- Bay windows
Tags
Property features AI
Finance
- Other: Zoned D-DT-RX
- Financial info: Four-unit property (quadruplex)
Exterior
- Parking: On-street parking
- Utilities: Public water; Public sewer; Individual electric meter; Separate water meters
- Home design: Residential income property (quadruplex); Built in 1909
- Construction: Frame construction with wood siding
- Exterior features: Patio; Front porch; Partial fencing; Level, paved lot
Interior
- Kitchen: Gas water heater
- Flooring: Vinyl flooring; Carpet
- Bathrooms: Each of the four units has 1 bathroom
- Heating & cooling: Electric heating; Floor furnace; No air conditioning
- Interior features: Tub with shower over; Back yard
- Laundry & utility: Washer and dryer on site; Individual electric meter for units; Separate water meters
Neighborhood map
What this means for you Summary
Snapshot
- This is a 4 × 7-bed/4.0-bath units multifamily listed at $895k.
Deal economics
- At list price, monthly cash flow is $6k ($71k/yr) — positive. Per door: $1k/mo.
- The deal already cash-flows at list — no discount required.
- Meets the 1% rule at list price ($14k rent vs $895k).
- Recommended offer: $882k (1.5% below list) — sets the bar for market timing.
- Cap rate 14.3% vs local median 2.4% in Oakland — top-decile yield for the area; either an underpriced asset or a hidden risk that comps aren't pricing in. Stress-test before assuming the spread holds.
Location & tenants
- Location reads 71/100 on livability (#224 in CA) — a middle-class / working-renter tenant base. Strengths: amenities A+, commute A+, employment A+; Watch: schools C-, crime F, cost of living F.
- Oakland Unified (urban): math 27% / reading 33% proficiency, ranked #1,007 of 1,400 in CA (top 72%) — families likely to look elsewhere, expect single-tenant / working-renter base with shorter leases; 68% free/reduced lunch — lower-income household profile, screen leases tightly.
- Market conditions: Rents rising (+3.2%/yr); 133 active listings in the ZIP; solid renter incomes; 1,742 units permitted in Alameda County in 2024 (856 in 5+ unit buildings).
- At $14,430/mo this rent would consume 183% of the median local household income ($95k/yr) (locally 2002% of renters already pay >50% of income on rent) — very limited rent-growth headroom before tenants either downsize or default.
Forward outlook
- Local home prices are declining (-3.0%/yr); year-one equity from $6k of loan paydown is wiped out by about $27k of value loss. Plan a longer hold.
- Alameda County population projected at +34% by 2050 — long-run rental-demand tailwind backs the buy-and-hold thesis.
- At projected returns (-3.0% appreciation + 3.2% rent growth), your $251k cash investment doubles in ~5 years — after that, you're playing with house money.
Negotiation context
- It's been on market 23 days — a 2% lower offer ($882k) is reasonable based on typical stale-listing flexibility.
- 3 sale attempts with the ask held roughly flat each time — persistent listings suggest the price (not the market) is what's stuck; bring a comps-based counter.
Risks & watch-outs
- Watch-outs: built in 1909 — expect roof / HVAC / electrical / plumbing capex.
Questions for the listing agent
- Can we see the unit-by-unit rent roll, current vacancy, and any below-market leases? What's the average tenancy length?
- What capital expenditures (roof, boiler, parking lot, exteriors) have been made in the last 5 years, and what's planned in the next 2?
- Built in 1909 — when were the roof, HVAC, electrical panel, plumbing, and water heater last replaced?
- Is there a deadline driving the sale (1031 exchange, divorce, estate, relocation)? That informs how much negotiation room exists.
- Crime grade is F in this area — have there been break-ins, vandalism, or insurance claims at this property in the last 3 years? What carrier currently insures it and at what premium?
- What's the average days-on-market for RENTAL listings here right now (not sales)? A rising rental-DOM trend means longer vacancies and softer asking-rent achievability than the comps imply.
- What's the recent tenant-quality profile in this submarket — average credit score on applications, eviction rate, late-payment / NSF rate, and stable-employment percentage? A property-management company in the area should have these aggregated.
- How much new apartment / multifamily construction is in the pipeline within 1–3 miles? Heavy new supply (>2% of stock underway) typically softens rents 12–24 months out; light construction supports rent growth.
Investment metrics
- 1% rule
- 1.61% ✓
- Cap rate
- 14.26%
- Cash-on-cash
- 28.46%
- DSCR
- 2.27
- GRM
- 5.2
CMA / ARV
No comps found within radius.
Projected returns pro-forma
-3.0% appreciation · 3.24% rent growth · sell at horizon
- IRR
- 22.9%
- Equity multiple
- 1.94×
- Total profit
- $236,762
- Equity at exit
- $133,447
- IRR
- 31.0%
- Equity multiple
- 3.82×
- Total profit
- $707,052
- Equity at exit
- $77,383
Cash invested: $250,600 (down + closing). Projections, not guarantees.
Landlord ↔ Tenant lean methodology
- Overall (CITY)
- 0 Strongly Tenant-Friendly
- State California
- 18 Strongly Tenant-Friendly · D+13
- County
- — inherits STATE
- City Oakland
- 0 Strongly Tenant-Friendly · D+62
ZIP-level market 94607
- Rents YoY
- 3.2%
- Active inventory
- 133
- Price-to-rent
- 20.7×
Monthly cashflow live
- Estimated rent
- $14,430 medium interval (Pro) →
- Mortgage (P&I)
- −$4,693
- Tax from tax record
- −$390 /mo · $4,681/yr
- Insurance
- −$373
- HOA
- −$0
- Vacancy / Maint / Mgmt
- −$3,030
- Net cashflow
- $5,943
Break-even live
4-unit breakdown (identical units grouped — click to expand)
| Units | Beds | Baths | Est. rent |
|---|---|---|---|
| 4× units | 7 | 4 | $14,428 |
| #1 | 7 | 4 | $3,607 |
| #2 | 7 | 4 | $3,607 |
| #3 | 7 | 4 | $3,607 |
| #4 | 7 | 4 | $3,607 |
| Total (4 units) | $14,430 | ||
UW: 25.0% down · 7.5% · 30yr · 1.5% tax · 5.0% vac · 8.0% maint · 8.0% mgmt
Financing live
Cash to close
- Down payment
- $223,750
- Closing costs
- $26,850
- Reserves months
- —
- Total cash needed
- —
Loan-product check · same deal, 3 products live
Conventional
25% down · 7.5% · 30yr
- Down + closing
- —
- Monthly P&I
- —
- Monthly cashflow
- —
- DSCR
- —
- Eligible?
- —
Personal DTI + credit; lowest rate.
DSCR
20% down · 8.5% · 30yr
- Down + closing
- —
- Monthly P&I
- —
- Monthly cashflow
- —
- DSCR
- —
- Eligible?
- —
No personal income docs; deal must DSCR.
Hard money
10% down · 12.0% · 12mo
- Down + closing
- —
- Monthly P&I
- —
- Monthly cashflow
- —
- DSCR
- —
- Eligible?
- —
Short-term bridge; refi at stabilization.
Listing history 19 events
-
2026-06-18days on market $895,000 Active 23 DOM
-
2026-06-17days on market $895,000 Active 22 DOM
-
2026-06-16days on market $895,000 Active 21 DOM
-
2026-06-15days on market $895,000 Active 20 DOM
-
2026-06-13days on market $895,000 Active 18 DOM
-
2026-06-13days on market $895,000 Active 17 DOM
-
2026-06-09days on market $895,000 Active 14 DOM
-
2026-06-08days on market $895,000 Active 13 DOM
-
2026-06-07days on market $895,000 Active 12 DOM
-
2026-06-04days on market $895,000 Active 9 DOM
-
2026-06-03days on market $895,000 Active 8 DOM
-
2026-06-02days on market $895,000 Active 7 DOM
-
2026-06-01days on market $895,000 Active 6 DOM
-
2026-05-31days on market $895,000 Active 5 DOM
-
2026-05-26$895,000 Active
-
2026-04-03historical
-
2026-02-05Active
-
2025-12-12historical
-
2025-10-10Active
ⓘ Source: listings_history table (triggers on properties + properties_extension) + one-shot
backfill from property_details.listing_events for pre-trigger history.
Tax reassessment forecast CA · Resets to sale price
- Current annual tax
- $4,681 · $390/mo
- Projected year-2 tax
- $6,802 · $567/mo
- Expected delta
- +$2,121/yr (+$177/mo · 45.3%)
ⓘ Screening estimate from a state-policy table — verify with the county assessor before closing.
Climate risk First Street
- Flood 1/10 Low FEMA zone X (unshaded) · 0% chance over 30 yrs
- Wildfire 1/10 Low
- Heat 3/10 Moderate 7 d/yr ≥82°F today · 15 d/yr by 30 yrs out
- Wind 1/10 Low
- Air quality 9/10 Extreme 16 unhealthy d/yr today · 16 by 30 yrs out
Nearby sold comps map
Loading sold comps map…
Walkable amenities ~0.75 mi
Loading nearby amenities…
Taxation est. · year 1
- Rental income
- $173,160
- − Mortgage interest
- −$50,134
- − Property taxes
- −$4,681
- − Insurance
- −$4,475
- − Repairs & maintenance
- −$13,853
- − Management
- −$13,853
- − Depreciation
- −$26,036
- Taxable income
- $60,128
- Est. tax owed @ 24.0%
- −$14,431
- After-tax cash flow
- $56,888/yr
For passive investors: Depreciation is non-cash, so a rental often shows a tax loss while cash-flowing — sheltering income. Rental losses are passive: they offset passive income freely, and up to $25,000/yr can offset ordinary (W-2) income if you actively participate and your MAGI is under $100k (phasing out to $0 by $150k); unused losses carry forward. On sale, claimed depreciation is recaptured at up to 25%, and gains may owe capital-gains tax (a 1031 exchange can defer both). Figures are a year-1 estimate at your 24.0% rate — not tax advice; consult a CPA.
Schools (NCES district)
- District
- Oakland Unified
- NCES district ID
- 0628050
- Math proficiency
- 27% ▬ 0.00%
- Reading proficiency
- 33% ▬ 0.00%
- Median HH income
- $55,194
- Composite
- 29.52/100
- National rank
- #11769
- State rank
- #1007 of 1400 in CA
Livability — Oakland
- Score
- 71/100
- State rank
- #224
- US rank
- #7245
Category grades
Schools grade is shown separately in the Schools card above.
Census & demographics
- Census place
- Oakland, CA
- County
- Alameda County · 1,614,355 people
- City population
- 385,993
- Metro
- San Francisco-Oakland-Berkeley, CA
- Population (ZIP)
- 28,804
- Household income
- $94,863
- Rent vs Own
- Severe rent burden
- 2002.0
Population outlook (Alameda County) Hauer SSP2
- Today (2025)
- 1,928,884 people
- By 2030
- 2,069,146 · +7.3%
- By 2040
- 2,338,405 · +21.2%
- By 2050
- 2,586,608 · +34.1%
- By 2075
- 3,061,911 · +58.7%
- By 2100
- 3,234,133 · +67.7%
Race, ethnicity, and origin ACS 2023
- Neighborhood character
- Highly diverse neighborhood (Simpson 0.78)
- Race & ethnicity
- Black 29% White 25% Asian 25% Hispanic / Latino 13% Two or more races 10%
- Hispanic origin (detail)
- Mexican 8%
- Common ancestry
- Lithuanian 1% Romanian 1% Portuguese 1%
- Foreign-born
- 28% · China, Canada, Vietnam
- Languages at home
- 65% English-only · Chinese 16% Spanish 8% Arabic 2%
Political lean MEDSL · Alameda
- 2024 margin
- Solid D (+53.6) · D 74.6% · R 21.0% · Other 4.4%
- 2008→2024 swing
- -5.9pp toward R · 2008: 59.5pp · 2024: 53.6pp
- All cycles
- 2024: D+53.6 2020: D+62.5 2016: D+64.4 2012: D+59.8 2008: D+59.5
Not yet ingested
- Civics
- —
Market trends
- HPI YoY
- ▼ -170.49%
- Current HPI
- 263.5885
- Rent YoY
- ▲ 3.24%
- Metro
- San Francisco-Oakland-Berkeley, CA
- State GDP YoY
- ▲ 3.21%
- F500 in state
- 116
Industry mix (Fortune 500 HQ in CA)
| Industry | F500 HQs | Revenue |
|---|---|---|
| Technology | 27 | $1,492B |
|
||
| Financial Services | 3 | $174B |
|
||
| Retail | 3 | $44B |
|
||
| Insurance | 3 | $26B |
|
||
| Media / Entertainment | 2 | $115B |
|
||
| Pharmaceuticals / Biotech | 2 | $62B |
|
||
Price history
5 events — show timeline
- 2026-05-26 Listed $895,000 bridgeMLS, Bay East AOR, or Contra Costa AOR
- 2026-04-03 Listing Removed — bridgeMLS, Bay East AOR, or Contra Costa AOR
- 2026-02-05 Listed — bridgeMLS, Bay East AOR, or Contra Costa AOR
- 2025-12-12 Listing Removed — bridgeMLS, Bay East AOR, or Contra Costa AOR
- 2025-10-10 Listed — bridgeMLS, Bay East AOR, or Contra Costa AOR
Property tax history
+5.5%/yrLatest (2025): $4,681 · +6.3% YoY. Source: county tax records.
Cash-flow waterfall
monthlySold comps — $/sqft
last 12 mo · ≤1 miLoading sold comps…