 Multi-family
221 Sussex Ave · Newark, NJ
Flood risk No data
- FEMA flood zone
- —
- Chance of flooding over 30 yrs
- —
- Est. flood insurance / yr
- —
Fire risk No data
- Est. fire insurance / yr
- —
Heat risk No data
- Hot days now (above threshold)
- —
- Hot days in 30 yrs
- —
Wind risk No data
- Chance of severe wind over 30 yrs
- —
Air-quality risk No data
- Unhealthy air days now
- —
- Unhealthy air days in 30 yrs
- —
Risk factors via First Street. Map © Google.
Why this score? — see what drove the C- grade
The composite is a weighted blend of 9 inputs, each scored 0–100. Each bar is that input's sub-score; the figure is the points it added to the 100-point composite (weight × sub-score).
- Cash flow +19.2/30.0
- ARV discount +7.5/15.0
- DSCR +6.1/10.0
- Appreciation +6.1/10.0
- 1% rule +5.1/10.0
- Livability +3.4/5.0
- Rent growth +2.6/5.0
- Schools +1.4/10.0
- Condition / age +1.0/5.0
$1,350,000
🖨 Deal sheet 📄 Offer letter ✓ Due diligence
Multi-family units
County records classify this as Multi-Family (5+ Unit). Listing-text estimate: 1 unit. estimate disagrees with records
5+ unit building — per-unit beds/baths from public records are typically unavailable; the breakdown below (if shown) is an estimate from the listing text.
Listing remarks
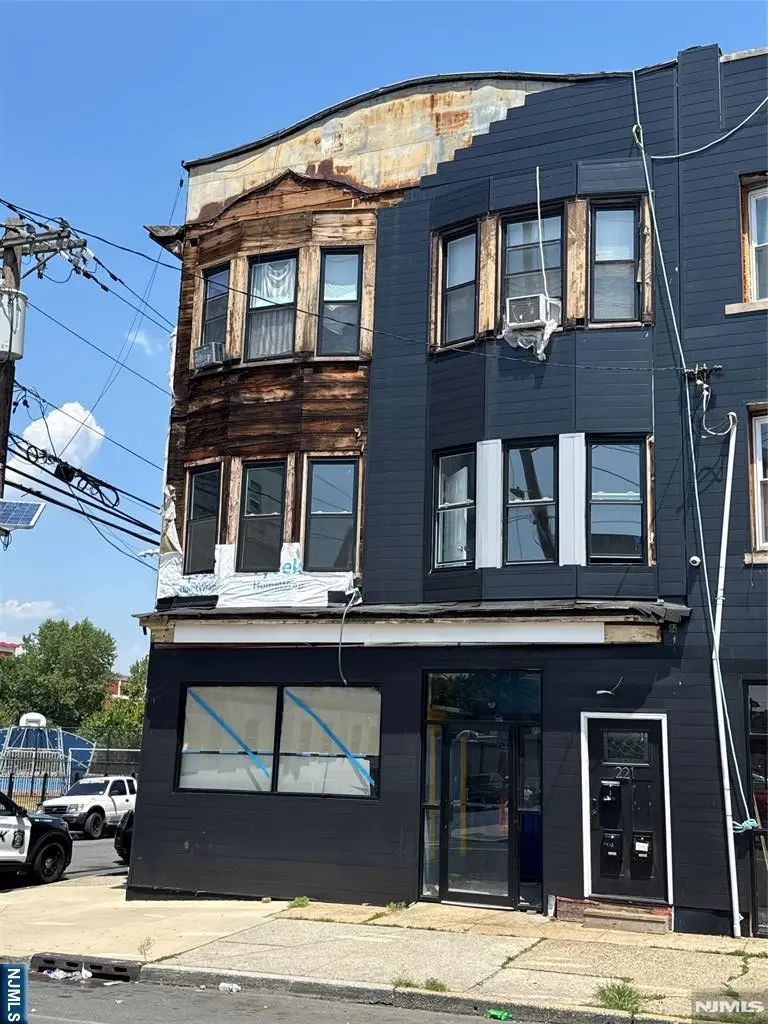
Exceptional mixed-use investment opportunity in Newark's thriving University Heights neighborhood! 221 Sussex Avenue features four residential units and one ground-floor commercial space, creating multiple income streams and strong cash-flow potential. Conveniently located near universities, downtown Newark, public transportation, major highways, and ongoing redevelopment projects, this property is positioned in one of the city's most desirable rental markets. Whether you're an experienced investor or looking to expand your portfolio, this property offers a combination of stable income, future appreciation potential, and long-term value. Don't miss this opportunity to own a well-located mix
Key facts
- Six units
- High-growth area
- Listed 22 days
Tags
Property features AI
Exterior
- Home design: Residential income property; Mixed-use
- Exterior features: Flat roof
Neighborhood map
What this means for you Summary
Snapshot
- This is a multifamily listed at $1.35M. Condition is rated poor.
Deal economics
- At list price, monthly cash flow is $1k ($17k/yr) — positive.
- The deal already cash-flows at list — no discount required.
- Meets the 1% rule at list price ($14k rent vs $1.35M).
- Recommended offer: $1.33M (1.5% below list) — sets the bar for market timing.
- Cap rate 7.6% vs local median 3.0% in Newark — top-decile yield for the area; either an underpriced asset or a hidden risk that comps aren't pricing in. Stress-test before assuming the spread holds.
Location & tenants
- Location reads 67/100 on livability (#343 in NJ) — a middle-class / working-renter tenant base. Strengths: commute A+, amenities A-; Watch: schools D+, housing D+, crime F.
- Newark Public School District (urban): math 9% / reading 26% proficiency, ranked #452 of 472 in NJ (top 96%) — low school quality limits family demand, transient renter base, plan for 1-2y turnover; 79% free/reduced lunch — lower-income household profile, screen leases tightly.
- Market conditions: Rents flat; 61 active listings in the ZIP; 40 comparable units currently listed for rent nearby; rentals at typical pace (median 25d on market — plan ~3-4 weeks tenant-placement turnaround); 3,364 units permitted in Essex County in 2024 (2,551 in 5+ unit buildings).
- At $13,654/mo this rent would consume 318% of the median local household income ($52k/yr) (locally 2963% of renters already pay >50% of income on rent) — very limited rent-growth headroom before tenants either downsize or default.
Forward outlook
- In year one you build about $39k of equity ($9k loan paydown + $29k appreciation (2.2% local appreciation)).
- Essex County population projected at +3% by 2050 — modest demand growth; plan on rents tracking national, not racing it.
- At projected returns (2.2% appreciation + 0.3% rent growth), your $378k cash investment doubles in ~7 years — after that, you're playing with house money.
- By year 3, paydown + projected appreciation supports a ~$98k cash-out refi (75% LTV) — recoverable capital for the next deal without selling this one.
Negotiation context
- It's been on market 22 days — a 2% lower offer ($1.33M) is reasonable based on typical stale-listing flexibility.
- 2 sale attempts since 3y ago with the ask held roughly flat each time — persistent listings suggest the price (not the market) is what's stuck; bring a comps-based counter.
Questions for the listing agent
- Have any recent inspections been done? Can we get a copy of the seller's disclosures and any deferred-maintenance estimates?
- Is there a deadline driving the sale (1031 exchange, divorce, estate, relocation)? That informs how much negotiation room exists.
- Schools are D-rated, which usually means shorter tenancies and higher turnover. Who's the typical renter profile here, and what's been the actual vacancy rate?
- Crime grade is F in this area — have there been break-ins, vandalism, or insurance claims at this property in the last 3 years? What carrier currently insures it and at what premium?
- What's the average days-on-market for RENTAL listings here right now (not sales)? A rising rental-DOM trend means longer vacancies and softer asking-rent achievability than the comps imply.
- What's the recent tenant-quality profile in this submarket — average credit score on applications, eviction rate, late-payment / NSF rate, and stable-employment percentage? A property-management company in the area should have these aggregated.
- How much new apartment / multifamily construction is in the pipeline within 1–3 miles? Heavy new supply (>2% of stock underway) typically softens rents 12–24 months out; light construction supports rent growth.
Investment metrics
- 1% rule
- 1.01% ✓
- Cap rate
- 7.59%
- Cash-on-cash
- 4.63%
- DSCR
- 1.21
- GRM
- 8.2
CMA / ARV
No comps found within radius.
Show comp detail 12 sales within ~0.75 mi
| Address | Dist | Beds/Ba | Sqft | Sold | Price | $/sf | Match |
|---|---|---|---|---|---|---|---|
| 51-53 3Rd St | 0.22mi | —/— | — | 1mo | $675,000 | — | 76 |
| 322 New St | 0.28mi | 4/2.0 | — | 2mo | $609,500 | — | 73 |
| 343 Sussex Ave | 0.35mi | 7/6.0 | — | 2mo | $800,000 | — | 70 |
| 103 S 10Th St | 0.60mi | —/— | — | 1mo | $620,000 | — | 59 |
| 52 Stone St | 0.62mi | 6/4.5 | — | 0mo | $760,000 | — | 58 |
| 150 S 10Th St | 0.62mi | —/— | — | 0mo | $850,000 | — | 58 |
| 152 10th St | 0.62mi | 7/3.0 | — | 1mo | $547,000 | — | 58 |
| 437 7th Ave | 0.65mi | 12/4.0 | — | 1mo | $935,000 | — | 56 |
| 160 11th St | 0.65mi | 8/4.0 | — | 2mo | $685,000 | — | 56 |
| 285 6th St | 0.67mi | 6/3.5 | — | 1mo | $400,000 | — | 55 |
| 117 12th St | 0.69mi | 9/4.5 | — | 1mo | $800,000 | — | 54 |
| 163 7th St | 0.70mi | 8/4.0 | — | 1mo | $630,000 | — | 54 |
Match score weights: distance 35% · size 25% · config 20% · recency 20%. Top-matched comps best support the ARV.
Projected returns pro-forma
2.18% appreciation · 0.35% rent growth · sell at horizon
- IRR
- 8.0%
- Equity multiple
- 1.43×
- Total profit
- $162,196
- Equity at exit
- $545,345
- IRR
- 9.7%
- Equity multiple
- 2.27×
- Total profit
- $479,806
- Equity at exit
- $795,313
Cash invested: $378,000 (down + closing). Projections, not guarantees.
Landlord ↔ Tenant lean methodology
- Overall (CITY)
- 0 Strongly Tenant-Friendly
- State New Jersey
- 21 Tenant-Leaning · D+6
- County
- — inherits STATE
- City Newark
- 0 Strongly Tenant-Friendly · D+59
ZIP-level market 07103
- Home prices YoY
- 0.7%
- Rents YoY
- 0.3%
- Active inventory
- 61
- Price-to-rent
- 49.4×
Monthly cashflow live
- Estimated rent
- $13,654 high interval (Pro) →
- Mortgage (P&I)
- −$7,080
- Tax est. 1.5%
- −$1,688 /mo · $20,250/yr
- Insurance
- −$562
- HOA
- −$0
- Vacancy / Maint / Mgmt
- −$2,867
- Net cashflow
- $1,457
Break-even live
6-unit breakdown (identical units grouped — click to expand)
| Units | Beds | Baths | Est. rent |
|---|---|---|---|
| 6× units | 2 | 1 | $13,656 |
| #1 | 2 | 1 | $2,276 |
| #2 | 2 | 1 | $2,276 |
| #3 | 2 | 1 | $2,276 |
| #4 | 2 | 1 | $2,276 |
| #5 | 2 | 1 | $2,276 |
| #6 | 2 | 1 | $2,276 |
| Total (6 units) | $13,654 | ||
UW: 25.0% down · 7.5% · 30yr · 1.5% tax · 5.0% vac · 8.0% maint · 8.0% mgmt
Financing live
Cash to close
- Down payment
- $337,500
- Closing costs
- $40,500
- Reserves months
- —
- Total cash needed
- —
Loan-product check · same deal, 3 products live
Conventional
25% down · 7.5% · 30yr
- Down + closing
- —
- Monthly P&I
- —
- Monthly cashflow
- —
- DSCR
- —
- Eligible?
- —
Personal DTI + credit; lowest rate.
DSCR
20% down · 8.5% · 30yr
- Down + closing
- —
- Monthly P&I
- —
- Monthly cashflow
- —
- DSCR
- —
- Eligible?
- —
No personal income docs; deal must DSCR.
Hard money
10% down · 12.0% · 12mo
- Down + closing
- —
- Monthly P&I
- —
- Monthly cashflow
- —
- DSCR
- —
- Eligible?
- —
Short-term bridge; refi at stabilization.
Rent comps 40 comps
| Address | Beds | Baths | Sqft | Rent | $/sqft | DOM | Units | Dist |
|---|---|---|---|---|---|---|---|---|
| 207 Sussex Ave Newark, NJ | 2.0 | 1.0 | — | $1,400 | — | 20d | 1 | 0.04mi |
| 207 Sussex Ave Unit 4 Newark, NJ | 2.0 | 1.0 | — | $1,400 | — | 21d | 1 | 0.04mi |
| 44 Hecker St Unit 1 Newark, NJ | 3.0 | 2.0 | — | $2,200 | — | 20d | 1 | 0.06mi |
| 44 Hecker St Newark, NJ | 3.0 | 2.0 | — | $2,200 | — | 21d | 1 | 0.06mi |
| 34-40 Hudson St Newark, NJ | 1.0 | 1.0 | 637 | $2,108 | $3.31 | 4d | 3 | 0.11mi |
| 7 Hudson St Unit 2 Newark, NJ | 3.0 | 1.0 | 1400 | $2,500 | $1.79 | 22d | 1 | 0.11mi |
| 6 Hecker St Unit A Newark, NJ | 3.0 | 1.0 | 1296 | $2,550 | $1.97 | 17d | 1 | 0.11mi |
| 7-9 Hudson St Unit 2ND Newark, NJ | 3.0 | 1.0 | — | $2,500 | — | 24d | 1 | 0.12mi |
| 175 1st St Newark, NJ | 1.0–2.0 | 1.0 | 869 | $1,050 | $1.21 | 24d | 1 | 0.18mi |
| 17 Norfolk St Newark, NJ | 3.0 | 2.0 | — | $2,850 | — | 24d | 1 | 0.18mi |
| 17 Norfolk St Unit 2 Newark, NJ | 3.0 | 2.0 | — | $2,850 | — | 24d | 1 | 0.18mi |
| 17 Norfolk St Unit 2 Newark, NJ | 3.0 | 2.0 | 9999 | $2,850 | $0.29 | 17d | 1 | 0.18mi |
| 290 Sussex Ave Unit 2 Newark, NJ | 3.0 | 2.0 | — | $2,400 | — | 24d | 1 | 0.19mi |
| 50 Norfolk St Newark, NJ | 1.0–2.0 | 1.0–2.0 | 905 | $2,600 | $2.87 | 2d | 2 | 0.20mi |
| 64 1st St Unit 3 Newark, NJ | 3.0 | 1.5 | 999 | $2,500 | $2.50 | 24d | 1 | 0.20mi |
| 58 Norfolk St Newark, NJ | 1.0–2.0 | 1.0–2.0 | 712 | $2,800 | $3.93 | 2d | 21 | 0.20mi |
| 287 Orange St Unit 2 Newark, NJ | 3.0 | 2.0 | — | $2,500 | — | 21d | 1 | 0.21mi |
| 41 3rd St Unit 2 Newark, NJ | 3.0 | 2.0 | — | $2,700 | — | 24d | 1 | 0.23mi |
| 279 Orange St Unit 1 Newark, NJ | 3.0 | 2.0 | — | $2,800 | — | 24d | 1 | 0.24mi |
| 198 1st St Newark, NJ | 3.0 | 2.0 | — | $2,600 | — | 7d | 1 | 0.24mi |
| 44 1/2 3rd St #2 Newark, NJ | 3.0 | 2.0 | — | $2,500 | — | 24d | 1 | 0.25mi |
| 379 New St Newark, NJ | 2.0 | 1.0 | 861 | $2,200 | $2.56 | 24d | 1 | 0.25mi |
| 134 Sussex Ave Newark, NJ | 1.0–2.0 | 1.0 | 600 | $2,200 | $3.67 | 6d | 5 | 0.26mi |
| 196 2nd St Newark, NJ | 3.0 | 1.0 | — | $2,250 | — | 24d | 1 | 0.27mi |
| 254 Orange St Newark, NJ | 1.0–3.0 | 1.0–2.0 | 683 | $2,574 | $3.77 | 3d | 15 | 0.29mi |
| 332 New St Newark, NJ | 1.0 | 1.0 | 700 | $1,500 | $2.14 | 24d | 1 | 0.29mi |
| 322 New St Newark, NJ | 2.0 | 1.0 | — | $2,400 | — | 24d | 1 | 0.31mi |
| 58 N 5th St Unit 3 Newark, NJ | 1.0 | 1.0 | 2501 | $1,550 | $0.62 | 4d | 1 | 0.33mi |
| 309 7th Ave W Unit 1 Newark, NJ | 3.0 | 1.0 | — | $2,200 | — | 17d | 1 | 0.33mi |
| 27 N 5th St Unit 3 Newark, NJ | 2.0 | 1.0 | — | $1,750 | — | 24d | 1 | 0.34mi |
| 186 3rd St Unit 1 Newark, NJ | 3.0 | 2.0 | — | $2,390 | — | 24d | 1 | 0.36mi |
| 186 3rd St Unit 1 Newark, NJ | 3.0 | 2.0 | — | $2,390 | — | 15d | 1 | 0.36mi |
| 45 N 6th St Unit 2 Newark, NJ | 3.0 | 1.0 | 871 | $2,500 | $2.87 | 24d | 1 | 0.36mi |
| 70 N 6th St Unit 2 Newark, NJ | 3.0 | 2.5 | 1400 | $2,400 | $1.71 | 24d | 1 | 0.37mi |
| 203 3rd St Unit 1 Newark, NJ | 3.0 | 1.0 | 850 | $2,195 | $2.58 | 24d | 1 | 0.38mi |
| 203 3rd St Apt 3 Newark, NJ | 3.0 | 1.0 | — | $2,200 | — | 17d | 1 | 0.38mi |
| 162 N 5th St Newark, NJ | 2.0 | 1.0 | 779 | $2,350 | $3.02 | 7d | 1 | 0.38mi |
| 22-24 Mount Prospect Ave Unit 1 Newark, NJ | 3.0 | 1.5 | — | $3,200 | — | 17d | 1 | 0.41mi |
| 19 N 7th St Unit 2 Newark, NJ | 3.0 | 1.0 | — | $2,500 | — | 24d | 1 | 0.41mi |
| 5 N 7th St Newark, NJ | 3.0 | 1.0 | — | $2,100 | — | 24d | 1 | 0.42mi |
Listing history 18 events
-
2026-06-18days on market $1,350,000 Active 22 DOM
-
2026-06-17days on market $1,350,000 Active 21 DOM
-
2026-06-16days on market $1,350,000 Active 20 DOM
-
2026-06-15remarks 699-char remark
-
2026-06-15days on market $1,350,000 Active 19 DOM
-
2026-06-13days on market $1,350,000 Active 17 DOM
-
2026-06-13days on market $1,350,000 Active 16 DOM
-
2026-06-09days on market $1,350,000 Active 13 DOM
-
2026-06-08days on market $1,350,000 Active 12 DOM
-
2026-06-07days on market $1,350,000 Active 11 DOM
-
2026-06-04days on market $1,350,000 Active 8 DOM
-
2026-06-03days on market $1,350,000 Active 7 DOM
-
2026-06-02days on market $1,350,000 Active 6 DOM
-
2026-06-01days on market $1,350,000 Active 5 DOM
-
2026-05-31days on market $1,350,000 Active 4 DOM
-
2026-05-27$1,350,000 Active
-
2024-01-11historical $2,200
-
2023-12-08$2,200
ⓘ Source: listings_history table (triggers on properties + properties_extension) + one-shot
backfill from property_details.listing_events for pre-trigger history.
Nearby sold comps map
Loading sold comps map…
Walkable amenities ~0.75 mi
Loading nearby amenities…
Taxation est. · year 1
- Rental income
- $163,848
- − Mortgage interest
- −$75,621
- − Property taxes
- −$20,250
- − Insurance
- −$6,750
- − Repairs & maintenance
- −$13,108
- − Management
- −$13,108
- − Depreciation
- −$39,273
- Taxable loss
- −$4,261
- Est. tax savings @ 24.0%
- +$1,023
- After-tax cash flow
- $18,508/yr
For passive investors: Depreciation is non-cash, so a rental often shows a tax loss while cash-flowing — sheltering income. Rental losses are passive: they offset passive income freely, and up to $25,000/yr can offset ordinary (W-2) income if you actively participate and your MAGI is under $100k (phasing out to $0 by $150k); unused losses carry forward. On sale, claimed depreciation is recaptured at up to 25%, and gains may owe capital-gains tax (a 1031 exchange can defer both). Figures are a year-1 estimate at your 24.0% rate — not tax advice; consult a CPA.
Condition & rehab AI · 7 photos
This multi-family property requires extensive repairs and maintenance, including a new roof and siding, to become move-in ready and increase its value.
Repairs flagged
- Major roof — Severe rust and deterioration
- Major exterior siding — Severe weathering
- Major interior walls — No photos, but likely in poor condition
Value-add opportunities
- Both roof replacement — Critical to safety and appearance
- Both exterior siding repair — Improves curb appeal and structural integrity
- Both interior paint — Enhances interior aesthetics and value
Renovation cost estimate screening
| Repair item | Severity | Est. cost |
|---|---|---|
| roof · Severe rust and deterioration | Major | $15,000–50,000 |
| exterior siding · Severe weathering | Major | $15,000–50,000 |
| interior walls · No photos, but likely in poor condition | Major | $15,000–50,000 |
| Total estimated repair cost · 3 items | $45,000–150,000 |
Value-add ROI direction
- Both roof replacement — Critical to safety and appearance ↑
- Both exterior siding repair — Improves curb appeal and structural integrity ↑
- Both interior paint — Enhances interior aesthetics and value ↑
ⓘ Cost ranges are severity-bucket heuristics (US national rule-of-thumb). Get contractor quotes + a written scope before underwriting a rehab budget.
Schools (NCES district)
- District
- Newark Public School District
- NCES district ID
- 3411340
- Math proficiency
- 9% ▼ -17.00%
- Reading proficiency
- 26% ▼ -10.00%
- Median HH income
- $33,891
- Composite
- 14.24/100
- National rank
- #9449
- State rank
- #452 of 472 in NJ
Livability — Newark
- Score
- 67/100
- State rank
- #343
- US rank
- #11138
Category grades
Schools grade is shown separately in the Schools card above.
Census & demographics
- Census place
- Newark, NJ
- County
- Essex County · 825,405 people
- City population
- 310,602
- Metro
- New York-Newark-Jersey City, NY-NJ-PA
- Population (ZIP)
- 37,293
- Household income
- $51,534
- Rent vs Own
- Severe rent burden
- 2963.0
Population outlook (Essex County) Hauer SSP2
- Today (2025)
- 825,042 people
- By 2030
- 834,010 · +1.1%
- By 2040
- 846,221 · +2.6%
- By 2050
- 850,047 · +3.0%
- By 2075
- 837,009 · +1.5%
- By 2100
- 784,345 · -4.9%
Race, ethnicity, and origin ACS 2023
- Neighborhood character
- Predominantly Black (71%)
- Race & ethnicity
- Black 71% Hispanic / Latino 18% Two or more races 10% White 4% Asian 4%
- Hispanic origin (detail)
- Puerto Rican 7% Dominican 7%
- Common ancestry
- Hispanic 2%
- Foreign-born
- 23% · Canada, South Korea, United Kingdom
- Languages at home
- 71% English-only · Spanish 14% French/Haitian/Cajun 4% Other Indo-European 2%
Political lean MEDSL · Essex
- 2024 margin
- Solid D (+44.9) · D 71.7% · R 26.8% · Other 1.5%
- 2008→2024 swing
- -7.7pp toward R · 2008: 52.6pp · 2024: 44.9pp
- All cycles
- 2024: D+44.9 2020: D+55.4 2016: D+56.4 2012: D+55.5 2008: D+52.6
Not yet ingested
- Civics
- —
Market trends
- HPI YoY
- ▲ 2.18%
- Current HPI
- 301.5896
- Rent YoY
- ▲ 0.35%
- Metro
- New York-Newark-Jersey City, NY-NJ-PA
- State GDP YoY
- ▲ 2.05%
- F500 in state
- 34
Industry mix (Fortune 500 HQ in NJ)
| Industry | F500 HQs | Revenue |
|---|---|---|
| Consumer Goods | 3 | $31B |
|
||
| Pharmaceuticals | 2 | $153B |
|
||
| Technology | 2 | $21B |
|
||
| Insurance | 2 | $20B |
|
||
| Healthcare | 2 | $19B |
|
||
| Financial Services | 1 | $70B |
|
||
Price history
+61263.6% since first listed3 events — show timeline
- 2026-05-27 Listed $1,350,000 NJMLS
- 2024-01-11 Rental Removed $2,200 GSMLS
- 2023-12-08 Listed for Rent $2,200 GSMLS
Cash-flow waterfall
monthlySold comps — $/sqft
last 12 mo · ≤1 miLoading sold comps…