 Duplex
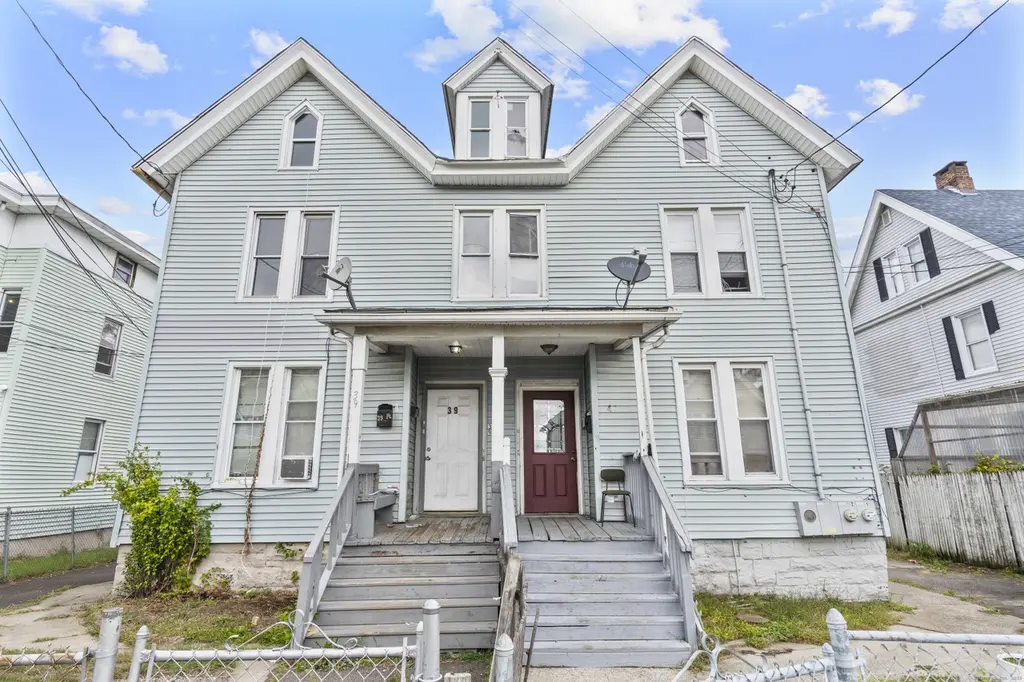
39 Jane St · Bridgeport, CT
Flood risk 1/10 · Minimal
- FEMA flood zone
- X (unshaded)
- Chance of flooding over 30 yrs
- 0.0%
- Est. flood insurance / yr
- $473 – $860
Fire risk 1/10 · Minimal
- Est. fire insurance / yr
- $829 – $1,539
Heat risk 6/10 · Moderate
- Hot days now (above 97°F)
- 7 days/yr
- Hot days in 30 yrs
- 15 days/yr
Wind risk 6/10 · Moderate
- Chance of severe wind over 30 yrs
- 41.0%
Air-quality risk 4/10 · Minor
- Unhealthy air days now
- 5 days/yr
- Unhealthy air days in 30 yrs
- 7 days/yr
Risk factors via First Street. Map © Google.
Why this score? — see what drove the C- grade
The composite is a weighted blend of 9 inputs, each scored 0–100. Each bar is that input's sub-score; the figure is the points it added to the 100-point composite (weight × sub-score).
- Cash flow +16.6/30.0
- Appreciation +10.0/10.0
- ARV discount +7.3/15.0
- DSCR +5.2/10.0
- 1% rule +4.0/10.0
- Livability +4.0/5.0
- Rent growth +3.6/5.0
- Condition / age +2.5/5.0
- Schools +1.2/10.0
$479,000
🖨 Deal sheet 📄 Offer letter ✓ Due diligence
Multi-family units
County records classify this as Multi-Family (2-4 Unit). Listing-text estimate: 2 units. confirmed
Listing remarks MLS
Assumable financing at 4.8 percent available! Well-maintained two-family home located on Bridgeport's East Side, ideal for both investors and owner-occupants. The first-floor unit offers 1 bedroom and 1 bath with a bright, open layout. The spacious second-floor duplex features 5 bedrooms and 1 bath, providing excellent rental income potential or flexible living arrangements. Each unit is separately metered for utilities and includes gas heat, updated mechanicals, and low-maintenance vinyl siding. Private backyard and off-street parking potential. Conveniently located near Seaside Park, Downtown, Route 8, and I-95. Projected gross income up to $51,000 annually. A great opportunity to own a high-cash-flow property in one of Bridgeport's strongest rental markets!
Key facts
- Bright open layout
- Gas heat
- Updated mechanicals
Tags
Neighborhood map
What this means for you Summary
Snapshot
- This is a 2 × 3-bed/1.0-bath units multifamily listed at $479k.
Deal economics
- At list price, monthly cash flow is $293 ($4k/yr) — positive. Per door: $147/mo.
- The deal already cash-flows at list — no discount required.
- To meet the 1% rule (rent ≥ 1% of price), the offer needs to be $432k (9.7% below list).
- Recommended offer: $422k (12.0% below list) — sets the bar for market timing.
- Cap rate 7.0% vs local median 5.0% in Bridgeport — top-decile yield for the area; either an underpriced asset or a hidden risk that comps aren't pricing in. Stress-test before assuming the spread holds.
Location & tenants
- Location reads 81/100 on livability (#15 in CT, #1,374 nationally) — a professional / high-income tenant draw. Strengths: amenities A+, commute A+, health & safety A+; Watch: crime C-, employment D+, schools D-.
- Bridgeport School District (urban): math 9% / reading 19% proficiency, ranked #151 of 153 in CT (top 99%) — low school quality limits family demand, transient renter base, plan for 1-2y turnover; 97% free/reduced lunch — lower-income household profile, screen leases tightly.
- Market conditions: Rents rising fast (+4.3%/yr); 30 active listings in the ZIP; 21 comparable units currently listed for rent nearby; rentals at typical pace (median 24d on market — plan ~3-4 weeks tenant-placement turnaround); 852 units permitted in Greater Bridgeport Planning Region in 2024 (698 in 5+ unit buildings).
- At $4,323/mo this rent would consume 113% of the median local household income ($46k/yr) (locally 910% of renters already pay >50% of income on rent) — very limited rent-growth headroom before tenants either downsize or default.
Forward outlook
- In year one you build about $51k of equity ($3k loan paydown + $48k appreciation (10.0% local appreciation)).
- At projected returns (10.0% appreciation + 4.3% rent growth), your $134k cash investment doubles in ~3 years — after that, you're playing with house money.
- By year 2, paydown + projected appreciation supports a ~$82k cash-out refi (75% LTV) — recoverable capital for the next deal without selling this one.
Negotiation context
- It's been on market 225 days — a 12% lower offer ($422k) is reasonable based on typical stale-listing flexibility.
- 12 sale attempts since 27y ago with the ask held roughly flat each time — persistent listings suggest the price (not the market) is what's stuck; bring a comps-based counter.
- Current owner paid $140k; list at $479k implies a 242% gain — meaningful room to come down on a strong offer.
Risks & watch-outs
- Watch-outs: built in 1902 — expect roof / HVAC / electrical / plumbing capex.
- Climate carrying-cost: major wind risk, 41% chance of damaging wind over 30y; extreme-heat days projected 7→15/yr by 2055 (HVAC capex compounding) — expect insurance premiums to compound above CPI over the hold.
Questions for the listing agent
- It's been on market 225 days. Have you received any prior offers? Is the seller open to a 12% concession, seller financing, or rate buy-down credit?
- Can we see the unit-by-unit rent roll, current vacancy, and any below-market leases? What's the average tenancy length?
- What capital expenditures (roof, boiler, parking lot, exteriors) have been made in the last 5 years, and what's planned in the next 2?
- Built in 1902 — when were the roof, HVAC, electrical panel, plumbing, and water heater last replaced?
- Why hasn't it sold? Are there any deal-killer items the seller is aware of (foundation, flood, title, zoning, code violations)?
- Is there a deadline driving the sale (1031 exchange, divorce, estate, relocation)? That informs how much negotiation room exists.
- Schools are D-rated, which usually means shorter tenancies and higher turnover. Who's the typical renter profile here, and what's been the actual vacancy rate?
- What's the average days-on-market for RENTAL listings here right now (not sales)? A rising rental-DOM trend means longer vacancies and softer asking-rent achievability than the comps imply.
- What's the recent tenant-quality profile in this submarket — average credit score on applications, eviction rate, late-payment / NSF rate, and stable-employment percentage? A property-management company in the area should have these aggregated.
- How much new apartment / multifamily construction is in the pipeline within 1–3 miles? Heavy new supply (>2% of stock underway) typically softens rents 12–24 months out; light construction supports rent growth.
Investment metrics
- 1% rule
- 0.90% ✗
- Cap rate
- 7.03%
- Cash-on-cash
- 2.63%
- DSCR
- 1.12
- GRM
- 9.2
CMA / ARV
- ARV (median comp)
- $477,323
- List price
- $479,000
- Delta
- 0.35%
- Verdict
- FAIR
- Comps
- 20 within 1.0 mi
Show comp detail 12 sales within ~0.75 mi
| Address | Dist | Beds/Ba | Sqft | Sold | Price | $/sf | Match |
|---|---|---|---|---|---|---|---|
| 530 Jane St | 0.46mi | 4/2.0 (-1) | 2,217 (+3%) | 5mo | $599,000 | $270 | 64 |
| 1248 Pembroke St | 0.41mi | 6/2.0 (+1) | 2,310 (+7%) | 3mo | $460,000 | $199 | 62 |
| 107 Colony St | 0.69mi | 4/2.0 (-1) | 2,188 (+2%) | 3mo | $330,000 | $151 | 58 |
| 277 Helen St | 0.54mi | 4/2.0 (-1) | 1,997 (-7%) | 2mo | $375,000 | $188 | 56 |
| 30-32 Hadley St | 0.61mi | 4/2.0 (-1) | 2,188 (+2%) | 20mo | $355,000 | $162 | 48 |
| 44 Locust St | 0.74mi | 4/2.0 (-1) | 2,054 (-5%) | 6mo | $515,000 | $251 | 48 |
| 509 Pembroke St | 0.72mi | 4/3.0 (-1) | 2,290 (+6%) | 2mo | $500,000 | $218 | 46 |
| 41 Sedgewick St | 0.72mi | 5/2.0 | 2,037 (-6%) | 15mo | $500,000 | $245 | 44 |
| 36-40 Carver St | 0.69mi | 4/2.0 (-1) | 2,188 (+2%) | 19mo | $450,000 | $206 | 44 |
| 64 Locust St | 0.74mi | 4/2.0 (-1) | 2,028 (-6%) | 10mo | $515,000 | $254 | 42 |
| 75 Asylum St | 0.66mi | 4/2.0 (-1) | 2,014 (-7%) | 20mo | $330,000 | $164 | 37 |
| 27 Center St | 0.65mi | 4/2.0 (-1) | 2,361 (+10%) | 16mo | $385,000 | $163 | 35 |
Match score weights: distance 35% · size 25% · config 20% · recency 20%. Top-matched comps best support the ARV.
Projected returns pro-forma
10.0% appreciation · 4.35% rent growth · sell at horizon
- IRR
- 26.6%
- Equity multiple
- 3.13×
- Total profit
- $285,463
- Equity at exit
- $431,521
- IRR
- 23.7%
- Equity multiple
- 7.25×
- Total profit
- $838,605
- Equity at exit
- $930,592
Cash invested: $134,120 (down + closing). Projections, not guarantees.
Landlord ↔ Tenant lean methodology
- Overall (STATE)
- 27 Tenant-Leaning
- State Connecticut
- 27 Tenant-Leaning · D+7
- County
- — inherits STATE
- City
- — inherits STATE
ZIP-level market 06608
- Home prices YoY
- 3.6%
- Rents YoY
- 4.3%
- Active inventory
- 30
- Price-to-rent
- 18.5×
Monthly cashflow live
- Estimated rent
- $4,323 high interval (Pro) →
- Mortgage (P&I)
- −$2,512
- Tax from tax record
- −$410 /mo · $4,923/yr
- Insurance
- −$200
- HOA
- −$0
- Vacancy / Maint / Mgmt
- −$908
- Net cashflow
- $293
Break-even live
2-unit breakdown (identical units grouped — click to expand)
| Units | Beds | Baths | Est. rent |
|---|---|---|---|
| 2× units | 3 | 1 | $4,324 |
| #1 | 3 | 1 | $2,162 |
| #2 | 3 | 1 | $2,162 |
| Total (2 units) | $4,323 | ||
UW: 25.0% down · 7.5% · 30yr · 1.5% tax · 5.0% vac · 8.0% maint · 8.0% mgmt
Financing live
Cash to close
- Down payment
- $119,750
- Closing costs
- $14,370
- Reserves months
- —
- Total cash needed
- —
Loan-product check · same deal, 3 products live
Conventional
25% down · 7.5% · 30yr
- Down + closing
- —
- Monthly P&I
- —
- Monthly cashflow
- —
- DSCR
- —
- Eligible?
- —
Personal DTI + credit; lowest rate.
DSCR
20% down · 8.5% · 30yr
- Down + closing
- —
- Monthly P&I
- —
- Monthly cashflow
- —
- DSCR
- —
- Eligible?
- —
No personal income docs; deal must DSCR.
Hard money
10% down · 12.0% · 12mo
- Down + closing
- —
- Monthly P&I
- —
- Monthly cashflow
- —
- DSCR
- —
- Eligible?
- —
Short-term bridge; refi at stabilization.
Rent comps 21 comps
| Address | Beds | Baths | Sqft | Rent | $/sqft | DOM | Units | Dist |
|---|---|---|---|---|---|---|---|---|
| 141 Hicks St Bridgeport, CT | 4.0 | 1.0 | 2311 | $2,400 | $1.04 | 23d | 1 | 0.09mi |
| 36-38 Pleasant St Unit 2 Bridgeport, CT | 4.0 | 1.0 | 2395 | $2,700 | $1.13 | 14d | 1 | 0.09mi |
| 281 Harriet St Unit 281 Bridgeport, CT | 4.0 | 2.5 | 2297 | $3,900 | $1.70 | 44d | 1 | 0.20mi |
| 110 Maple St Unit 1L Bridgeport, CT | 6.0 | 2.5 | 1700 | $3,000 | $1.76 | 44d | 1 | 0.21mi |
| 7 Armstrong Pl Bridgeport, CT | 5.0 | 1.0 | 2449 | $2,750 | $1.12 | 23d | 1 | 0.23mi |
| 982 Pembroke St Unit 2L Bridgeport, CT | 4.0 | 1.0 | 2043 | $2,475 | $1.21 | 3d | 1 | 0.45mi |
| 479 Putnam St Unit 3R Bridgeport, CT | 5.0 | 2.0 | 2000 | $2,350 | $1.18 | 19d | 1 | 0.46mi |
| 52-54 Ives Ct Bridgeport, CT | 4.0 | 1.0 | 2092 | $2,750 | $1.31 | 44d | 1 | 0.49mi |
| 95 Parrott Ave Bridgeport, CT | 4.0 | 1.0 | 1782 | $3,450 | $1.94 | 23d | 1 | 0.67mi |
| 136 Sherman St Unit 142 Bridgeport, CT | 4.0 | 1.5 | 2116 | $2,800 | $1.32 | 3d | 1 | 0.84mi |
| 2048 E Main St Bridgeport, CT | 4.0 | 2.0 | 2000 | $3,000 | $1.50 | 44d | 1 | 0.86mi |
| 64 Hickory St Bridgeport, CT | 4.0 | 3.0 | 2870 | $4,400 | $1.53 | 44d | 1 | 0.96mi |
| 259 6th St Bridgeport, CT | 4.0 | 2.0 | 2269 | $3,000 | $1.32 | 44d | 1 | 1.09mi |
| 1566 North Ave Bridgeport, CT | 5.0 | 1.0 | 2837 | $2,500 | $0.88 | 44d | 1 | 1.09mi |
| 292 Ridgefield Ave Unit 2 Bridgeport, CT | 4.0 | 1.0 | 1792 | $2,650 | $1.48 | 44d | 1 | 1.11mi |
| 41 Perth St Bridgeport, CT | 6.0 | 2.0 | 2640 | $2,200 | $0.83 | 14d | 1 | 1.38mi |
| 407 East Ave Bridgeport, CT | 5.0 | 1.0 | 1720 | $3,250 | $1.89 | 2d | 1 | 1.38mi |
| 125 High Ridge Dr Bridgeport, CT | 4.0 | 1.5 | 2160 | $3,400 | $1.57 | 2d | 1 | 1.40mi |
| 68-70 Westfield Ave Bridgeport, CT | 4.0 | 2.0 | 1470 | $3,200 | $2.18 | 14d | 1 | 1.43mi |
| 102 Hanover St Bridgeport, CT | 4.0 | 1.5 | 1552 | $2,800 | $1.80 | 14d | 1 | 1.46mi |
| 259 Laurel Ave Unit 2 Bridgeport, CT | 4.0 | 1.0 | 1432 | $3,200 | $2.23 | 3d | 1 | 1.47mi |
Listing history 27 events
-
2026-01-15status Active 770-char remark
Show marketing remark (770 chars)
Assumable financing at 4.8 percent available! Well-maintained two-family home located on Bridgeport's East Side, ideal for both investors and owner-occupants. The first-floor unit offers 1 bedroom and 1 bath with a bright, open layout. The spacious second-floor duplex features 5 bedrooms and 1 bath, providing excellent rental income potential or flexible living arrangements. Each unit is separately metered for utilities and includes gas heat, updated mechanicals, and low-maintenance vinyl siding. Private backyard and off-street parking potential. Conveniently located near Seaside Park, Downtown, Route 8, and I-95. Projected gross income up to $51,000 annually. A great opportunity to own a high-cash-flow property in one of Bridgeport's strongest rental markets!
-
2026-01-15historical 770-char remark
Show marketing remark (770 chars)
Assumable financing at 4.8 percent available! Well-maintained two-family home located on Bridgeport's East Side, ideal for both investors and owner-occupants. The first-floor unit offers 1 bedroom and 1 bath with a bright, open layout. The spacious second-floor duplex features 5 bedrooms and 1 bath, providing excellent rental income potential or flexible living arrangements. Each unit is separately metered for utilities and includes gas heat, updated mechanicals, and low-maintenance vinyl siding. Private backyard and off-street parking potential. Conveniently located near Seaside Park, Downtown, Route 8, and I-95. Projected gross income up to $51,000 annually. A great opportunity to own a high-cash-flow property in one of Bridgeport's strongest rental markets!
-
2025-10-14$479,000 Active 770-char remark
Show marketing remark (770 chars)
Assumable financing at 4.8 percent available! Well-maintained two-family home located on Bridgeport's East Side, ideal for both investors and owner-occupants. The first-floor unit offers 1 bedroom and 1 bath with a bright, open layout. The spacious second-floor duplex features 5 bedrooms and 1 bath, providing excellent rental income potential or flexible living arrangements. Each unit is separately metered for utilities and includes gas heat, updated mechanicals, and low-maintenance vinyl siding. Private backyard and off-street parking potential. Conveniently located near Seaside Park, Downtown, Route 8, and I-95. Projected gross income up to $51,000 annually. A great opportunity to own a high-cash-flow property in one of Bridgeport's strongest rental markets!
-
2020-09-29soldstatus $140,000 Closed 424-char remark
Show marketing remark (424 chars)
Investors or owner occupant wanted!! Large two family duplex style home with off-street parking. Well maintained from top to bottom. First floor currently rented for $750 per month with one bedroom, one bath and updated kitchen. Second and third floor combination with 5 beds, 2 baths and updated eat-in kitchen. Can bring in $1,350 per month. Great opportunity, don’t miss out! Property to be sold in as-is condition.
-
2020-08-31historical Under Contract - Continue to Show 424-char remark
Show marketing remark (424 chars)
Investors or owner occupant wanted!! Large two family duplex style home with off-street parking. Well maintained from top to bottom. First floor currently rented for $750 per month with one bedroom, one bath and updated kitchen. Second and third floor combination with 5 beds, 2 baths and updated eat-in kitchen. Can bring in $1,350 per month. Great opportunity, don’t miss out! Property to be sold in as-is condition.
-
2020-08-10price $170,000 424-char remark
Show marketing remark (424 chars)
Investors or owner occupant wanted!! Large two family duplex style home with off-street parking. Well maintained from top to bottom. First floor currently rented for $750 per month with one bedroom, one bath and updated kitchen. Second and third floor combination with 5 beds, 2 baths and updated eat-in kitchen. Can bring in $1,350 per month. Great opportunity, don’t miss out! Property to be sold in as-is condition.
-
2020-06-06$175,000 Active 424-char remark
Show marketing remark (424 chars)
Investors or owner occupant wanted!! Large two family duplex style home with off-street parking. Well maintained from top to bottom. First floor currently rented for $750 per month with one bedroom, one bath and updated kitchen. Second and third floor combination with 5 beds, 2 baths and updated eat-in kitchen. Can bring in $1,350 per month. Great opportunity, don’t miss out! Property to be sold in as-is condition.
-
2017-12-11historical
-
2017-12-08soldstatus $129,900
-
2017-09-05$129,900
-
2017-06-20historical
-
2017-01-30$159,000
-
2014-01-29historical
-
2013-09-13$124,900
-
2011-03-18soldstatus $35,500
-
2011-02-08$29,700
-
2008-05-29historical
-
2007-06-02$210,000
-
2007-02-14historical
-
2006-10-18historical
-
2006-08-22$254,900
-
2006-04-19$199,000
-
2005-08-01soldstatus $106,500
-
2005-05-27$109,900
-
2002-10-08soldstatus $157,000
-
2000-07-28soldstatus $45,000
-
1999-09-24$49,900
ⓘ Source: listings_history table (triggers on properties + properties_extension) + one-shot
backfill from property_details.listing_events for pre-trigger history.
Tax reassessment forecast CT · Partial reset (capped growth)
- Current annual tax
- $4,923 · $410/mo
- Projected year-2 tax
- $7,587 · $632/mo
- Expected delta
- +$2,664/yr (+$222/mo · 54.1%)
ⓘ Screening estimate from a state-policy table — verify with the county assessor before closing.
Climate risk First Street
- Flood 1/10 Low FEMA zone X (unshaded) · 0% chance over 30 yrs
- Wildfire 1/10 Low
- Heat 6/10 Major 7 d/yr ≥97°F today · 15 d/yr by 30 yrs out
- Wind 6/10 Major 41% chance of damaging wind over 30 yrs
- Air quality 4/10 Moderate 5 unhealthy d/yr today · 7 by 30 yrs out
Nearby sold comps map
Loading sold comps map…
Walkable amenities ~0.75 mi
Loading nearby amenities…
Taxation est. · year 1
- Rental income
- $51,876
- − Mortgage interest
- −$26,831
- − Property taxes
- −$4,923
- − Insurance
- −$2,395
- − Repairs & maintenance
- −$4,150
- − Management
- −$4,150
- − Depreciation
- −$13,935
- Taxable loss
- −$4,508
- Est. tax savings @ 24.0%
- +$1,082
- After-tax cash flow
- $4,603/yr
For passive investors: Depreciation is non-cash, so a rental often shows a tax loss while cash-flowing — sheltering income. Rental losses are passive: they offset passive income freely, and up to $25,000/yr can offset ordinary (W-2) income if you actively participate and your MAGI is under $100k (phasing out to $0 by $150k); unused losses carry forward. On sale, claimed depreciation is recaptured at up to 25%, and gains may owe capital-gains tax (a 1031 exchange can defer both). Figures are a year-1 estimate at your 24.0% rate — not tax advice; consult a CPA.
Schools (NCES district)
- District
- Bridgeport School District
- NCES district ID
- 0900450
- Math proficiency
- 9% ▼ -7.00%
- Reading proficiency
- 19% ▼ -10.00%
- Median HH income
- $41,507
- Composite
- 12.09/100
- National rank
- #9656
- State rank
- #151 of 153 in CT
Livability — Bridgeport
- Score
- 81/100
- State rank
- #15
- US rank
- #1374
Category grades
Schools grade is shown separately in the Schools card above.
Census & demographics
- Census place
- Bridgeport, CT
- County
- Fairfield County · 765,532 people
- City population
- 149,153
- Metro
- Bridgeport-Stamford-Norwalk, CT
- Population (ZIP)
- 12,146
- Household income
- $45,754
- Rent vs Own
- Severe rent burden
- 910.0
Population outlook (Greater Bridgeport County) Hauer SSP2
- By 2040
- 365,581
Race, ethnicity, and origin ACS 2023
- Neighborhood character
- Predominantly Hispanic (69%)
- Race & ethnicity
- Hispanic / Latino 69% Black 22% Two or more races 19% White 4% Asian 4%
- Hispanic origin (detail)
- Mexican 5% Puerto Rican 32% Cuban 1% Dominican 14%
- Common ancestry
- Hispanic 1% Russian 1% Estonian 0%
- Foreign-born
- 34% · Canada, Jamaica
- Languages at home
- 33% English-only · Spanish 56% French/Haitian/Cajun 4% Other Asian/Pacific 3%
Political lean MEDSL · Greater Bridgeport
- 2024 margin
- Strong D (+23.3) · D 60.9% · R 37.6% · Other 1.5%
- All cycles
- 2024: D+23.3
Not yet ingested
- Civics
- —
Market trends
- HPI YoY
- ▲ 18.29%
- Current HPI
- 530.5125
- Rent YoY
- ▲ 4.35%
- Metro
- Bridgeport-Stamford-Norwalk, CT
- State GDP YoY
- ▲ 1.06%
- F500 in state
- 38
Industry mix (Fortune 500 HQ in CT)
| Industry | F500 HQs | Revenue |
|---|---|---|
| Industrial Machinery | 4 | $38B |
|
||
| Insurance | 3 | $71B |
|
||
| Financial Services | 2 | $25B |
|
||
| Transportation / Logistics | 2 | $18B |
|
||
| Healthcare | 1 | $247B |
|
||
| Telecommunications | 1 | $55B |
|
||
Price history
+859.9% since first listed27 events — show timeline
- 2026-01-15 Relisted — Smart MLS
- 2026-01-15 Listing Removed — Smart MLS
- 2025-10-14 Listed $479,000 Smart MLS
- 2020-09-29 Sold (MLS) $140,000 Smart MLS
- 2020-08-31 Contingent — Smart MLS
- 2020-08-10 Price Changed $170,000 Smart MLS
- 2020-06-06 Listed $175,000 Smart MLS
- 2017-12-11 Listing Removed — Smart MLS
- 2017-12-08 Sold (MLS) $129,900 Smart MLS
- 2017-09-05 Listed $129,900 Smart MLS
- 2017-06-20 Listing Removed — Smart MLS
- 2017-01-30 Listed $159,000 Smart MLS
- 2014-01-29 Listing Removed — Smart MLS
- 2013-09-13 Listed $124,900 Smart MLS
- 2011-03-18 Sold (MLS) $35,500 Smart MLS
- 2011-02-08 Listed $29,700 Smart MLS
- 2008-05-29 Listing Removed — Smart MLS
- 2007-06-02 Listed $210,000 Smart MLS
- 2007-02-14 Listing Removed — Smart MLS
- 2006-10-18 Listing Removed — Smart MLS
- 2006-08-22 Listed $254,900 Smart MLS
- 2006-04-19 Listed $199,000 Smart MLS
- 2005-08-01 Sold (MLS) $106,500 Smart MLS
- 2005-05-27 Listed $109,900 Smart MLS
- 2002-10-08 Sold (Public Records) $157,000 Public Records
- 2000-07-28 Sold (MLS) $45,000 Smart MLS
- 1999-09-24 Listed $49,900 Smart MLS
Property tax history
-0.9%/yrLatest (2023): $4,923 · +0.0% YoY. Source: county tax records.
Cash-flow waterfall
monthlySold comps — $/sqft
last 12 mo · ≤1 miLoading sold comps…