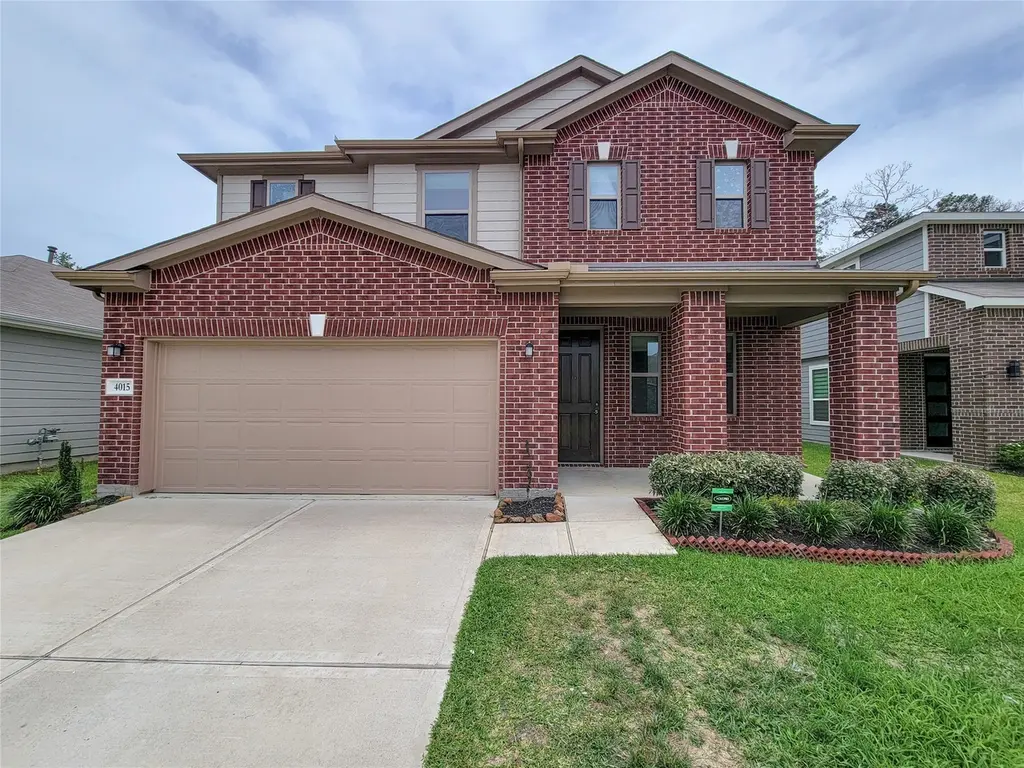
4015 Mossy Banks Ln · Houston, TX
Flood risk 8/10 · Major
- FEMA flood zone
- X (unshaded)
- Chance of flooding over 30 yrs
- 0.99%
- Est. flood insurance / yr
- $507 – $1,088
Fire risk 2/10 · Minimal
- Est. fire insurance / yr
- $1,222 – $2,270
Heat risk 8/10 · Major
- Hot days now (above 111°F)
- 7 days/yr
- Hot days in 30 yrs
- 20 days/yr
Wind risk 9/10 · Severe
- Chance of severe wind over 30 yrs
- 99.0%
Air-quality risk 3/10 · Minor
- Unhealthy air days now
- 3 days/yr
- Unhealthy air days in 30 yrs
- 3 days/yr
Risk factors via First Street. Map © Google.
Why this score? — see what drove the B- grade
The composite is a weighted blend of 9 inputs, each scored 0–100. Each bar is that input's sub-score; the figure is the points it added to the 100-point composite (weight × sub-score).
- Cash flow +30.0/30.0
- 1% rule +10.0/10.0
- DSCR +10.0/10.0
- Condition / age +4.0/5.0
- Appreciation +3.9/10.0
- Livability +3.7/5.0
- Rent growth +2.5/5.0
- Schools +2.0/10.0
- ARV discount +0.0/15.0
$379,900
🖨 Deal sheet 📄 Offer letter ✓ Due diligence
Listing remarks MLS
Welcome to Cypress Creek Landing! Three-year-old home with upgrades galore! This spacious 2888 sq ft property features 5 beds, 3.5 baths, a game room, and a stylish kitchen with quartz counters, island, and stainless-steel appliances. The first-floor owner's retreat boasts a large walk-in closet and a luxurious bath with dual vanity sinks. Enjoy the backyard with an extended cover patio and gas connection for grilling. Additional features include a JR Suite, wrought iron staircase, porcelain tile floors, and a park with a playground in the community. Don't miss out on this beautiful home at 4015 Mossy Banks in Spring ISD!
Key facts
- Upgrades galore
- Quartz countertops
- Stylish kitchen
Tags
Neighborhood map
What this means for you Summary
Snapshot
- This is a 5-bed/3.5-bath single-family listed at $380k. Condition is rated good.
Deal economics
- At list price, monthly cash flow is $2k ($29k/yr) — positive.
- The deal already cash-flows at list — no discount required.
- Meets the 1% rule at list price ($7k rent vs $380k).
- Cap rate 14.3% vs local median 3.2% in Houston — top-decile yield for the area; either an underpriced asset or a hidden risk that comps aren't pricing in. Stress-test before assuming the spread holds.
Location & tenants
- Location reads 74/100 on livability (#184 in TX, #4,771 nationally) — a middle-class / working-renter tenant base. Strengths: amenities A+, cost of living A+, housing A+; Watch: schools D, crime F.
- Spring ISD (suburban): math 19% / reading 26% proficiency, ranked #730 of 826 in TX (top 88%) — low school quality limits family demand, transient renter base, plan for 1-2y turnover; 66% free/reduced lunch — lower-income household profile, screen leases tightly.
- Market conditions: 117 active listings in the ZIP; 3 comparable units currently listed for rent nearby; rentals at typical pace (median 22d on market — plan ~3-4 weeks tenant-placement turnaround); 29,883 units permitted in Harris County in 2024 (8,621 in 5+ unit buildings).
Forward outlook
- Local home prices are declining (-2.1%/yr); year-one equity from $3k of loan paydown is wiped out by about $8k of value loss. Plan a longer hold.
- Harris County population projected at +47% by 2050 — long-run rental-demand tailwind backs the buy-and-hold thesis.
- At projected returns (-2.1% appreciation + 3.0% rent growth), your $106k cash investment doubles in ~4 years — after that, you're playing with house money.
Negotiation context
- Only 4 days on market — expect competitive offers; lowballing is unlikely to land.
- 4 sale attempts since 3y ago; this cycle's ask has dropped $35k (8%) from the opening price — seller is motivated, your offer sets the floor, not the list.
Risks & watch-outs
- Watch-outs: flood insurance adds $66/mo.
- Climate carrying-cost: severe flood risk; severe wind risk, 99% chance of damaging wind over 30y; extreme-heat days projected 7→20/yr by 2055 (HVAC capex compounding) — expect insurance premiums to compound above CPI over the hold.
Questions for the listing agent
- What's the actual annual flood-insurance premium (NFIP or private), and is the property in a SFHA with mandatory coverage?
- What does the HOA fee cover, when was the last increase, and are there any pending special assessments or reserve-fund shortfalls?
- Is there a deadline driving the sale (1031 exchange, divorce, estate, relocation)? That informs how much negotiation room exists.
- Schools are D-rated, which usually means shorter tenancies and higher turnover. Who's the typical renter profile here, and what's been the actual vacancy rate?
- Crime grade is F in this area — have there been break-ins, vandalism, or insurance claims at this property in the last 3 years? What carrier currently insures it and at what premium?
- What's the average days-on-market for RENTAL listings here right now (not sales)? A rising rental-DOM trend means longer vacancies and softer asking-rent achievability than the comps imply.
- What's the recent tenant-quality profile in this submarket — average credit score on applications, eviction rate, late-payment / NSF rate, and stable-employment percentage? A property-management company in the area should have these aggregated.
- How much new for-sale + rental construction is in the pipeline within 1–3 miles? Heavy new supply typically softens prices + rents 12–24 months out; constrained supply supports both.
Investment metrics
- 1% rule
- 1.83% ✓
- Cap rate
- 14.26%
- Cash-on-cash
- 28.47%
- DSCR
- 2.27
- GRM
- 4.6
CMA / ARV
- ARV (median comp)
- $303,999
- List price
- $379,900
- Delta
- 29.90%
- Verdict
- OVERPRICED
- Comps
- 20 within 1.0 mi
Show comp detail 12 sales within ~0.75 mi
| Address | Dist | Beds/Ba | Sqft | Sold | Price | $/sf | Match |
|---|---|---|---|---|---|---|---|
| 15515 San Milo Dr | 0.22mi | 4/3.5 (-1) | 3,056 (+6%) | 2mo | $345,000 | $113 | 74 |
| 15406 Falling Creek Dr | 0.25mi | 4/2.5 (-1) | 2,950 (+2%) | 3mo | $315,000 | $107 | 73 |
| 4022 Streambed Trl | 0.23mi | 4/2.5 (-1) | 2,792 (-4%) | 2mo | $325,000 | $116 | 72 |
| 3614 Shanemoss Ct | 0.43mi | 4/2.5 (-1) | 2,852 (-2%) | 2mo | $299,990 | $105 | 67 |
| 4218 Bayglen Ct | 0.46mi | 4/3.5 (-1) | 3,042 (+5%) | 2mo | $384,786 | $126 | 63 |
| 4418 Windmill Run Dr | 0.54mi | 4/3.0 (-1) | 2,760 (-5%) | 0mo | $332,000 | $120 | 60 |
| 15727 Misty Hollow Dr | 0.51mi | 4/3.5 (-1) | 3,119 (+8%) | 1mo | $359,000 | $115 | 57 |
| 15007 Walters Rd | 0.53mi | 4/2.5 (-1) | 2,730 (-6%) | 1mo | $279,900 | $103 | 56 |
| 15302 Walters Rd | 0.52mi | 4/2.5 (-1) | 3,059 (+6%) | 4mo | $215,000 | $70 | 54 |
| 4215 False Cypress Ln | 0.54mi | 4/2.5 (-1) | 2,596 (-10%) | 3mo | $285,000 | $110 | 46 |
| 14543 Overland Hollow Dr | 0.59mi | 4/3.0 (-1) | 2,606 (-10%) | 5mo | $334,900 | $129 | 45 |
| 3502 Stoney Oak Dr | 0.68mi | 4/2.5 (-1) | 2,630 (-9%) | 6mo | $350,000 | $133 | 39 |
Match score weights: distance 35% · size 25% · config 20% · recency 20%. Top-matched comps best support the ARV.
Projected returns pro-forma
-2.14% appreciation · 3.0% rent growth · sell at horizon
- IRR
- 23.8%
- Equity multiple
- 2.03×
- Total profit
- $109,197
- Equity at exit
- $71,442
- IRR
- 30.5%
- Equity multiple
- 3.92×
- Total profit
- $310,353
- Equity at exit
- $58,837
Cash invested: $106,372 (down + closing). Projections, not guarantees.
Landlord ↔ Tenant lean methodology
- Overall (STATE)
- 87 Strongly Landlord-Friendly
- State Texas
- 87 Strongly Landlord-Friendly · R+5
- County
- — inherits STATE
- City
- — inherits STATE
ZIP-level market 77068
- Home prices YoY
- -1.0%
- Active inventory
- 117
- Price-to-rent
- 4.6×
Monthly cashflow live
- Estimated rent
- $6,946 medium interval (Pro) →
- Mortgage (P&I)
- −$1,992
- Tax from tax record
- −$760 /mo · $9,116/yr
- Insurance
- −$158
- Flood insurance flood zone
- −$66 /mo · $798/yr
- HOA
- −$54
- Vacancy / Maint / Mgmt
- −$1,459
- Net cashflow
- $2,457
Break-even live
UW: 25.0% down · 7.5% · 30yr · 1.5% tax · 5.0% vac · 8.0% maint · 8.0% mgmt
Financing live
Cash to close
- Down payment
- $94,975
- Closing costs
- $11,397
- Reserves months
- —
- Total cash needed
- —
Loan-product check · same deal, 3 products live
Conventional
25% down · 7.5% · 30yr
- Down + closing
- —
- Monthly P&I
- —
- Monthly cashflow
- —
- DSCR
- —
- Eligible?
- —
Personal DTI + credit; lowest rate.
DSCR
20% down · 8.5% · 30yr
- Down + closing
- —
- Monthly P&I
- —
- Monthly cashflow
- —
- DSCR
- —
- Eligible?
- —
No personal income docs; deal must DSCR.
Hard money
10% down · 12.0% · 12mo
- Down + closing
- —
- Monthly P&I
- —
- Monthly cashflow
- —
- DSCR
- —
- Eligible?
- —
Short-term bridge; refi at stabilization.
Rent comps 3 comps
| Address | Beds | Baths | Sqft | Rent | $/sqft | DOM | Units | Dist |
|---|---|---|---|---|---|---|---|---|
| 4622 Falling Sun Dr Houston, TX | 4.0 | 3.0 | 2485 | $2,500 | $1.01 | 43d | 1 | 0.65mi |
| 5135 Westerham Pl Unit 1262307P Houston, TX | 5.0 | 3.5 | 3358 | $17,582 | $5.24 | 21d | 1 | 1.16mi |
| 6302 Laver Love Dr Spring, TX | 4.0 | 3.5 | 3553 | $3,549 | $1.00 | 5d | 1 | 1.34mi |
HOA detail
- Monthly dues
- $54 · $648/yr
- Likely covers
- gas
Listing history 30 events
-
2026-06-18days on market $379,900 Active 4 DOM
-
2026-06-17days on market $379,900 Active 3 DOM
-
2026-06-16days on market $379,900 Active 2 DOM
-
2026-06-15remarks 638-char remark
-
2026-06-15pricedays on market $379,900 Active 1 DOM
-
2026-06-13days on market $394,900 Active 136 DOM
-
2026-06-13days on market $394,900 Active 135 DOM
-
2026-06-09days on market $394,900 Active 132 DOM
-
2026-06-08days on market $394,900 Active 131 DOM
-
2026-06-07days on market $394,900 Active 130 DOM
-
2026-06-04days on market $394,900 Active 127 DOM
-
2026-06-03days on market $394,900 Active 126 DOM
-
2026-06-02days on market $394,900 Active 125 DOM
-
2026-06-01days on market $394,900 Active 124 DOM
-
2026-05-31days on market $394,900 Active 123 DOM
-
2026-05-05price $394,900 629-char remark
Show marketing remark (629 chars)
Welcome to Cypress Creek Landing! Three-year-old home with upgrades galore! This spacious 2888 sq ft property features 5 beds, 3.5 baths, a game room, and a stylish kitchen with quartz counters, island, and stainless-steel appliances. The first-floor owner's retreat boasts a large walk-in closet and a luxurious bath with dual vanity sinks. Enjoy the backyard with an extended cover patio and gas connection for grilling. Additional features include a JR Suite, wrought iron staircase, porcelain tile floors, and a park with a playground in the community. Don't miss out on this beautiful home at 4015 Mossy Banks in Spring ISD!
-
2026-03-04price $399,900 629-char remark
Show marketing remark (629 chars)
Welcome to Cypress Creek Landing! Three-year-old home with upgrades galore! This spacious 2888 sq ft property features 5 beds, 3.5 baths, a game room, and a stylish kitchen with quartz counters, island, and stainless-steel appliances. The first-floor owner's retreat boasts a large walk-in closet and a luxurious bath with dual vanity sinks. Enjoy the backyard with an extended cover patio and gas connection for grilling. Additional features include a JR Suite, wrought iron staircase, porcelain tile floors, and a park with a playground in the community. Don't miss out on this beautiful home at 4015 Mossy Banks in Spring ISD!
-
2026-01-28$414,990 Active 629-char remark
Show marketing remark (629 chars)
Welcome to Cypress Creek Landing! Three-year-old home with upgrades galore! This spacious 2888 sq ft property features 5 beds, 3.5 baths, a game room, and a stylish kitchen with quartz counters, island, and stainless-steel appliances. The first-floor owner's retreat boasts a large walk-in closet and a luxurious bath with dual vanity sinks. Enjoy the backyard with an extended cover patio and gas connection for grilling. Additional features include a JR Suite, wrought iron staircase, porcelain tile floors, and a park with a playground in the community. Don't miss out on this beautiful home at 4015 Mossy Banks in Spring ISD!
-
2025-11-08historical
-
2025-09-17price $421,000
-
2025-08-18price $425,000
-
2025-07-18$435,000 Active
-
2025-07-17historical
-
2025-06-10price $439,500
-
2025-05-13$449,900 Active
-
2025-05-10historical
-
2023-03-10soldstatus
-
2023-03-09soldstatus Sold
-
2023-03-05status Pending
-
2023-01-20$450,000 Active
ⓘ Source: listings_history table (triggers on properties + properties_extension) + one-shot
backfill from property_details.listing_events for pre-trigger history.
Tax reassessment forecast TX · Resets to sale price
- Current annual tax
- $9,116 · $760/mo
- Projected year-2 tax
- $9,116 · $760/mo
- Expected delta
- $0/yr ($0/mo · 0.0%)
ⓘ Screening estimate from a state-policy table — verify with the county assessor before closing.
Climate risk First Street
- Flood 8/10 Severe FEMA zone X (unshaded) · 99% chance over 30 yrs
- Wildfire 2/10 Low
- Heat 8/10 Severe 7 d/yr ≥111°F today · 20 d/yr by 30 yrs out
- Wind 9/10 Extreme 99% chance of damaging wind over 30 yrs
- Air quality 3/10 Moderate 3 unhealthy d/yr today · 3 by 30 yrs out
Nearby sold comps map
Loading sold comps map…
Walkable amenities ~0.75 mi
Loading nearby amenities…
Taxation est. · year 1
- Rental income
- $83,358
- − Mortgage interest
- −$21,280
- − Property taxes
- −$9,116
- − Insurance
- −$2,697
- − Repairs & maintenance
- −$6,669
- − Management
- −$6,669
- − HOA
- −$648
- − Depreciation
- −$11,052
- Taxable income
- $25,228
- Est. tax owed @ 24.0%
- −$6,055
- After-tax cash flow
- $23,430/yr
For passive investors: Depreciation is non-cash, so a rental often shows a tax loss while cash-flowing — sheltering income. Rental losses are passive: they offset passive income freely, and up to $25,000/yr can offset ordinary (W-2) income if you actively participate and your MAGI is under $100k (phasing out to $0 by $150k); unused losses carry forward. On sale, claimed depreciation is recaptured at up to 25%, and gains may owe capital-gains tax (a 1031 exchange can defer both). Figures are a year-1 estimate at your 24.0% rate — not tax advice; consult a CPA.
Condition & rehab AI · 12 photos
This three-year-old home in Cypress Creek Landing is in good condition with recent upgrades and a well-maintained exterior. It's move-in ready with a good ROI for both resale and rental.
Value-add opportunities
- Resale Paint exterior trim — Enhances curb appeal
- Rental Clean gutters — Keeps home in good condition
Renovation cost estimate screening
Value-add ROI direction
- Resale Paint exterior trim — Enhances curb appeal ↑
- Rental Clean gutters — Keeps home in good condition ↑
ⓘ Cost ranges are severity-bucket heuristics (US national rule-of-thumb). Get contractor quotes + a written scope before underwriting a rehab budget.
Schools (NCES district)
- District
- Spring ISD
- NCES district ID
- 4841220
- Math proficiency
- 19% ▼ -13.00%
- Reading proficiency
- 26% ▼ -6.00%
- Median HH income
- $51,584
- Composite
- 20.12/100
- National rank
- #8643
- State rank
- #730 of 826 in TX
Livability — Houston
- Score
- 74/100
- State rank
- #184
- US rank
- #4771
Category grades
Schools grade is shown separately in the Schools card above.
Census & demographics
- City population
- 3,226,434
- Population (ZIP)
- 12,289
Population outlook (Harris County) Hauer SSP2
- Today (2025)
- 5,571,493 people
- By 2030
- 6,089,821 · +9.3%
- By 2040
- 7,142,806 · +28.2%
- By 2050
- 8,185,864 · +46.9%
- By 2075
- 10,574,329 · +89.8%
- By 2100
- 12,109,958 · +117.4%
Race, ethnicity, and origin ACS 2023
- Neighborhood character
- Highly diverse neighborhood (Simpson 0.72)
- Race & ethnicity
- Hispanic / Latino 35% Black 31% White 23% Two or more races 11% Asian 6% Native American 1%
- Hispanic origin (detail)
- Mexican 27%
- Common ancestry
- Scandinavian 2% Romanian 1% Serbian 1%
- Foreign-born
- 21% · Canada, Vietnam, China
- Languages at home
- 65% English-only · Spanish 28% Vietnamese 4% Chinese 1%
Political lean MEDSL · Harris
- 2024 margin
- Lean D (+5.5) · D 52.0% · R 46.4% · Other 1.6%
- 2008→2024 swing
- +3.9pp toward D · 2008: 1.6pp · 2024: 5.5pp
- All cycles
- 2024: D+5.5 2020: D+13.3 2016: D+12.4 2012: D+0.1 2008: D+1.6
Not yet ingested
- Civics
- —
Market trends
- HPI YoY
- ▼ -2.14%
- Current HPI
- 206.5475
- Rent YoY
- —
- Metro
- —
- State GDP YoY
- ▲ 3.95%
- F500 in state
- 110
Industry mix (Fortune 500 HQ in TX)
| Industry | F500 HQs | Revenue |
|---|---|---|
| Energy | 16 | $1,198B |
|
||
| Technology | 5 | $198B |
|
||
| Engineering / Construction | 4 | $72B |
|
||
| Energy Services | 3 | $60B |
|
||
| Utilities | 3 | $41B |
|
||
| Healthcare | 2 | $330B |
|
||
Price history
-12.2% since first listed15 events — show timeline
- 2026-05-05 Price Changed $394,900 HARMLS
- 2026-03-04 Price Changed $399,900 HARMLS
- 2026-01-28 Listed $414,990 HARMLS
- 2025-11-08 Listing Removed — HARMLS
- 2025-09-17 Price Changed $421,000 HARMLS
- 2025-08-18 Price Changed $425,000 HARMLS
- 2025-07-18 Listed $435,000 HARMLS
- 2025-07-17 Listing Removed — HARMLS
- 2025-06-10 Price Changed $439,500 HARMLS
- 2025-05-13 Listed $449,900 HARMLS
- 2025-05-10 Coming Soon — HARMLS
- 2023-03-10 Sold (Public Records) — Public Records
- 2023-03-09 Sold (MLS) — HARMLS
- 2023-03-05 Pending — HARMLS
- 2023-01-20 Listed $450,000 HARMLS
Property tax history
+143.3%/yrLatest (2025): $9,116 · +2.9% YoY. Source: county tax records.
Cash-flow waterfall
monthlySold comps — $/sqft
last 12 mo · ≤1 miLoading sold comps…