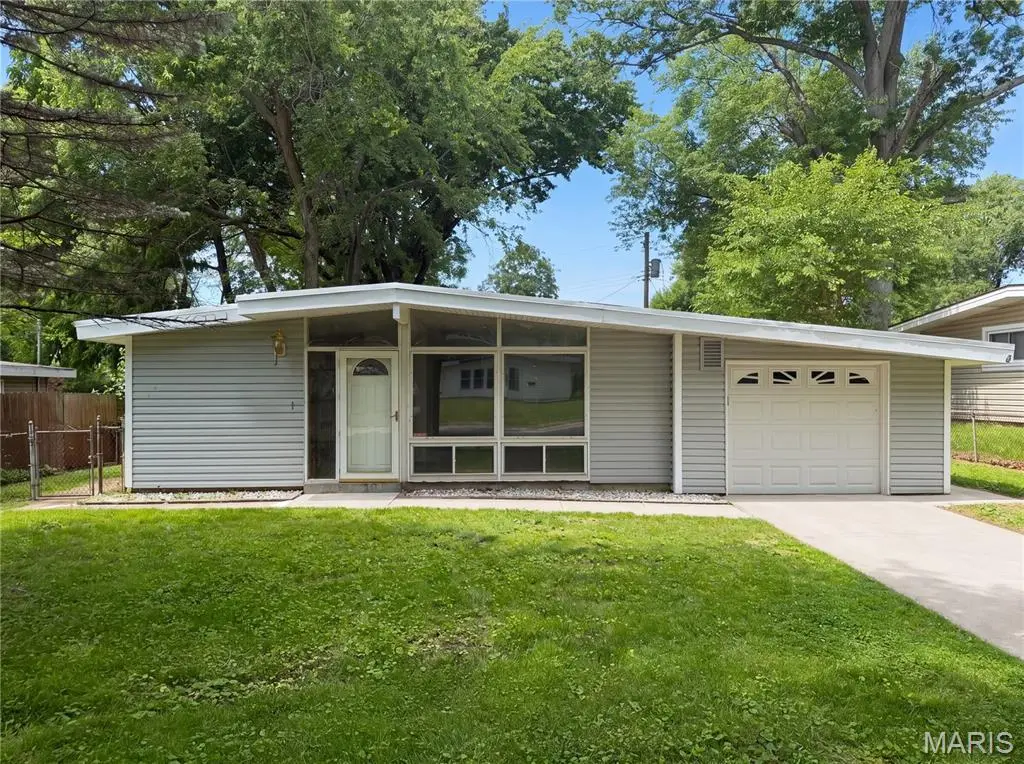
1015 Robinwood Dr · Florissant, MO
Flood risk 1/10 · Minimal
- FEMA flood zone
- X (unshaded)
- Chance of flooding over 30 yrs
- 0.0%
- Est. flood insurance / yr
- $507 – $1,088
Fire risk 1/10 · Minimal
- Est. fire insurance / yr
- $1,054 – $1,958
Heat risk 4/10 · Minor
- Hot days now (above 106°F)
- 7 days/yr
- Hot days in 30 yrs
- 21 days/yr
Wind risk 2/10 · Minimal
- Chance of severe wind over 30 yrs
- 1.0%
Air-quality risk 3/10 · Minor
- Unhealthy air days now
- 3 days/yr
- Unhealthy air days in 30 yrs
- 5 days/yr
Risk factors via First Street. Map © Google.
Why this score? — see what drove the C+ grade
The composite is a weighted blend of 9 inputs, each scored 0–100. Each bar is that input's sub-score; the figure is the points it added to the 100-point composite (weight × sub-score).
- Cash flow +21.0/30.0
- ARV discount +10.5/15.0
- Appreciation +10.0/10.0
- DSCR +6.7/10.0
- 1% rule +4.9/10.0
- Rent growth +4.4/5.0
- Livability +3.7/5.0
- Condition / age +2.5/5.0
- Schools +1.2/10.0
$165,000
🖨 Deal sheet (PDF) 📄 Offer letter ✓ Due diligence
Listing remarks MLS
Ranch style home with two bedrooms and one bath with approximately 1176 square feet living area. Attached garage. Great starter home or investment opportunity.
Key facts
- Storage shed
- Outdoor patio area
- 7,858 sq ft lot
Tags
Property features AI
Finance
- Other: Home warranty included; Seller open to concessions
Exterior
- Parking: Detached garage (1 car)
- Utilities: Public water; Public sewer; Electric service (other)
- Home design: Single-family residence; One level
- Construction: Built with other/unspecified construction materials
- Exterior features: Private ownership; Lot with non-standard dimensions (approx. 60 x 130); Lot described as 'Other' features
Interior
- Bedrooms: 3 bedrooms on the main level
- Bathrooms: 1 full bathroom on the main level
- Heating & cooling: Forced air heating (natural gas); Electric cooling
- Interior features: Concrete basement
Neighborhood map
What this means for you Summary
Snapshot
- This is a 3-bed/1.0-bath single-family listed at $165k.
Deal economics
- At list price, monthly cash flow is $233 ($3k/yr) — positive.
- The deal already cash-flows at list — no discount required.
- To meet the 1% rule (rent ≥ 1% of price), the offer needs to be $163k (1.2% below list).
- Recommended offer: $163k (1.2% below list) — sets the bar for 1% rule.
- Cap rate 8.0% vs local median 6.3% in Florissant — meaningfully above typical; check what's discounted (condition, days-on-market, listing class) to confirm the premium yield is real.
Location & tenants
- Location reads 73/100 on livability (#82 in MO) — a middle-class / working-renter tenant base. Strengths: cost of living A+, housing A+, health & safety B+; Watch: crime C-, amenities D+, commute F.
- Ferguson-Florissant R-II (suburban): math 7% / reading 20% proficiency, ranked #311 of 324 in MO (top 96%) — low school quality limits family demand, transient renter base, plan for 1-2y turnover; 70% free/reduced lunch — lower-income household profile, screen leases tightly.
- Zoned schools: Robinwood Elementary (math 11% / reading 25%, grade F, #962 of 1,115 statewide, top 86%, 312 students, 99% FRL); Mccluer North High (math 5% / reading 28%, grade F, #487 of 521 statewide, top 93%, 1,136 students, 100% FRL) — zoned schools average 99% FRL vs 70% district-wide (30 pts higher); higher-poverty schools than district average — tighter screening recommended.
- Market conditions: Rents rising fast (+7.5%/yr); 218 active listings in the ZIP; 40 comparable units currently listed for rent nearby; rentals at typical pace (median 25d on market — plan ~3-4 weeks tenant-placement turnaround); 920 units permitted in St. Louis County in 2024 (250 in 5+ unit buildings).
Forward outlook
- In year one you build about $18k of equity ($1k loan paydown + $16k appreciation (10.0% local appreciation)).
- At projected returns (10.0% appreciation + 7.5% rent growth), your $46k cash investment doubles in ~3 years — after that, you're playing with house money.
- By year 3, paydown + projected appreciation supports a ~$45k cash-out refi (75% LTV) — recoverable capital for the next deal without selling this one.
Negotiation context
- Only 9 days on market — expect competitive offers; lowballing is unlikely to land.
- 2 sale attempts since 9y ago with the ask held roughly flat each time — persistent listings suggest the price (not the market) is what's stuck; bring a comps-based counter.
- Current owner paid $100k; list at $165k implies a 65% gain — meaningful room to come down on a strong offer.
Risks & watch-outs
- Watch-outs: built in 1955 — expect roof / HVAC / electrical / plumbing capex.
Questions for the listing agent
- Built in 1955 — when were the roof, HVAC, electrical panel, plumbing, and water heater last replaced?
- Is there a deadline driving the sale (1031 exchange, divorce, estate, relocation)? That informs how much negotiation room exists.
- Schools are D-rated, which usually means shorter tenancies and higher turnover. Who's the typical renter profile here, and what's been the actual vacancy rate?
- What's the average days-on-market for RENTAL listings here right now (not sales)? A rising rental-DOM trend means longer vacancies and softer asking-rent achievability than the comps imply.
- What's the recent tenant-quality profile in this submarket — average credit score on applications, eviction rate, late-payment / NSF rate, and stable-employment percentage? A property-management company in the area should have these aggregated.
- How much new for-sale + rental construction is in the pipeline within 1–3 miles? Heavy new supply typically softens prices + rents 12–24 months out; constrained supply supports both.
Investment metrics
- 1% rule
- 0.99% ✗
- Cap rate
- 7.98%
- Cash-on-cash
- 6.04%
- DSCR
- 1.27
- GRM
- 8.4
CMA / ARV
- ARV (on-the-fly)
- $176,792
- Comps found
- 12
Show comp detail 12 sales within ~0.75 mi
| Address | Dist | Beds/Ba | Sqft | Sold | Price | $/sf | Match |
|---|---|---|---|---|---|---|---|
| 815 Robinwood Dr | 0.11mi | 3/1.0 | 1,148 (0%) | 2mo | $179,900 | $157 | 93 |
| 2740 Holiday Hill Dr | 0.20mi | 3/1.0 | 1,107 (-4%) | 3mo | $99,900 | $90 | 82 |
| 205 Lynn Meadows Ln | 0.27mi | 3/1.0 | 1,104 (-4%) | 1mo | $135,000 | $122 | 80 |
| 260 Saint Edward Ln | 0.23mi | 3/2.0 | 1,092 (-5%) | 3mo | $170,000 | $156 | 74 |
| 1065 Cheyenne Dr | 0.20mi | 3/2.0 | 1,040 (-9%) | 3mo | $172,000 | $165 | 68 |
| 3130 Kingsley Dr | 0.52mi | 3/2.0 | 1,226 (+7%) | 3mo | $205,000 | $167 | 58 |
| 940 Rogers Ln | 0.39mi | 3/2.0 | 1,309 (+14%) | 1mo | $150,000 | $115 | 54 |
| 4 Duchesne Dr | 0.74mi | 3/1.0 | 1,232 (+7%) | 1mo | $159,900 | $130 | 53 |
| 4 Fremont Ct | 0.36mi | 2/2.0 (-1) | 1,304 (+14%) | 1mo | $135,000 | $104 | 51 |
| 1145 S Waterford Dr | 0.45mi | 3/2.0 | 984 (-14%) | 4mo | $165,000 | $168 | 48 |
| 1020 Belmont Ter | 0.69mi | 3/1.5 | 1,040 (-9%) | 4mo | $159,900 | $154 | 47 |
| 3135 Kingsley Dr | 0.53mi | 3/2.0 | 1,310 (+14%) | 3mo | $194,000 | $148 | 46 |
Match score weights: distance 35% · size 25% · config 20% · recency 20%. Top-matched comps best support the ARV.
Projected returns pro-forma
10.0% appreciation · 7.51% rent growth · sell at horizon
- IRR
- 30.4%
- Equity multiple
- 3.43×
- Total profit
- $112,386
- Equity at exit
- $148,645
- IRR
- 27.7%
- Equity multiple
- 8.32×
- Total profit
- $338,053
- Equity at exit
- $320,559
Cash invested: $46,200 (down + closing). Projections, not guarantees.
Landlord ↔ Tenant lean methodology
- Overall (STATE)
- 81 Strongly Landlord-Friendly
- State Missouri
- 81 Strongly Landlord-Friendly · R+10
- County
- — inherits STATE
- City
- — inherits STATE
ZIP-level market 63033
- Home prices YoY
- 2.5%
- Rents YoY
- 7.5%
- Active inventory
- 218
- Price-to-rent
- 8.4×
Monthly cashflow live
- Estimated rent
- $1,630 high interval (Pro) →
- Mortgage (P&I)
- −$865
- Tax from tax record
- −$121 /mo · $1,457/yr
- Insurance
- −$69
- HOA
- −$0
- Vacancy / Maint / Mgmt
- −$342
- Net cashflow
- $233
Break-even live
Sensitivity live
| Price | -10% $326 | -5% $279 | +0% $233 | +5% $186 | +10% $139 |
|---|---|---|---|---|---|
| Rent | -10% $104 | -5% $168 | +0% $233 | +5% $297 | +10% $361 |
| Rate | -1.0pp $316 | -0.5pp $275 | base $233 | +0.5pp $190 | +1.0pp $146 |
UW: 25.0% down · 7.5% · 30yr · 1.5% tax · 5.0% vac · 8.0% maint · 8.0% mgmt
Financing live
Cash to close
- Down payment
- $41,250
- Closing costs
- $4,950
- Reserves months
- —
- Total cash needed
- —
Loan-product check · same deal, 3 products live
Conventional
25% down · 7.5% · 30yr
- Down + closing
- —
- Monthly P&I
- —
- Monthly cashflow
- —
- DSCR
- —
- Eligible?
- —
Personal DTI + credit; lowest rate.
DSCR
20% down · 8.5% · 30yr
- Down + closing
- —
- Monthly P&I
- —
- Monthly cashflow
- —
- DSCR
- —
- Eligible?
- —
No personal income docs; deal must DSCR.
Hard money
10% down · 12.0% · 12mo
- Down + closing
- —
- Monthly P&I
- —
- Monthly cashflow
- —
- DSCR
- —
- Eligible?
- —
Short-term bridge; refi at stabilization.
Rent comps 40 comps
| Address | Beds | Baths | Sqft | Rent | $/sqft | DOM | Units | Dist |
|---|---|---|---|---|---|---|---|---|
| 790 Pebble Ln Florissant, MO | 3.0 | 2.0 | 1242 | $1,795 | $1.45 | 24d | 1 | 0.10mi |
| 765 Bobbins Ln Florissant, MO | 3.0 | 1.0 | 1107 | $1,450 | $1.31 | 44d | 1 | 0.12mi |
| 100 Taney Dr Florissant, MO | 3.0 | 1.0 | 1148 | $1,495 | $1.30 | 22d | 1 | 0.15mi |
| 410 Ridge Dr Florissant, MO | 3.0 | 2.0 | 1226 | $1,650 | $1.35 | 18d | 1 | 0.26mi |
| 297 Saint Eugene Ln Florissant, MO | 2.0 | 1.0 | 1100 | $1,100 | $1.00 | 44d | 1 | 0.35mi |
| 560 Jamaica Pl Florissant, MO | 3.0 | 2.0 | 1350 | $1,653 | $1.22 | 44d | 1 | 0.40mi |
| 50 Lynn Meadows Ln Florissant, MO | 3.0 | 1.0 | 864 | $1,450 | $1.68 | 24d | 1 | 0.43mi |
| 20 Saint Benedict Ln Florissant, MO | 3.0 | 1.5 | 1092 | $1,525 | $1.40 | 21d | 1 | 0.49mi |
| 1600 Washington St Florissant, MO | 3.0 | 1.5 | 1095 | $1,250 | $1.14 | 21d | 1 | 0.52mi |
| 1050 Ozment Dr Florissant, MO | 3.0 | 2.0 | 984 | $1,525 | $1.55 | 44d | 1 | 0.54mi |
| 1545 Washington St Florissant, MO | 3.0 | 1.5 | 1337 | $2,055 | $1.54 | 3d | 1 | 0.54mi |
| 1095 Ozment Dr Florissant, MO | 3.0 | 2.0 | 984 | $1,461 | $1.48 | 24d | 1 | 0.56mi |
| 1725 Saint Catherine St Florissant, MO | 3.0 | 1.0 | 1107 | $1,800 | $1.63 | 15d | 1 | 0.57mi |
| 1465 W Duchesne Dr Florissant, MO | 3.0 | 1.0 | 896 | $1,500 | $1.67 | 44d | 1 | 0.69mi |
| 1250 S New Florissant Rd Florissant, MO | 2.0 | 1.0 | 1150 | $1,500 | $1.30 | 15d | 1 | 0.74mi |
| 1180 S New Florissant Rd Florissant, MO | 3.0 | 1.0 | 925 | $1,225 | $1.32 | 24d | 1 | 0.75mi |
| 1670 Arundel Dr Florissant, MO | 3.0 | 2.0 | 1012 | $1,450 | $1.43 | 24d | 1 | 0.75mi |
| 1280 Saint Catherine St Florissant, MO | 3.0 | 1.0 | 1274 | $1,600 | $1.26 | 15d | 1 | 0.79mi |
| 5 Santa Cruz Dr Florissant, MO | 2.0 | 1.0 | 1410 | $1,411 | $1.00 | 17d | 1 | 0.91mi |
| 1502 Summer Run Dr #108 Florissant, MO | 2.0 | 1.5 | 922 | $1,200 | $1.30 | 24d | 1 | 0.93mi |
| 17 Valley Dr Florissant, MO | 2.0 | 2.0 | 1356 | $1,525 | $1.12 | 44d | 1 | 0.95mi |
| 1004 N New Florissant Rd Florissant, MO | 2.0 | 1.0 | 719 | $1,375 | $1.91 | 24d | 1 | 0.95mi |
| 24 Barto Dr Saint Louis, MO | 3.0 | 1.0 | 864 | $1,400 | $1.62 | 44d | 1 | 0.98mi |
| 1045 N New Florissant Rd Florissant, MO | 2.0 | 1.0 | 783 | $1,250 | $1.60 | 15d | 1 | 0.99mi |
| 3585 Pershall Rd Ferguson, MO | 2.0 | 2.0 | 1388 | $1,400 | $1.01 | 44d | 1 | 1.01mi |
| 1536 Springlet Ct #31 Florissant, MO | 3.0 | 2.5 | 1161 | $1,450 | $1.25 | 8d | 1 | 1.01mi |
| 36 Connolly Dr Saint Louis, MO | 3.0 | 1.0 | 1024 | $1,149 | $1.12 | 24d | 1 | 1.03mi |
| 3582 Pershall Rd Unit 3631 Ferguson, MO | 2.0 | 2.0 | 1500 | $1,295 | $0.86 | 44d | 1 | 1.07mi |
| 221 Barto Dr Saint Louis, MO | 3.0 | 2.0 | 958 | $1,295 | $1.35 | 21d | 1 | 1.09mi |
| 11 Anistasia Dr Saint Louis, MO | 3.0 | 1.5 | 1120 | $1,345 | $1.20 | 24d | 1 | 1.09mi |
| 220 Du Bourg Ln Florissant, MO | 2.0 | 1.0 | 816 | $1,150 | $1.41 | 44d | 1 | 1.18mi |
| 107 Anistasia Dr Saint Louis, MO | 2.0 | 2.0 | 1030 | $1,400 | $1.36 | 24d | 1 | 1.19mi |
| 1275 N Florissant Rd Saint Louis, MO | 2.0 | 1.0 | 1008 | $1,275 | $1.26 | 24d | 1 | 1.20mi |
| 135 Saint Maurice Ln Florissant, MO | 3.0 | 1.0 | 816 | $1,395 | $1.71 | 44d | 1 | 1.20mi |
| 305 S Lafayette St Florissant, MO | 3.0 | 1.0 | 864 | $1,409 | $1.63 | 17d | 1 | 1.21mi |
| 1600 Horseshoe Dr Florissant, MO | 3.0 | 2.0 | 1314 | $1,550 | $1.18 | 44d | 1 | 1.23mi |
| 241 Flora Dr Saint Louis, MO | 2.0 | 1.0 | 703 | $1,075 | $1.53 | 24d | 1 | 1.26mi |
| 46 Bascom Dr Saint Louis, MO | 2.0 | 1.0 | 932 | $1,175 | $1.26 | 44d | 1 | 1.27mi |
| 171 Elbring Dr Saint Louis, MO | 3.0 | 1.5 | 1008 | $1,395 | $1.38 | 13d | 1 | 1.36mi |
| 153 Bascom Dr Saint Louis, MO | 3.0 | 1.0 | 1076 | $1,195 | $1.11 | 20d | 1 | 1.37mi |
Listing history 15 events
-
2026-06-05statusdays on market $165,000 Pending 9 DOM
-
2026-06-03days on market $165,000 Active 8 DOM
-
2026-06-02days on market $165,000 Active 7 DOM
-
2026-06-01days on market $165,000 Active 6 DOM
-
2026-05-31days on market $165,000 Active 5 DOM
-
2026-05-26$165,000 Active
-
2021-06-25soldstatus
-
2020-10-29soldstatus $100,000
-
2018-03-02soldstatus Closed 159-char remark
Show marketing remark (159 chars)
Ranch style home with two bedrooms and one bath with approximately 1176 square feet living area. Attached garage. Great starter home or investment opportunity.
-
2018-01-25status Pending 159-char remark
Show marketing remark (159 chars)
Ranch style home with two bedrooms and one bath with approximately 1176 square feet living area. Attached garage. Great starter home or investment opportunity.
-
2018-01-25historical 159-char remark
Show marketing remark (159 chars)
Ranch style home with two bedrooms and one bath with approximately 1176 square feet living area. Attached garage. Great starter home or investment opportunity.
-
2018-01-22price $38,700 159-char remark
Show marketing remark (159 chars)
Ranch style home with two bedrooms and one bath with approximately 1176 square feet living area. Attached garage. Great starter home or investment opportunity.
-
2017-12-29$45,600 Active 159-char remark
Show marketing remark (159 chars)
Ranch style home with two bedrooms and one bath with approximately 1176 square feet living area. Attached garage. Great starter home or investment opportunity.
-
2001-03-22soldstatus $69,000
-
2000-12-26soldstatus $50,000
ⓘ Source: listings_history table (triggers on properties + properties_extension) + one-shot
backfill from property_details.listing_events for pre-trigger history.
Tax reassessment forecast MO · Resets to sale price
- Current annual tax
- $1,457 · $121/mo
- Projected year-2 tax
- $1,600 · $133/mo
- Expected delta
- +$144/yr (+$12/mo · 9.9%)
ⓘ Screening estimate from a state-policy table — verify with the county assessor before closing.
Climate risk First Street
- Flood 1/10 Low FEMA zone X (unshaded) · 0% chance over 30 yrs
- Wildfire 1/10 Low
- Heat 4/10 Moderate 7 d/yr ≥106°F today · 21 d/yr by 30 yrs out
- Wind 2/10 Low 100% chance of damaging wind over 30 yrs
- Air quality 3/10 Moderate 3 unhealthy d/yr today · 5 by 30 yrs out
Nearby sold comps map
Loading sold comps map…
Walkable amenities ~0.75 mi
Loading nearby amenities…
Taxation est. · year 1
- Rental income
- $19,565
- − Mortgage interest
- −$9,243
- − Property taxes
- −$1,457
- − Insurance
- −$825
- − Repairs & maintenance
- −$1,565
- − Management
- −$1,565
- − Depreciation
- −$4,800
- Taxable income
- $111
- Est. tax owed @ 24.0%
- −$27
- After-tax cash flow
- $2,765/yr
For passive investors: Depreciation is non-cash, so a rental often shows a tax loss while cash-flowing — sheltering income. Rental losses are passive: they offset passive income freely, and up to $25,000/yr can offset ordinary (W-2) income if you actively participate and your MAGI is under $100k (phasing out to $0 by $150k); unused losses carry forward. On sale, claimed depreciation is recaptured at up to 25%, and gains may owe capital-gains tax (a 1031 exchange can defer both). Figures are a year-1 estimate at your 24.0% rate — not tax advice; consult a CPA.
Schools (NCES district)
- District
- Ferguson-Florissant R-II
- NCES district ID
- 2912010
- Math proficiency
- 7% ▼ -9.00%
- Reading proficiency
- 20% ▼ -6.00%
- Median HH income
- $44,610
- Composite
- 11.96/100
- National rank
- #9666
- State rank
- #311 of 324 in MO
Livability — Florissant
- Score
- 73/100
- State rank
- #82
- US rank
- #5406
Category grades
Schools grade is shown separately in the Schools card above.
Census & demographics
- Census place
- Florissant, MO
- County
- Saint Louis County · 888,823 people
- City population
- 42,258
- Metro
- St. Louis, MO-IL
- Population (ZIP)
- 43,056
- Household income
- $66,776
- Rent vs Own
- Severe rent burden
- 1429.0
Population outlook (St. Louis County) Hauer SSP2
- Today (2025)
- 1,025,227 people
- By 2030
- 1,028,023 · +0.3%
- By 2040
- 1,020,940 · -0.4%
- By 2050
- 1,007,280 · -1.8%
- By 2075
- 987,277 · -3.7%
- By 2100
- 921,984 · -10.1%
Race, ethnicity, and origin ACS 2023
- Neighborhood character
- Predominantly Black (71%)
- Race & ethnicity
- Black 71% White 23% Two or more races 4% Hispanic / Latino 1%
- Common ancestry
- Romanian 1% Lithuanian 1% Italian 1%
- Foreign-born
- 3% · Canada, Vietnam
- Languages at home
- 95% English-only · Spanish 1% French/Haitian/Cajun 1%
Political lean MEDSL · St. Louis
- 2024 margin
- Strong D (+23.4) · D 60.8% · R 37.4% · Other 1.7%
- 2008→2024 swing
- +3.5pp toward D · 2008: 19.9pp · 2024: 23.4pp
- All cycles
- 2024: D+23.4 2020: D+24.0 2016: D+16.2 2012: D+13.7 2008: D+19.9
Not yet ingested
- Civics
- —
Market trends
- HPI YoY
- ▲ 13.78%
- Current HPI
- 570.6
- Rent YoY
- ▲ 7.51%
- Metro
- St. Louis, MO-IL
- State GDP YoY
- ▲ 1.84%
- F500 in state
- 20
Industry mix (Fortune 500 HQ in MO)
| Industry | F500 HQs | Revenue |
|---|---|---|
| Healthcare | 1 | $163B |
|
||
| Insurance | 1 | $21B |
|
||
| Industrial Technology | 1 | $17B |
|
||
| Retail | 1 | $16B |
|
||
| Industrial Distribution | 1 | $10B |
|
||
| Utilities | 1 | $9B |
|
||
Price history
+230.0% since first listed10 events — show timeline
- 2026-05-26 Listed $165,000 MARIS as Distributed by MLS Grid
- 2021-06-25 Sold (Public Records) — Public Records
- 2020-10-29 Sold (Public Records) $100,000 Public Records
- 2018-03-02 Sold (MLS) — MARIS as Distributed by MLS Grid
- 2018-01-25 Pending — MARIS as Distributed by MLS Grid
- 2018-01-25 Delisted — MARIS as Distributed by MLS Grid
- 2018-01-22 Price Changed $38,700 MARIS as Distributed by MLS Grid
- 2017-12-29 Listed $45,600 MARIS as Distributed by MLS Grid
- 2001-03-22 Sold (Public Records) $69,000 Public Records
- 2000-12-26 Sold (Public Records) $50,000 Public Records
Property tax history
+1.6%/yrLatest (2022): $1,457 · +1.7% YoY. Source: county tax records.
Cash-flow waterfall
monthlySold comps — $/sqft
last 12 mo · ≤1 miLoading sold comps…