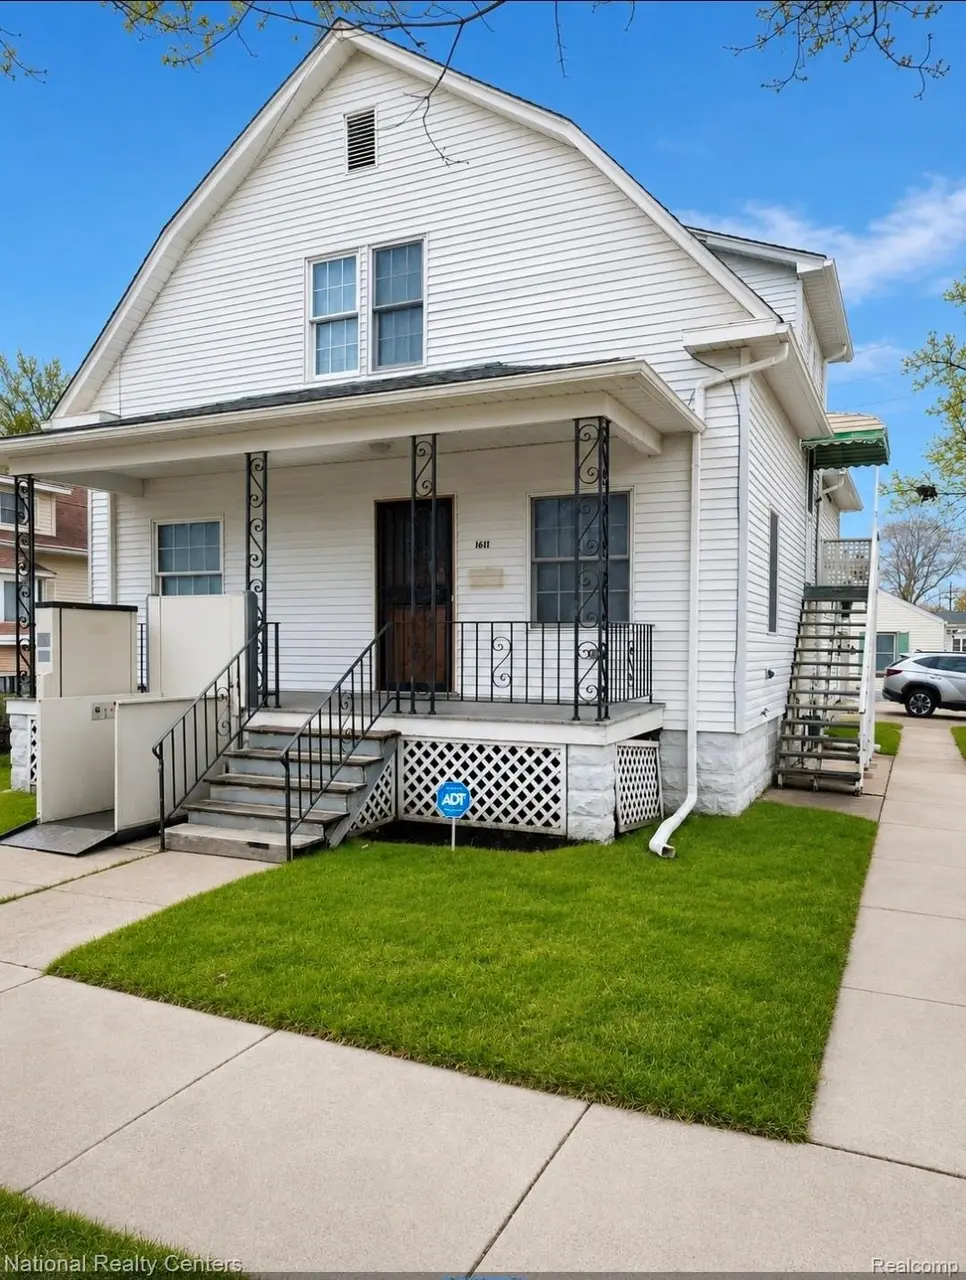
1611 S Erie St · Bay City, MI
Flood risk 1/10 · Minimal
- FEMA flood zone
- X (unshaded)
- Chance of flooding over 30 yrs
- 0.0%
- Est. flood insurance / yr
- $473 – $860
Fire risk 1/10 · Minimal
- Est. fire insurance / yr
- $784 – $1,456
Heat risk 2/10 · Minimal
- Hot days now (above 97°F)
- 7 days/yr
- Hot days in 30 yrs
- 14 days/yr
Wind risk 1/10 · Minimal
- Chance of severe wind over 30 yrs
- —
Air-quality risk 2/10 · Minimal
- Unhealthy air days now
- 1 days/yr
- Unhealthy air days in 30 yrs
- 2 days/yr
Risk factors via First Street. Map © Google.
Why this score? — see what drove the C- grade
The composite is a weighted blend of 9 inputs, each scored 0–100. Each bar is that input's sub-score; the figure is the points it added to the 100-point composite (weight × sub-score).
- Cash flow +16.3/30.0
- ARV discount +15.0/15.0
- 1% rule +5.0/10.0
- DSCR +5.0/10.0
- Livability +3.4/5.0
- Schools +2.8/10.0
- Rent growth +2.5/5.0
- Condition / age +2.5/5.0
- Appreciation +0.0/10.0
$139,999
🖨 Deal sheet (PDF) 📄 Offer letter ✓ Due diligence
Listing remarks MLS
Great value with tons of potential! This charming corner home features 3 bedrooms, 3 bathrooms, beautiful hardwood floors, spacious eat-in kitchen, living & dining rooms, newer kitchen appliances included, abundant basement storage, and a 2-car garage. Large 2nd-floor flex space - use your imagination for an office, lounge, playroom, or additional living area! Conveniently located near downtown, parks, shopping, and dining. Sold AS-IS. Schedule your showing today - seller welcomes all reasonable offers. BATVAI
Key facts
- 2nd-floor flex space
- Eat-in kitchen
- Hardwood floors
Tags
Property features AI
Finance
- Other: Property listed by National Realty Centers, Inc.
Exterior
- Parking: Detached garage with 2 garage spaces; Garage faces side
- Utilities: Public water; Public sewer
- Home design: Single-family residence; Two levels; Ground-level entry with steps
- Construction: Aluminum siding
- Exterior features: Asphalt roof; Private road frontage on a privately maintained road; Lot approximately 0.12 acres (60 x 90)
Interior
- Kitchen: Free-standing gas range; Free-standing refrigerator
- Bedrooms: 6 total rooms (includes bedrooms and living spaces)
- Bathrooms: 3 full bathrooms
- Heating & cooling: Central air conditioning; Ceiling fans; Forced-air heating (natural gas)
- Interior features: Unfinished basement; Free-standing gas range; Free-standing refrigerator
- Laundry & utility: Basement (unfinished) — utility space available
Neighborhood map
What this means for you Summary
Snapshot
- This is a 3-bed/2.0-bath single-family listed at $140k.
Deal economics
- At list price, monthly cash flow is $77 ($921/yr) — positive.
- The deal already cash-flows at list — no discount required.
- Meets the 1% rule at list price ($1k rent vs $140k).
- Recommended offer: $138k (1.5% below list) — sets the bar for market timing.
Location & tenants
- Location reads 68/100 on livability (#360 in MI) — a middle-class / working-renter tenant base. Strengths: cost of living A+, housing A+, health & safety A+; Watch: amenities D, crime F, commute F.
- Bay City School District (urban): math 27% / reading 40% proficiency, ranked #317 of 540 in MI (top 59%) — families likely to look elsewhere, expect single-tenant / working-renter base with shorter leases.
- Zoned schools: Kolb Elementary School (math 37% / reading 42%, grade F, #606 of 1,397 statewide, top 48%, 477 students, 72% FRL); Handy Middle School (math 17% / reading 33%, grade F, #387 of 493 statewide, top 78%, 685 students, 79% FRL); Bay City Central High School (math 22% / reading 47%, grade F, #372 of 713 statewide, top 56%, 1,033 students, 64% FRL) — zoned schools average 72% FRL vs 44% district-wide (28 pts higher); higher-poverty schools than district average — tighter screening recommended.
- Market conditions: 248 active listings in the ZIP; 39 units permitted in Bay County in 2024 (0 in 5+ unit buildings).
Forward outlook
- Local home prices are declining (-3.0%/yr); year-one equity from $968 of loan paydown is wiped out by about $4k of value loss. Plan a longer hold.
- Bay County population projected at -21% by 2050 — secular population decline; favor cash flow + early exit over multi-decade hold.
Negotiation context
- It's been on market 24 days — a 2% lower offer ($138k) is reasonable based on typical stale-listing flexibility.
- 2 sale attempts with the ask held roughly flat each time — persistent listings suggest the price (not the market) is what's stuck; bring a comps-based counter.
Risks & watch-outs
- Watch-outs: built in 1900 — expect roof / HVAC / electrical / plumbing capex.
Questions for the listing agent
- Built in 1900 — when were the roof, HVAC, electrical panel, plumbing, and water heater last replaced?
- Is there a deadline driving the sale (1031 exchange, divorce, estate, relocation)? That informs how much negotiation room exists.
- Schools are D-rated, which usually means shorter tenancies and higher turnover. Who's the typical renter profile here, and what's been the actual vacancy rate?
- Crime grade is F in this area — have there been break-ins, vandalism, or insurance claims at this property in the last 3 years? What carrier currently insures it and at what premium?
- What's the average days-on-market for RENTAL listings here right now (not sales)? A rising rental-DOM trend means longer vacancies and softer asking-rent achievability than the comps imply.
- What's the recent tenant-quality profile in this submarket — average credit score on applications, eviction rate, late-payment / NSF rate, and stable-employment percentage? A property-management company in the area should have these aggregated.
- How much new for-sale + rental construction is in the pipeline within 1–3 miles? Heavy new supply typically softens prices + rents 12–24 months out; constrained supply supports both.
Investment metrics
- 1% rule
- 1.00% ✓
- Cap rate
- 6.95%
- Cash-on-cash
- 2.35%
- DSCR
- 1.10
- GRM
- 8.3
CMA / ARV
- ARV (on-the-fly)
- $179,955
- Comps found
- 11
Show comp detail 11 sales within ~0.75 mi
| Address | Dist | Beds/Ba | Sqft | Sold | Price | $/sf | Match |
|---|---|---|---|---|---|---|---|
| 1704 S Warner St | 0.15mi | 3/1.5 | 1,962 (+1%) | 5mo | $183,000 | $93 | 85 |
| 1508 Raymond St | 0.21mi | 3/2.0 | 1,690 (-13%) | 5mo | $174,500 | $103 | 65 |
| 1811 S Chilson St | 0.17mi | 4/2.0 (+1) | 1,894 (-2%) | 23mo | $136,000 | $72 | 65 |
| 1312 Raymond St | 0.28mi | 3/1.5 | 1,750 (-10%) | 14mo | $134,000 | $77 | 57 |
| 1203 S WARNER RD St | 0.35mi | 4/2.0 (+1) | 2,038 (+5%) | 15mo | $126,900 | $62 | 57 |
| 409 McCormick St | 0.70mi | 4/1.0 (+1) | 2,032 (+5%) | 10mo | $92,962 | $46 | 42 |
| 805 S Warner St | 0.66mi | 4/3.0 (+1) | 1,869 (-3%) | 17mo | $117,500 | $63 | 41 |
| 5163 Reinhardt Ln | 0.73mi | 3/2.5 | 1,858 (-4%) | 20mo | $188,500 | $101 | 40 |
| 803 S Warner St | 0.67mi | 4/1.5 (+1) | 1,686 (-13%) | 8mo | $158,000 | $94 | 34 |
| 5149 Reinhardt Ln | 0.74mi | 3/1.5 | 1,672 (-14%) | 10mo | $199,000 | $119 | 32 |
| 3409 Parkway Dr | 0.72mi | 3/3.0 | 2,204 (+14%) | 14mo | $265,000 | $120 | 28 |
Match score weights: distance 35% · size 25% · config 20% · recency 20%. Top-matched comps best support the ARV.
Projected returns pro-forma
-3.0% appreciation · 3.0% rent growth · sell at horizon
- IRR
- -12.5%
- Equity multiple
- 0.55×
- Total profit
- $-17,734
- Equity at exit
- $20,874
- IRR
- -3.4%
- Equity multiple
- 0.77×
- Total profit
- $-8,896
- Equity at exit
- $12,105
Cash invested: $39,200 (down + closing). Projections, not guarantees.
Landlord ↔ Tenant lean methodology
- Overall (STATE)
- 62 Landlord-Friendly
- State Michigan
- 62 Landlord-Friendly · EVEN
- County
- — inherits STATE
- City
- — inherits STATE
ZIP-level market 48706
- Active inventory
- 248
- Price-to-rent
- 8.3×
Monthly cashflow live
- Estimated rent
- $1,405 medium interval (Pro) →
- Mortgage (P&I)
- −$734
- Tax from tax record
- −$241 /mo · $2,888/yr
- Insurance
- −$58
- HOA
- −$0
- Vacancy / Maint / Mgmt
- −$295
- Net cashflow
- $77
Break-even live
Sensitivity live
| Price | -10% $156 | -5% $116 | +0% $77 | +5% $37 | +10% $-2 |
|---|---|---|---|---|---|
| Rent | -10% $-34 | -5% $21 | +0% $77 | +5% $132 | +10% $188 |
| Rate | -1.0pp $147 | -0.5pp $112 | base $77 | +0.5pp $41 | +1.0pp $4 |
UW: 25.0% down · 7.5% · 30yr · 1.5% tax · 5.0% vac · 8.0% maint · 8.0% mgmt
Financing live
Cash to close
- Down payment
- $35,000
- Closing costs
- $4,200
- Reserves months
- —
- Total cash needed
- —
Loan-product check · same deal, 3 products live
Conventional
25% down · 7.5% · 30yr
- Down + closing
- —
- Monthly P&I
- —
- Monthly cashflow
- —
- DSCR
- —
- Eligible?
- —
Personal DTI + credit; lowest rate.
DSCR
20% down · 8.5% · 30yr
- Down + closing
- —
- Monthly P&I
- —
- Monthly cashflow
- —
- DSCR
- —
- Eligible?
- —
No personal income docs; deal must DSCR.
Hard money
10% down · 12.0% · 12mo
- Down + closing
- —
- Monthly P&I
- —
- Monthly cashflow
- —
- DSCR
- —
- Eligible?
- —
Short-term bridge; refi at stabilization.
Listing history 19 events
-
2026-06-21days on market $139,999 Active 24 DOM
-
2026-06-19days on market $139,999 Active 22 DOM
-
2026-06-18days on market $139,999 Active 21 DOM
-
2026-06-17days on market $139,999 Active 20 DOM
-
2026-06-16days on market $139,999 Active 19 DOM
-
2026-06-15days on market $139,999 Active 18 DOM
-
2026-06-14days on market $139,999 Active 16 DOM
-
2026-06-12days on market $139,999 Active 15 DOM
-
2026-06-09days on market $139,999 Active 12 DOM
-
2026-06-08days on market $139,999 Active 11 DOM
-
2026-06-07days on market $139,999 Active 10 DOM
-
2026-06-05days on market $139,999 Active 7 DOM
-
2026-06-03days on market $139,999 Active 6 DOM
-
2026-06-02days on market $139,999 Active 5 DOM
-
2026-06-01days on market $139,999 Active 4 DOM
-
2026-05-31days on market $139,999 Active 3 DOM
-
2026-05-30days on market $139,999 Active 2 DOM
-
2026-05-28$139,999 Active
Show marketing remark (525 chars)
Great value with tons of potential! This charming corner home features 3 bedrooms, 3 bathrooms, beautiful hardwood floors, spacious eat-in kitchen, living & dining rooms, newer kitchen appliances included, abundant basement storage, and a 2-car garage. Large 2nd-floor flex space - use your imagination for an office, lounge, playroom, or additional living area! Conveniently located near downtown, parks, shopping, and dining. Sold AS-IS. Schedule your showing today - seller welcomes all reasonable offers. BATVAI
-
2026-05-28$139,999 Active 525-char remark
Show marketing remark (525 chars)
Great value with tons of potential! This charming corner home features 3 bedrooms, 3 bathrooms, beautiful hardwood floors, spacious eat-in kitchen, living & dining rooms, newer kitchen appliances included, abundant basement storage, and a 2-car garage. Large 2nd-floor flex space - use your imagination for an office, lounge, playroom, or additional living area! Conveniently located near downtown, parks, shopping, and dining. Sold AS-IS. Schedule your showing today - seller welcomes all reasonable offers. BATVAI
ⓘ Source: listings_history table (triggers on properties + properties_extension) + one-shot
backfill from property_details.listing_events for pre-trigger history.
Tax reassessment forecast MI · Partial reset (capped growth)
- Current annual tax
- $2,888 · $241/mo
- Projected year-2 tax
- $2,888 · $241/mo
- Expected delta
- $0/yr ($0/mo · 0.0%)
ⓘ Screening estimate from a state-policy table — verify with the county assessor before closing.
Climate risk First Street
- Flood 1/10 Low FEMA zone X (unshaded) · 0% chance over 30 yrs
- Wildfire 1/10 Low
- Heat 2/10 Low 7 d/yr ≥97°F today · 14 d/yr by 30 yrs out
- Wind 1/10 Low
- Air quality 2/10 Low 1 unhealthy d/yr today · 2 by 30 yrs out
Nearby sold comps map
Loading sold comps map…
Walkable amenities ~0.75 mi
Loading nearby amenities…
Taxation est. · year 1
- Rental income
- $16,860
- − Mortgage interest
- −$7,842
- − Property taxes
- −$2,888
- − Insurance
- −$700
- − Repairs & maintenance
- −$1,349
- − Management
- −$1,349
- − Depreciation
- −$4,073
- Taxable loss
- −$1,340
- Est. tax savings @ 24.0%
- +$322
- After-tax cash flow
- $1,243/yr
For passive investors: Depreciation is non-cash, so a rental often shows a tax loss while cash-flowing — sheltering income. Rental losses are passive: they offset passive income freely, and up to $25,000/yr can offset ordinary (W-2) income if you actively participate and your MAGI is under $100k (phasing out to $0 by $150k); unused losses carry forward. On sale, claimed depreciation is recaptured at up to 25%, and gains may owe capital-gains tax (a 1031 exchange can defer both). Figures are a year-1 estimate at your 24.0% rate — not tax advice; consult a CPA.
Schools (NCES district)
- District
- Bay City School District
- NCES district ID
- 2604260
- Math proficiency
- 27% ▼ -8.00%
- Reading proficiency
- 40% ▼ -4.00%
- Median HH income
- $43,833
- Composite
- 28.47/100
- National rank
- #6743
- State rank
- #317 of 540 in MI
Livability — Bay City
- Score
- 68/100
- State rank
- #360
- US rank
- #8912
Category grades
Schools grade is shown separately in the Schools card above.
Census & demographics
- Census place
- Bay City, MI
- City population
- 25,635
- Population (ZIP)
- 38,756
Population outlook (Bay County) Hauer SSP2
- Today (2025)
- 101,476 people
- By 2030
- 98,152 · -3.3%
- By 2040
- 89,711 · -11.6%
- By 2050
- 80,614 · -20.6%
- By 2075
- 60,544 · -40.3%
- By 2100
- 41,603 · -59.0%
Race, ethnicity, and origin ACS 2023
- Neighborhood character
- Predominantly White (90%)
- Race & ethnicity
- White 90% Hispanic / Latino 5% Two or more races 4%
- Common ancestry
- Romanian 16% Lithuanian 9% Slovak 2%
- Foreign-born
- 1%
- Languages at home
- 98% English-only · Spanish 1%
Political lean MEDSL · Bay
- 2024 margin
- R (+14.7) · D 42.0% · R 56.7% · Other 1.3%
- 2008→2024 swing
- -30.0pp toward R · 2008: 15.3pp · 2024: -14.7pp
- All cycles
- 2024: R+14.7 2020: R+11.6 2016: R+12.6 2012: D+6.0 2008: D+15.3
Not yet ingested
- Civics
- —
Market trends
- HPI YoY
- ▼ -133.29%
- Current HPI
- 203.6444
- Rent YoY
- —
- Metro
- —
- State GDP YoY
- ▲ 1.37%
- F500 in state
- 28
Industry mix (Fortune 500 HQ in MI)
| Industry | F500 HQs | Revenue |
|---|---|---|
| Automotive Parts | 3 | $48B |
|
||
| Automotive | 2 | $372B |
|
||
| Chemicals | 1 | $45B |
|
||
| Automotive Retail | 1 | $29B |
|
||
| Healthcare / Medical Devices | 1 | $23B |
|
||
| Automotive Technology | 1 | $20B |
|
||
Price history
+0.0% since first listed2 events — show timeline
- 2026-05-28 Listed $139,999 MiRealSource-MiMLS
- 2026-05-28 Listed $139,999 REALCOMP
Property tax history
+3.4%/yrLatest (2025): $2,888 · +18.3% YoY. Source: county tax records.
Cash-flow waterfall
monthlySold comps — $/sqft
last 12 mo · ≤1 miLoading sold comps…