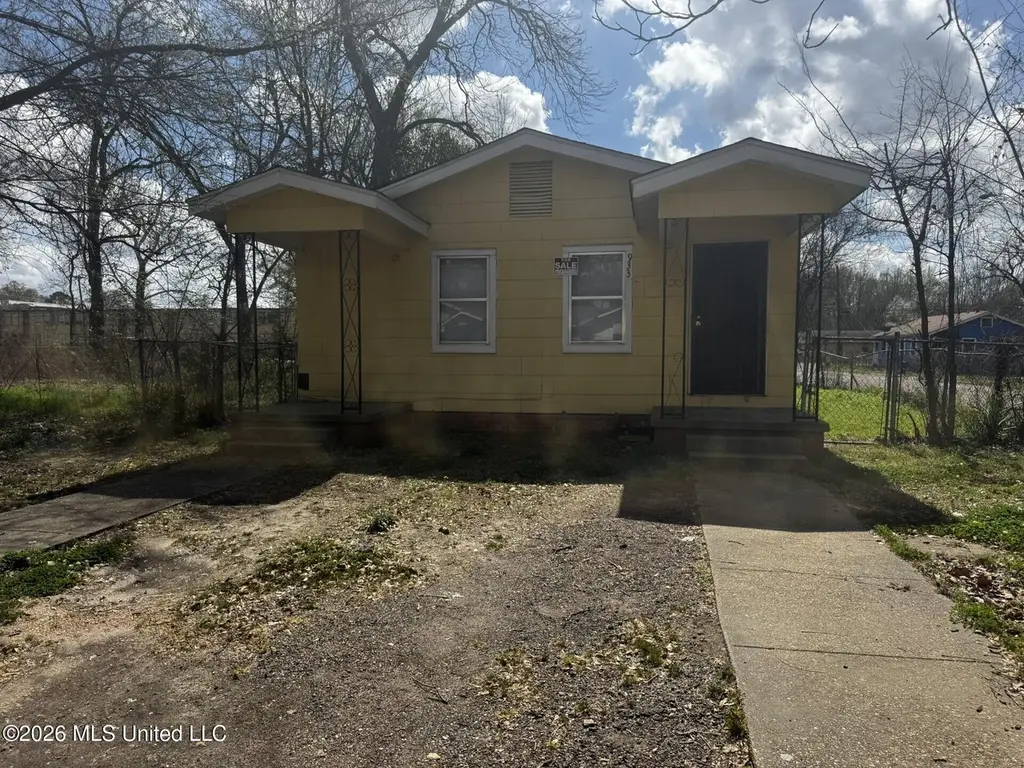
933 Randall St · Jackson, MS
Flood risk 6/10 · Moderate
- FEMA flood zone
- X (unshaded)
- Chance of flooding over 30 yrs
- 0.74%
- Est. flood insurance / yr
- $507 – $1,088
Fire risk 1/10 · Minimal
- Est. fire insurance / yr
- $1,241 – $2,305
Heat risk 7/10 · Major
- Hot days now (above 109°F)
- 7 days/yr
- Hot days in 30 yrs
- 20 days/yr
Wind risk 8/10 · Major
- Chance of severe wind over 30 yrs
- 80.0%
Air-quality risk 1/10 · Minimal
- Unhealthy air days now
- 0 days/yr
- Unhealthy air days in 30 yrs
- 0 days/yr
Risk factors via First Street. Map © Google.
Why this score? — see what drove the C- grade
The composite is a weighted blend of 9 inputs, each scored 0–100. Each bar is that input's sub-score; the figure is the points it added to the 100-point composite (weight × sub-score).
- Cash flow +15.0/30.0
- ARV discount +13.1/15.0
- Appreciation +5.4/10.0
- 1% rule +5.0/10.0
- DSCR +5.0/10.0
- Livability +3.4/5.0
- Rent growth +2.5/5.0
- Condition / age +2.5/5.0
- Schools +1.1/10.0
$25,000
🖨 Deal sheet 📄 Offer letter ✓ Due diligence
Listing remarks MLS
Great investment opportunity in Jackson! This property is being sold as is and offers strong potential for investors looking to add to their rental portfolio or complete a renovation project. Located in an established area with steady rental demand. Priced accordingly to reflect condition.
Key facts
- 3,920 sq ft lot
- Built 1960
- Listed 69 days
Neighborhood map
What this means for you Summary
Snapshot
- This is a 2-bed/2.0-bath single-family listed at $25k.
Deal economics
- At list price, monthly cash flow is $640 ($8k/yr) — positive.
- The deal already cash-flows at list — no discount required.
- Meets the 1% rule at list price ($1k rent vs $25k).
- Recommended offer: $24k (6.0% below list) — sets the bar for market timing.
- Cap rate 37.0% vs local median 9.9% in Jackson — top-decile yield for the area; either an underpriced asset or a hidden risk that comps aren't pricing in. Stress-test before assuming the spread holds.
Location & tenants
- Location reads 68/100 on livability (#66 in MS) — a middle-class / working-renter tenant base. Strengths: commute A+, cost of living A+, housing A+; Watch: schools F, amenities F, employment F.
- Jackson Public School District (urban): math 9% / reading 18% proficiency, ranked #112 of 130 in MS (top 86%) — low school quality limits family demand, transient renter base, plan for 1-2y turnover; 88% free/reduced lunch — lower-income household profile, screen leases tightly.
- Market conditions: 10 active listings in the ZIP; 22 comparable units currently listed for rent nearby; rentals at typical pace (median 23d on market — plan ~3-4 weeks tenant-placement turnaround); 45% of comp listings sitting > 30 days — soft ceiling on asking rent; 167 units permitted in Hinds County in 2024 (0 in 5+ unit buildings).
Forward outlook
- In year one you build about $373 of equity ($173 loan paydown + $200 appreciation (0.8% local appreciation)).
- Hinds County population projected to shrink 6% by 2050 — rents likely to lag national; underwrite the cash flow, not the appreciation.
- At projected returns (0.8% appreciation + 3.0% rent growth), your $7k cash investment doubles in ~1 year — after that, you're playing with house money.
Negotiation context
- It's been on market 70 days — a 6% lower offer ($24k) is reasonable based on typical stale-listing flexibility.
Risks & watch-outs
- Climate carrying-cost: major flood risk; severe wind risk, 80% chance of damaging wind over 30y; extreme-heat days projected 7→20/yr by 2055 (HVAC capex compounding) — expect insurance premiums to compound above CPI over the hold.
Questions for the listing agent
- It's been on market 70 days. Have you received any prior offers? Is the seller open to a 6% concession, seller financing, or rate buy-down credit?
- Built in 1960 — when were the roof, HVAC, electrical panel, plumbing, and water heater last replaced?
- Why hasn't it sold? Are there any deal-killer items the seller is aware of (foundation, flood, title, zoning, code violations)?
- Is there a deadline driving the sale (1031 exchange, divorce, estate, relocation)? That informs how much negotiation room exists.
- Schools are F-rated, which usually means shorter tenancies and higher turnover. Who's the typical renter profile here, and what's been the actual vacancy rate?
- What's the average days-on-market for RENTAL listings here right now (not sales)? A rising rental-DOM trend means longer vacancies and softer asking-rent achievability than the comps imply.
- What's the recent tenant-quality profile in this submarket — average credit score on applications, eviction rate, late-payment / NSF rate, and stable-employment percentage? A property-management company in the area should have these aggregated.
- How much new for-sale + rental construction is in the pipeline within 1–3 miles? Heavy new supply typically softens prices + rents 12–24 months out; constrained supply supports both.
Investment metrics
- 1% rule
- 4.20% ✓
- Cap rate
- 36.99%
- Cash-on-cash
- 109.63%
- DSCR
- 5.88
- GRM
- 2.0
CMA / ARV
- ARV (median comp)
- $28,587
- List price
- $25,000
- Delta
- -12.55%
- Verdict
- UNDERPRICED
- Comps
- 20 within 1.0 mi
Show comp detail 8 sales within ~0.75 mi
| Address | Dist | Beds/Ba | Sqft | Sold | Price | $/sf | Match |
|---|---|---|---|---|---|---|---|
| 617 Erie St | 0.27mi | 2/1.0 | 1,090 (-1%) | 6mo | $8,000 | $7 | 76 |
| 2157 Ludlow Ave | 0.37mi | 3/2.0 (+1) | 1,122 (+2%) | 12mo | $37,500 | $33 | 65 |
| 2234 Mobile Ave | 0.47mi | 3/1.5 (+1) | 1,102 (-0%) | 10mo | $25,000 | $23 | 62 |
| 518 W Ash St | 0.40mi | 2/1.0 | 1,048 (-5%) | 11mo | $23,000 | $22 | 60 |
| 425 Derrick St | 0.40mi | 3/1.0 (+1) | 1,056 (-4%) | 8mo | $59,900 | $57 | 58 |
| 2324 Ludlow Ave | 0.52mi | 3/1.0 (+1) | 1,203 (+9%) | 3mo | $20,000 | $17 | 49 |
| 148 Princeton St | 0.58mi | 3/1.0 (+1) | 1,125 (+2%) | 16mo | $82,000 | $73 | 48 |
| 2235 Mobile Ave | 0.47mi | 3/1.0 (+1) | 994 (-10%) | 12mo | $30,000 | $30 | 42 |
Match score weights: distance 35% · size 25% · config 20% · recency 20%. Top-matched comps best support the ARV.
Projected returns pro-forma
0.8% appreciation · 3.0% rent growth · sell at horizon
- IRR
- —
- Equity multiple
- 6.85×
- Total profit
- $40,979
- Equity at exit
- $8,273
- IRR
- —
- Equity multiple
- 14.23×
- Total profit
- $92,635
- Equity at exit
- $10,794
Cash invested: $7,000 (down + closing). Projections, not guarantees.
Landlord ↔ Tenant lean methodology
- Overall (STATE)
- 90 Strongly Landlord-Friendly
- State Mississippi
- 90 Strongly Landlord-Friendly · R+11
- County
- — inherits STATE
- City
- — inherits STATE
ZIP-level market 39203
- Home prices YoY
- 0.6%
- Active inventory
- 10
- Price-to-rent
- 2.0×
Monthly cashflow live
- Estimated rent
- $1,051 high interval (Pro) →
- Mortgage (P&I)
- −$131
- Tax from tax record
- −$49 /mo · $589/yr
- Insurance
- −$10
- HOA
- −$0
- Vacancy / Maint / Mgmt
- −$221
- Net cashflow
- $640
Break-even live
UW: 25.0% down · 7.5% · 30yr · 1.5% tax · 5.0% vac · 8.0% maint · 8.0% mgmt
Financing live
Cash to close
- Down payment
- $6,250
- Closing costs
- $750
- Reserves months
- —
- Total cash needed
- —
Loan-product check · same deal, 3 products live
Conventional
25% down · 7.5% · 30yr
- Down + closing
- —
- Monthly P&I
- —
- Monthly cashflow
- —
- DSCR
- —
- Eligible?
- —
Personal DTI + credit; lowest rate.
DSCR
20% down · 8.5% · 30yr
- Down + closing
- —
- Monthly P&I
- —
- Monthly cashflow
- —
- DSCR
- —
- Eligible?
- —
No personal income docs; deal must DSCR.
Hard money
10% down · 12.0% · 12mo
- Down + closing
- —
- Monthly P&I
- —
- Monthly cashflow
- —
- DSCR
- —
- Eligible?
- —
Short-term bridge; refi at stabilization.
Rent comps 22 comps
| Address | Beds | Baths | Sqft | Rent | $/sqft | DOM | Units | Dist |
|---|---|---|---|---|---|---|---|---|
| 2157 Ludlow Ave Jackson, MS | 3.0 | 2.0 | 1123 | $1,300 | $1.16 | 43d | 1 | 0.33mi |
| 2157 Ludlow Ave Unit Na Jackson, MS | 3.0 | 2.0 | 1123 | $1,450 | $1.29 | 13d | 1 | 0.33mi |
| 1225 Bailey Ave Jackson, MS | 2.0 | 1.0 | 990 | $750 | $0.76 | 43d | 1 | 0.58mi |
| 137 Sivley Ave Jackson, MS | 3.0 | 1.0 | 1288 | $1,000 | $0.78 | 21d | 1 | 0.65mi |
| 1204 First Ave Jackson, MS | 2.0 | 1.0 | 800 | $725 | $0.91 | 23d | 1 | 0.70mi |
| 255 S Prentiss St Jackson, MS | 2.0 | 1.0 | 729 | $1,000 | $1.37 | 43d | 1 | 0.76mi |
| 1818 Saint Charles St Jackson, MS | 3.0 | 1.0 | 983 | $995 | $1.01 | 43d | 1 | 0.80mi |
| 2829 Comfort St Jackson, MS | 3.0 | 1.5 | 1260 | $1,250 | $0.99 | 23d | 1 | 1.07mi |
| 2829 Comfort St Jackson, MS | 3.0 | 2.0 | 1260 | $1,250 | $0.99 | 13d | 1 | 1.07mi |
| 2566 Williamson Ave Jackson, MS | 3.0 | 1.5 | 940 | $1,150 | $1.22 | 43d | 1 | 1.09mi |
| 209 Poindexter St Jackson, MS | 2.0 | 2.0 | 1075 | $825 | $0.77 | 43d | 1 | 1.10mi |
| 1633 Robinson St Unit 1633 Jackson, MS | 1.0 | 1.0 | 875 | $775 | $0.89 | 13d | 1 | 1.11mi |
| 1647 Robinson St Unit B Jackson, MS | 1.0 | 1.0 | 900 | $850 | $0.94 | 13d | 1 | 1.12mi |
| 1711 Robinson St Jackson, MS | 2.0 | 1.0 | 800 | $800 | $1.00 | 23d | 1 | 1.15mi |
| 3380 Shady Oaks St Unit B Jackson, MS | 2.0 | 1.0 | 721 | $871 | $1.21 | 23d | 1 | 1.25mi |
| 3380 Shady Oaks St Jackson, MS | 2.0 | 1.0 | 721 | $871 | $1.21 | 13d | 1 | 1.25mi |
| 3380 Shady Oaks St Unit D Jackson, MS | 2.0 | 1.0 | 721 | $832 | $1.15 | 43d | 1 | 1.25mi |
| 1505 N West St Unit 101 Jackson, MS | 1.0 | 1.0 | 700 | $650 | $0.93 | 43d | 1 | 1.25mi |
| 1505 N West St Unit 110 Jackson, MS | 1.0 | 1.0 | 700 | $650 | $0.93 | 21d | 1 | 1.25mi |
| 3444 Martin Luther King Jr Dr Jackson, MS | 3.0 | 2.0 | 1200 | $1,100 | $0.92 | 43d | 1 | 1.37mi |
| 803 N Congress St Unit D Jackson, MS | 1.0 | 1.0 | 900 | $900 | $1.00 | 43d | 1 | 1.49mi |
| 102 N Mill St Jackson, MS | 1.0 | 1.0 | 687 | $1,310 | $1.91 | 13d | 5 | 1.50mi |
Listing history 14 events
-
2026-06-02days on market $25,000 Active 70 DOM
-
2026-06-01days on market $25,000 Active 69 DOM
-
2026-05-31days on market $25,000 Active 68 DOM
-
2026-05-30days on market $25,000 Active 67 DOM
-
2026-04-29price $25,000 290-char remark
Show marketing remark (290 chars)
Great investment opportunity in Jackson! This property is being sold as is and offers strong potential for investors looking to add to their rental portfolio or complete a renovation project. Located in an established area with steady rental demand. Priced accordingly to reflect condition.
-
2026-04-20price $29,500 290-char remark
Show marketing remark (290 chars)
Great investment opportunity in Jackson! This property is being sold as is and offers strong potential for investors looking to add to their rental portfolio or complete a renovation project. Located in an established area with steady rental demand. Priced accordingly to reflect condition.
-
2026-04-07price $35,000 290-char remark
Show marketing remark (290 chars)
Great investment opportunity in Jackson! This property is being sold as is and offers strong potential for investors looking to add to their rental portfolio or complete a renovation project. Located in an established area with steady rental demand. Priced accordingly to reflect condition.
-
2026-03-24$38,000 Active 290-char remark
Show marketing remark (290 chars)
Great investment opportunity in Jackson! This property is being sold as is and offers strong potential for investors looking to add to their rental portfolio or complete a renovation project. Located in an established area with steady rental demand. Priced accordingly to reflect condition.
-
2016-02-04soldstatus
-
2015-03-13soldstatus
-
1989-03-03soldstatus
-
1984-12-04soldstatus
-
1983-12-30soldstatus
-
1973-01-31soldstatus
ⓘ Source: listings_history table (triggers on properties + properties_extension) + one-shot
backfill from property_details.listing_events for pre-trigger history.
Tax reassessment forecast MS · Resets to sale price
- Current annual tax
- $589 · $49/mo
- Projected year-2 tax
- $589 · $49/mo
- Expected delta
- $0/yr ($0/mo · 0.0%)
ⓘ Screening estimate from a state-policy table — verify with the county assessor before closing.
Climate risk First Street
- Flood 6/10 Major FEMA zone X (unshaded) · 74% chance over 30 yrs
- Wildfire 1/10 Low
- Heat 7/10 Severe 7 d/yr ≥109°F today · 20 d/yr by 30 yrs out
- Wind 8/10 Severe 80% chance of damaging wind over 30 yrs
- Air quality 1/10 Low 0 unhealthy d/yr today · 0 by 30 yrs out
Nearby sold comps map
Loading sold comps map…
Walkable amenities ~0.75 mi
Loading nearby amenities…
Taxation est. · year 1
- Rental income
- $12,609
- − Mortgage interest
- −$1,400
- − Property taxes
- −$589
- − Insurance
- −$125
- − Repairs & maintenance
- −$1,009
- − Management
- −$1,009
- − Depreciation
- −$727
- Taxable income
- $7,750
- Est. tax owed @ 24.0%
- −$1,860
- After-tax cash flow
- $5,814/yr
For passive investors: Depreciation is non-cash, so a rental often shows a tax loss while cash-flowing — sheltering income. Rental losses are passive: they offset passive income freely, and up to $25,000/yr can offset ordinary (W-2) income if you actively participate and your MAGI is under $100k (phasing out to $0 by $150k); unused losses carry forward. On sale, claimed depreciation is recaptured at up to 25%, and gains may owe capital-gains tax (a 1031 exchange can defer both). Figures are a year-1 estimate at your 24.0% rate — not tax advice; consult a CPA.
Schools (NCES district)
- District
- Jackson Public School District
- NCES district ID
- 2802190
- Math proficiency
- 9% ▼ -14.00%
- Reading proficiency
- 18% ▼ -7.00%
- Median HH income
- $33,234
- Composite
- 10.89/100
- National rank
- #9755
- State rank
- #112 of 130 in MS
Livability — Jackson
- Score
- 68/100
- State rank
- #66
- US rank
- #9695
Category grades
Schools grade is shown separately in the Schools card above.
Census & demographics
- Census place
- Jackson, MS
- City population
- 140,204
- Population (ZIP)
- 4,803
Population outlook (Hinds County) Hauer SSP2
- Today (2025)
- 242,528 people
- By 2030
- 241,113 · -0.6%
- By 2040
- 235,557 · -2.9%
- By 2050
- 226,946 · -6.4%
- By 2075
- 199,995 · -17.5%
- By 2100
- 164,165 · -32.3%
Race, ethnicity, and origin ACS 2023
- Neighborhood character
- Predominantly Black (94%)
- Race & ethnicity
- Black 94% White 4% Two or more races 1%
- Foreign-born
- 1%
- Languages at home
- 98% English-only · Spanish 2%
Political lean MEDSL · Hinds
- 2024 margin
- Solid D (+46.1) · D 72.4% · R 26.3% · Other 1.4%
- 2008→2024 swing
- +7.1pp toward D · 2008: 39.0pp · 2024: 46.1pp
- All cycles
- 2024: D+46.1 2020: D+48.3 2016: D+43.7 2012: D+45.1 2008: D+39.0
Not yet ingested
- Civics
- —
Market trends
- HPI YoY
- ▲ 0.80%
- Current HPI
- 130.2184
- Rent YoY
- —
- Metro
- —
- State GDP YoY
- —
- F500 in state
- 0
Price history
-34.2% since first listed10 events — show timeline
- 2026-04-29 Price Changed $25,000 MLSU
- 2026-04-20 Price Changed $29,500 MLSU
- 2026-04-07 Price Changed $35,000 MLSU
- 2026-03-24 Listed $38,000 MLSU
- 2016-02-04 Sold (Public Records) — Public Records
- 2015-03-13 Sold (Public Records) — Public Records
- 1989-03-03 Sold (Public Records) — Public Records
- 1984-12-04 Sold (Public Records) — Public Records
- 1983-12-30 Sold (Public Records) — Public Records
- 1973-01-31 Sold (Public Records) — Public Records
Property tax history
+1.0%/yrLatest (2025): $589 · +0.9% YoY. Source: county tax records.
Cash-flow waterfall
monthlySold comps — $/sqft
last 12 mo · ≤1 miLoading sold comps…