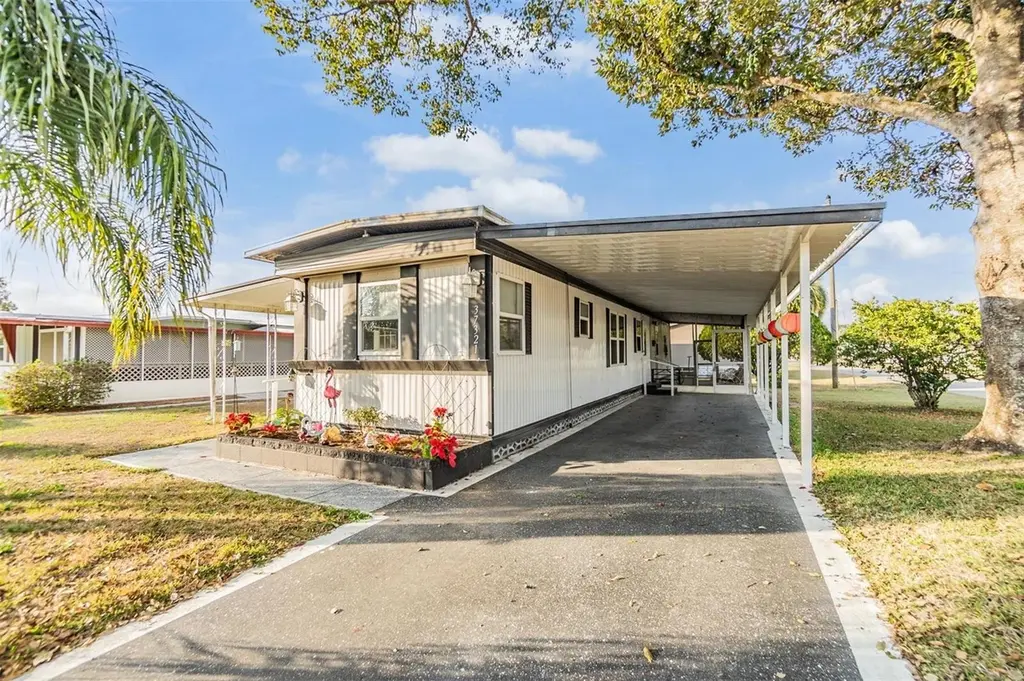
37321 8th Ave · Zephyrhills West, FL
Flood risk 1/10 · Minimal
- FEMA flood zone
- X (unshaded)
- Chance of flooding over 30 yrs
- 0.0%
- Est. flood insurance / yr
- $507 – $1,088
Fire risk 4/10 · Minor
- Est. fire insurance / yr
- $947 – $1,759
Heat risk 9/10 · Severe
- Hot days now (above 108°F)
- 7 days/yr
- Hot days in 30 yrs
- 24 days/yr
Wind risk 9/10 · Severe
- Chance of severe wind over 30 yrs
- 99.0%
Air-quality risk 2/10 · Minimal
- Unhealthy air days now
- 1 days/yr
- Unhealthy air days in 30 yrs
- 2 days/yr
Risk factors via First Street. Map © Google.
Why this score? — see what drove the D+ grade
The composite is a weighted blend of 9 inputs, each scored 0–100. Each bar is that input's sub-score; the figure is the points it added to the 100-point composite (weight × sub-score).
- Cash flow +21.2/30.0
- DSCR +6.7/10.0
- 1% rule +5.9/10.0
- Schools +4.3/10.0
- Livability +3.1/5.0
- Condition / age +2.5/5.0
- Rent growth +1.6/5.0
- ARV discount +0.0/15.0
- Appreciation +0.0/10.0
$114,900
🖨 Deal sheet 📄 Offer letter ✓ Due diligence
Listing remarks
Welcome to Betmar Acres, an active 55+ golf community where you OWN the land for a low annual fee of just $448—your perfect winter retreat or forever home in sunny Florida! This beautifully upgraded 2BR/1.5BA home offers exceptional curb appeal and a move-in ready interior designed for both comfort and entertaining. Step inside to an inviting open-concept layout featuring custom flooring and a thoughtfully updated kitchen complete with stone countertops, stainless steel appliances, and plenty of space to gather with family and friends. Both bathrooms have been tastefully remodeled with modern finishes, including stone vanity tops and a custom-tiled step-in shower that adds a touch of
Key facts
- Stone countertops
- Updated kitchen
- Custom tiled shower
Tags
Property features AI
Finance
- Other: Total building area reported in public records; Living area reported as estimated
- Financial info: Partially furnished; Lease restrictions apply
- HOA & community: Has HOA (monthly fee $37.33; annual $448); Association amenities include: clubhouse, pool, spa/hot tub, tennis courts, pickleball courts, basketball court, shuffleboard court, golf course and golf, trails, recreation facilities, security, optional additional fees; Association fee covers common area taxes and security; Deed restrictions; Golf carts allowed; Street lights; Senior community; Pets allowed; Association fee required
Exterior
- Parking: Covered parking; Driveway; 2-space carport
- Security: Community security
- Utilities: Public water; Public sewer; Electricity connected; Sewer connected; Water connected; Cable available; Broadband/high-speed internet available
- Home design: Mobile home (single wide); Residential property; One story; South-facing entry
- Construction: Metal siding; Metal roof; Roof over; Crawlspace foundation; Built in 1 story
- Exterior features: Enclosed patio; Patio; Side porch; Rain gutters; Outdoor storage; Workshop; Mature landscaping; Corner lot; Level lot; Paved; Public maintained road; Asphalt/paved road surface
Interior
- Kitchen: Range; Microwave; Refrigerator; Electric water heater
- Bedrooms: 2 bedrooms
- Flooring: Laminate; Vinyl
- Bathrooms: 1 full bath; 1 half bath
- Heating & cooling: Central heating (electric); Central air conditioning
- Interior features: Built-in features; Open floorplan; Living room/dining room combo; Window treatments; Double-pane windows; Storage rooms
- Laundry & utility: Washer; Dryer; Laundry room (outside)
Neighborhood map
What this means for you Summary
Snapshot
- This is a 2-bed/2.0-bath manufactured listed at $115k.
Deal economics
- At list price, monthly cash flow is $165 ($2k/yr) — positive.
- The deal already cash-flows at list — no discount required.
- Meets the 1% rule at list price ($1k rent vs $115k).
- Recommended offer: $108k (6.0% below list) — sets the bar for market timing.
Location & tenants
- Location reads 61/100 on livability (#772 in FL) — a middle-class / working-renter tenant base. Strengths: cost of living A+, housing A+; Watch: schools D-, amenities F, commute F.
- Pasco (suburban): math 50% / reading 52% proficiency, ranked #32 of 73 in FL (top 44%) — acceptable for families but not a draw, mixed tenant base, ~2y average lease.
- Market conditions: Rents falling (-3.6%/yr); 294 active listings in the ZIP; 18 comparable units currently listed for rent nearby; rentals at typical pace (median 24d on market — plan ~3-4 weeks tenant-placement turnaround); 6,765 units permitted in Pasco County in 2024 (1,250 in 5+ unit buildings).
- This rent runs 31% of the median local income ($49k/yr) — at the standard rent-burdened threshold; future hikes will face affordability resistance.
Forward outlook
- Local home prices are declining (-3.0%/yr); year-one equity from $794 of loan paydown is wiped out by about $3k of value loss. Plan a longer hold.
- Pasco County population projected at +29% by 2050 — long-run rental-demand tailwind backs the buy-and-hold thesis.
Negotiation context
- It's been on market 77 days — a 6% lower offer ($108k) is reasonable based on typical stale-listing flexibility.
- 2 sale attempts; this cycle's ask has dropped $10k (8%) from the opening price — seller is motivated, your offer sets the floor, not the list.
- Current owner paid $25k; list at $115k implies a 360% gain — meaningful room to come down on a strong offer.
Risks & watch-outs
- Climate carrying-cost: severe wind risk, 99% chance of damaging wind over 30y; extreme-heat days projected 7→24/yr by 2055 (HVAC capex compounding) — expect insurance premiums to compound above CPI over the hold.
Questions for the listing agent
- It's been on market 77 days. Have you received any prior offers? Is the seller open to a 6% concession, seller financing, or rate buy-down credit?
- Built in 1970 — when were the roof, HVAC, electrical panel, plumbing, and water heater last replaced?
- What does the HOA fee cover, when was the last increase, and are there any pending special assessments or reserve-fund shortfalls?
- Why hasn't it sold? Are there any deal-killer items the seller is aware of (foundation, flood, title, zoning, code violations)?
- Is there a deadline driving the sale (1031 exchange, divorce, estate, relocation)? That informs how much negotiation room exists.
- Schools are D-rated, which usually means shorter tenancies and higher turnover. Who's the typical renter profile here, and what's been the actual vacancy rate?
- The area grade is low — what's the realistic commute time and amenity access for the typical tenant pool here? Any planned neighborhood developments (good or bad) we should know about?
- What's the average days-on-market for RENTAL listings here right now (not sales)? A rising rental-DOM trend means longer vacancies and softer asking-rent achievability than the comps imply.
- What's the recent tenant-quality profile in this submarket — average credit score on applications, eviction rate, late-payment / NSF rate, and stable-employment percentage? A property-management company in the area should have these aggregated.
- How much new for-sale + rental construction is in the pipeline within 1–3 miles? Heavy new supply typically softens prices + rents 12–24 months out; constrained supply supports both.
Investment metrics
- 1% rule
- 1.09% ✓
- Cap rate
- 8.02%
- Cash-on-cash
- 6.17%
- DSCR
- 1.27
- GRM
- 7.6
CMA / ARV
- ARV (on-the-fly)
- $78,540
- Comps found
- 12
Show comp detail 12 sales within ~0.75 mi
| Address | Dist | Beds/Ba | Sqft | Sold | Price | $/sf | Match |
|---|---|---|---|---|---|---|---|
| 5241 Bolton Dr | 0.07mi | 2/1.0 | 672 (+2%) | 6mo | $80,000 | $119 | 84 |
| 37113 Lois Ave | 0.23mi | 2/1.0 | 672 (+2%) | 3mo | $75,000 | $112 | 80 |
| 37137 Lois Ave | 0.19mi | 2/1.5 | 684 (+4%) | 4mo | $66,000 | $96 | 80 |
| 37112 Sandra Ave | 0.22mi | 2/1.5 | 664 (+1%) | 8mo | $70,000 | $105 | 80 |
| 37302 Carol Ave | 0.16mi | 1/1.0 (-1) | 684 (+4%) | 7mo | $55,000 | $80 | 72 |
| 37020 Lois Ave | 0.33mi | 2/1.0 | 624 (-6%) | 2mo | $73,000 | $117 | 70 |
| 5400 Amanda St | 0.36mi | 2/1.0 | 672 (+2%) | 8mo | $105,000 | $156 | 69 |
| 5251 Flint St | 0.13mi | 2/1.0 | 600 (-9%) | 8mo | $125,000 | $208 | 68 |
| 37031 Karen Ave | 0.32mi | 2/1.5 | 720 (+9%) | 1mo | $92,000 | $128 | 67 |
| 37042 Lois Ave | 0.29mi | 2/2.0 | 748 (+13%) | 8mo | $95,000 | $127 | 58 |
| 4833 Royal Palm Dr | 0.73mi | 2/1.0 | 672 (+2%) | 2mo | $78,000 | $116 | 58 |
| 37105 Lois Ave | 0.24mi | 2/1.0 | 744 (+13%) | 12mo | $96,000 | $129 | 54 |
Match score weights: distance 35% · size 25% · config 20% · recency 20%. Top-matched comps best support the ARV.
Projected returns pro-forma
-3.0% appreciation · 0.0% rent growth · sell at horizon
- IRR
- -10.3%
- Equity multiple
- 0.64×
- Total profit
- $-11,714
- Equity at exit
- $17,132
- IRR
- -6.0%
- Equity multiple
- 0.67×
- Total profit
- $-10,672
- Equity at exit
- $9,934
Cash invested: $32,172 (down + closing). Projections, not guarantees.
Landlord ↔ Tenant lean methodology
- Overall (STATE)
- 87 Strongly Landlord-Friendly
- State Florida
- 87 Strongly Landlord-Friendly · R+3
- County
- — inherits STATE
- City
- — inherits STATE
ZIP-level market 33542
- Home prices YoY
- -20.6%
- Rents YoY
- -3.6%
- Active inventory
- 294
- Price-to-rent
- 7.6×
Monthly cashflow live
- Estimated rent
- $1,254 high interval (Pro) →
- Mortgage (P&I)
- −$603
- Tax from tax record
- −$137 /mo · $1,649/yr
- Insurance
- −$48
- HOA
- −$37
- Vacancy / Maint / Mgmt
- −$263
- Net cashflow
- $165
Break-even live
UW: 25.0% down · 7.5% · 30yr · 1.5% tax · 5.0% vac · 8.0% maint · 8.0% mgmt
Financing live
Cash to close
- Down payment
- $28,725
- Closing costs
- $3,447
- Reserves months
- —
- Total cash needed
- —
Loan-product check · same deal, 3 products live
Conventional
25% down · 7.5% · 30yr
- Down + closing
- —
- Monthly P&I
- —
- Monthly cashflow
- —
- DSCR
- —
- Eligible?
- —
Personal DTI + credit; lowest rate.
DSCR
20% down · 8.5% · 30yr
- Down + closing
- —
- Monthly P&I
- —
- Monthly cashflow
- —
- DSCR
- —
- Eligible?
- —
No personal income docs; deal must DSCR.
Hard money
10% down · 12.0% · 12mo
- Down + closing
- —
- Monthly P&I
- —
- Monthly cashflow
- —
- DSCR
- —
- Eligible?
- —
Short-term bridge; refi at stabilization.
Rent comps 18 comps
| Address | Beds | Baths | Sqft | Rent | $/sqft | DOM | Units | Dist |
|---|---|---|---|---|---|---|---|---|
| 5168 Crooked Ln Zephyrhills, FL | 2.0 | 1.0 | 600 | $1,645 | $2.74 | 21d | 1 | 0.41mi |
| 5611 1st St Zephyrhills, FL | 1.0 | 1.0 | 600 | $1,095 | $1.82 | 16d | 1 | 0.69mi |
| 4833 Royal Palm Dr Zephyrhills, FL | 2.0 | 1.0 | 672 | $1,090 | $1.62 | 24d | 1 | 0.72mi |
| 38044 6th Ave Unit 38044 Zephyrhills, FL | 1.0 | 1.0 | 494 | $950 | $1.92 | 24d | 1 | 0.75mi |
| 38010 14th Ave Apt 3 Zephyrhills, FL | 1.0 | 1.0 | 537 | $1,195 | $2.23 | 24d | 1 | 0.83mi |
| 37925 Date Palm Dr Zephyrhills, FL | 3.0 | 1.5 | 720 | $1,300 | $1.81 | 24d | 1 | 0.93mi |
| 5150 6th St Zephyrhills, FL | 1.0 | 1.0 | 600 | $925 | $1.54 | 24d | 1 | 1.03mi |
| 6302 Abbott Station Dr Zephyrhills, FL | 3.0 | 1.0–2.5 | 855 | $1,732 | $2.02 | 1d | 142 | 1.04mi |
| 5426 8th St #1 Zephyrhills, FL | 1.0 | 1.0 | 432 | $1,150 | $2.66 | 24d | 1 | 1.12mi |
| 5208 7th St Zephyrhills, FL | 1.0 | 1.0 | 550 | $950 | $1.73 | 5d | 1 | 1.14mi |
| 5214 7th St Zephyrhills, FL | 1.0 | 1.0 | 550 | $950 | $1.73 | 5d | 1 | 1.14mi |
| 5214 7th St Zephyrhills, FL | 1.0 | 1.0 | 550 | $1,100 | $2.00 | 16d | 1 | 1.14mi |
| 5206 7th St Zephyrhills, FL | 1.0 | 1.0 | 550 | $950 | $1.73 | 5d | 1 | 1.15mi |
| 4412 Plum St Zephyrhills, FL | 1.0 | 1.0 | 624 | $1,100 | $1.76 | 24d | 1 | 1.30mi |
| 4410 Plum St Zephyrhills, FL | 1.0 | 1.0 | 624 | $1,100 | $1.76 | 24d | 1 | 1.30mi |
| 6052 10th St Zephyrhills, FL | 2.0 | 1.0 | 644 | $1,200 | $1.86 | 24d | 1 | 1.35mi |
| 4352 6th St Zephyrhills, FL | 1.0 | 1.0 | 494 | $1,100 | $2.23 | 24d | 1 | 1.42mi |
| 5217 17th St Zephyrhills, FL | 1.0 | 1.0 | 540 | $1,050 | $1.94 | 24d | 1 | 1.48mi |
HOA detail
- Monthly dues
- $37 · $444/yr
Listing history 20 events
-
2026-06-18days on market $114,900 Active 77 DOM
-
2026-06-17days on market $114,900 Active 76 DOM
-
2026-06-16days on market $114,900 Active 75 DOM
-
2026-06-15days on market $114,900 Active 74 DOM
-
2026-06-13days on market $114,900 Active 72 DOM
-
2026-06-09days on market $114,900 Active 68 DOM
-
2026-06-08days on market $114,900 Active 67 DOM
-
2026-06-07days on market $114,900 Active 66 DOM
-
2026-06-04days on market $114,900 Active 63 DOM
-
2026-06-03days on market $114,900 Active 62 DOM
-
2026-06-02days on market $114,900 Active 61 DOM
-
2026-06-01days on market $114,900 Active 60 DOM
-
2026-05-31days on market $114,900 Active 59 DOM
-
2026-05-05price $114,900
-
2026-04-02$124,900 Active
-
2025-08-22historical
-
2025-07-16price $119,000
-
2025-03-20price $124,500
-
2025-02-05$139,500 Active
-
1999-03-08soldstatus $25,000
ⓘ Source: listings_history table (triggers on properties + properties_extension) + one-shot
backfill from property_details.listing_events for pre-trigger history.
Tax reassessment forecast FL · Resets to sale price
- Current annual tax
- $1,649 · $137/mo
- Projected year-2 tax
- $1,649 · $137/mo
- Expected delta
- $0/yr ($0/mo · 0.0%)
ⓘ Screening estimate from a state-policy table — verify with the county assessor before closing.
Climate risk First Street
- Flood 1/10 Low FEMA zone X (unshaded) · 0% chance over 30 yrs
- Wildfire 4/10 Moderate
- Heat 9/10 Extreme 7 d/yr ≥108°F today · 24 d/yr by 30 yrs out
- Wind 9/10 Extreme 99% chance of damaging wind over 30 yrs
- Air quality 2/10 Low 1 unhealthy d/yr today · 2 by 30 yrs out
Nearby sold comps map
Loading sold comps map…
Walkable amenities ~0.75 mi
Loading nearby amenities…
Taxation est. · year 1
- Rental income
- $15,043
- − Mortgage interest
- −$6,436
- − Property taxes
- −$1,649
- − Insurance
- −$574
- − Repairs & maintenance
- −$1,203
- − Management
- −$1,203
- − HOA
- −$444
- − Depreciation
- −$3,343
- Taxable income
- $190
- Est. tax owed @ 24.0%
- −$46
- After-tax cash flow
- $1,940/yr
For passive investors: Depreciation is non-cash, so a rental often shows a tax loss while cash-flowing — sheltering income. Rental losses are passive: they offset passive income freely, and up to $25,000/yr can offset ordinary (W-2) income if you actively participate and your MAGI is under $100k (phasing out to $0 by $150k); unused losses carry forward. On sale, claimed depreciation is recaptured at up to 25%, and gains may owe capital-gains tax (a 1031 exchange can defer both). Figures are a year-1 estimate at your 24.0% rate — not tax advice; consult a CPA.
Schools (NCES district)
- District
- Pasco
- NCES district ID
- 1201530
- Math proficiency
- 50% ▼ -10.00%
- Reading proficiency
- 52% ▼ -5.00%
- Median HH income
- $45,039
- Composite
- 43.14/100
- National rank
- #3074
- State rank
- #32 of 73 in FL
Livability — Zephyrhills West
- Score
- 61/100
- State rank
- #772
- US rank
- #17403
Category grades
Schools grade is shown separately in the Schools card above.
Census & demographics
- Census place
- Zephyrhills West, FL
- County
- Pasco County · 524,098 people
- Metro
- Tampa-St. Petersburg-Clearwater, FL
- Population (ZIP)
- 23,612
- Household income
- $49,316
- Rent vs Own
- Severe rent burden
- 831.0
Population outlook (Pasco County) Hauer SSP2
- Today (2025)
- 570,045 people
- By 2030
- 605,844 · +6.3%
- By 2040
- 674,806 · +18.4%
- By 2050
- 736,022 · +29.1%
- By 2075
- 862,900 · +51.4%
- By 2100
- 906,364 · +59.0%
Race, ethnicity, and origin ACS 2023
- Neighborhood character
- Predominantly White (76%)
- Race & ethnicity
- White 76% Hispanic / Latino 17% Two or more races 8% Black 4% Asian 1%
- Hispanic origin (detail)
- Mexican 2% Puerto Rican 10%
- Common ancestry
- Lithuanian 3% Romanian 2% Iranian 2%
- Foreign-born
- 5% · Canada, Jamaica
- Languages at home
- 86% English-only · Spanish 12% Other Indo-European 1% Russian/Polish/Slavic 1%
Political lean MEDSL · Pasco
- 2024 margin
- Strong R (+25.2) · D 36.9% · R 62.1% · Other 1.0%
- 2008→2024 swing
- -21.6pp toward R · 2008: -3.6pp · 2024: -25.2pp
- All cycles
- 2024: R+25.2 2020: R+20.1 2016: R+21.6 2012: R+6.7 2008: R+3.6
Not yet ingested
- Civics
- —
Market trends
- HPI YoY
- ▼ -81.25%
- Current HPI
- 313.3993
- Rent YoY
- ▼ -3.56%
- Metro
- Tampa-St. Petersburg-Clearwater, FL
- State GDP YoY
- ▲ 3.28%
- F500 in state
- 36
Industry mix (Fortune 500 HQ in FL)
| Industry | F500 HQs | Revenue |
|---|---|---|
| Industrial Technology | 2 | $29B |
|
||
| Insurance | 2 | $17B |
|
||
| Retail | 1 | $60B |
|
||
| Technology Distribution | 1 | $58B |
|
||
| Homebuilding | 1 | $35B |
|
||
| Technology Manufacturing | 1 | $35B |
|
||
Price history
+359.6% since first listed7 events — show timeline
- 2026-05-05 Price Changed $114,900 Stellar MLS as Distributed by MLS Grid
- 2026-04-02 Listed $124,900 Stellar MLS as Distributed by MLS Grid
- 2025-08-22 Listing Removed — Stellar MLS as Distributed by MLS Grid
- 2025-07-16 Price Changed $119,000 Stellar MLS as Distributed by MLS Grid
- 2025-03-20 Price Changed $124,500 Stellar MLS as Distributed by MLS Grid
- 2025-02-05 Listed $139,500 Stellar MLS as Distributed by MLS Grid
- 1999-03-08 Sold (Public Records) $25,000 Public Records
Property tax history
+6.4%/yrLatest (2025): $1,649 · +4.9% YoY. Source: county tax records.
Cash-flow waterfall
monthlySold comps — $/sqft
last 12 mo · ≤1 miLoading sold comps…