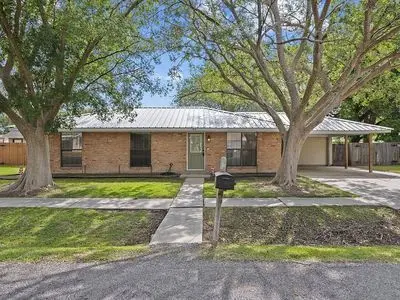
108 Trojan Pl · Broussard, LA
Flood risk 1/10 · Minimal
- FEMA flood zone
- X (unshaded)
- Chance of flooding over 30 yrs
- 0.0%
- Est. flood insurance / yr
- $507 – $1,088
Fire risk 1/10 · Minimal
- Est. fire insurance / yr
- $1,269 – $2,357
Heat risk 9/10 · Severe
- Hot days now (above 109°F)
- 7 days/yr
- Hot days in 30 yrs
- 21 days/yr
Wind risk 9/10 · Severe
- Chance of severe wind over 30 yrs
- 99.0%
Air-quality risk 2/10 · Minimal
- Unhealthy air days now
- 0 days/yr
- Unhealthy air days in 30 yrs
- 1 days/yr
Risk factors via First Street. Map © Google.
Why this score? — see what drove the C+ grade
The composite is a weighted blend of 9 inputs, each scored 0–100. Each bar is that input's sub-score; the figure is the points it added to the 100-point composite (weight × sub-score).
- Cash flow +23.9/30.0
- ARV discount +12.8/15.0
- DSCR +7.7/10.0
- 1% rule +5.4/10.0
- Schools +3.6/10.0
- Livability +3.6/5.0
- Rent growth +2.8/5.0
- Condition / age +2.5/5.0
- Appreciation +0.0/10.0
$195,000
🖨 Deal sheet 📄 Offer letter ✓ Due diligence
Listing remarks MLS
Come and get it! This beautiful home in the well-established Aurora Park subdivision is ready to go! It features 3 gorgeous bedrooms, 2 full baths, and great living spaces! It also included a very nice fenced in back yard and a covered patio.
Key facts
- Built 1980
- Listed 37 days
Neighborhood map
What this means for you Summary
Snapshot
- This is a 3-bed/2.0-bath single-family listed at $195k.
Deal economics
- At list price, monthly cash flow is $377 ($5k/yr) — positive.
- The deal already cash-flows at list — no discount required.
- Meets the 1% rule at list price ($2k rent vs $195k).
- Recommended offer: $189k (3.0% below list) — sets the bar for market timing.
- Cap rate 8.6% vs local median 4.7% in Broussard — top-decile yield for the area; either an underpriced asset or a hidden risk that comps aren't pricing in. Stress-test before assuming the spread holds.
Location & tenants
- Location reads 71/100 on livability (#49 in LA) — a middle-class / working-renter tenant base. Strengths: housing A+, cost of living A-, schools B+; Watch: amenities F, commute F, health & safety F.
- Lafayette Parish (urban): math 38% / reading 46% proficiency, ranked #19 of 98 in LA (top 19%) — families likely to look elsewhere, expect single-tenant / working-renter base with shorter leases.
- Market conditions: Rents rising (+1.2%/yr); 464 active listings in the ZIP; 9 comparable units currently listed for rent nearby; rentals lingering (median 44d on market — plan ~5-8 weeks vacancy on turnover, expect pricing pressure); 56% of comp listings sitting > 30 days — soft ceiling on asking rent; solid renter incomes; 1,585 units permitted in Lafayette Parish in 2024 (10 in 5+ unit buildings).
Forward outlook
- Local home prices are declining (-3.0%/yr); year-one equity from $1k of loan paydown is wiped out by about $6k of value loss. Plan a longer hold.
- Lafayette County population projected at +34% by 2050 — long-run rental-demand tailwind backs the buy-and-hold thesis.
Negotiation context
- It's been on market 37 days — a 3% lower offer ($189k) is reasonable based on typical stale-listing flexibility.
- 7 sale attempts since 35y ago with the ask held roughly flat each time — persistent listings suggest the price (not the market) is what's stuck; bring a comps-based counter.
- Current owner paid $154k; 27% above their basis — modest negotiation headroom, anchor on the comps not their cost.
Risks & watch-outs
- Climate carrying-cost: severe wind risk, 99% chance of damaging wind over 30y; extreme-heat days projected 7→21/yr by 2055 (HVAC capex compounding) — expect insurance premiums to compound above CPI over the hold.
Questions for the listing agent
- It's been on market 37 days. Have you received any prior offers? Is the seller open to a 3% concession, seller financing, or rate buy-down credit?
- Is there a deadline driving the sale (1031 exchange, divorce, estate, relocation)? That informs how much negotiation room exists.
- Schools are B-rated — typically a magnet for longer-tenancy family renters. What's the average tenant stay here, and is there a school-zone premium baked into asking?
- What's the average days-on-market for RENTAL listings here right now (not sales)? A rising rental-DOM trend means longer vacancies and softer asking-rent achievability than the comps imply.
- What's the recent tenant-quality profile in this submarket — average credit score on applications, eviction rate, late-payment / NSF rate, and stable-employment percentage? A property-management company in the area should have these aggregated.
- How much new for-sale + rental construction is in the pipeline within 1–3 miles? Heavy new supply typically softens prices + rents 12–24 months out; constrained supply supports both.
Investment metrics
- 1% rule
- 1.04% ✓
- Cap rate
- 8.61%
- Cash-on-cash
- 8.28%
- DSCR
- 1.37
- GRM
- 8.0
CMA / ARV
- ARV (on-the-fly)
- $220,860
- Comps found
- 12
Show comp detail 12 sales within ~0.75 mi
| Address | Dist | Beds/Ba | Sqft | Sold | Price | $/sf | Match |
|---|---|---|---|---|---|---|---|
| 213 Lynn Dr | 0.33mi | 3/2.0 | 1,633 (-0%) | 2mo | $190,000 | $116 | 83 |
| 144 Gordon Crocket Dr | 0.20mi | 3/2.0 | 1,726 (+6%) | 4mo | $195,000 | $113 | 78 |
| 408 Mosser Dr | 0.25mi | 3/2.0 | 1,702 (+4%) | 4mo | $229,000 | $135 | 78 |
| 102 Whipple Ave | 0.30mi | 4/2.0 (+1) | 1,655 (+1%) | 2mo | $208,000 | $126 | 77 |
| 102 Patricia Ann Pl | 0.47mi | 3/2.0 | 1,623 (-1%) | 2mo | $220,500 | $136 | 75 |
| 106 Patricia Ann Pl | 0.46mi | 3/2.0 | 1,591 (-3%) | 8mo | $194,500 | $122 | 68 |
| 107 Brigante Pl | 0.44mi | 3/2.0 | 1,505 (-8%) | 5mo | $187,000 | $124 | 62 |
| 207 Fairwood Dr | 0.75mi | 3/2.0 | 1,650 (+1%) | 6mo | $285,000 | $173 | 58 |
| 901 Carriage Light Loop | 0.68mi | 2/2.0 (-1) | 1,699 (+4%) | 3mo | $172,000 | $101 | 54 |
| 213 Tennyson Dr | 0.68mi | 4/2.0 (+1) | 1,684 (+3%) | 6mo | $300,000 | $178 | 54 |
| 123 Sparrowhawk St | 0.74mi | 3/2.0 | 1,735 (+6%) | 5mo | $259,000 | $149 | 52 |
| 120 Sparrowhawk St | 0.71mi | 3/2.0 | 1,825 (+12%) | 1mo | $265,000 | $145 | 47 |
Match score weights: distance 35% · size 25% · config 20% · recency 20%. Top-matched comps best support the ARV.
Projected returns pro-forma
-3.0% appreciation · 1.23% rent growth · sell at horizon
- IRR
- -5.6%
- Equity multiple
- 0.80×
- Total profit
- $-11,185
- Equity at exit
- $29,075
- IRR
- 1.9%
- Equity multiple
- 1.13×
- Total profit
- $6,961
- Equity at exit
- $16,860
Cash invested: $54,600 (down + closing). Projections, not guarantees.
Landlord ↔ Tenant lean methodology
- Overall (STATE)
- 90 Strongly Landlord-Friendly
- State Louisiana
- 90 Strongly Landlord-Friendly · R+12
- County
- — inherits STATE
- City
- — inherits STATE
ZIP-level market 70508
- Home prices YoY
- -34.7%
- Rents YoY
- 1.2%
- Active inventory
- 464
- Price-to-rent
- 8.0×
Monthly cashflow live
- Estimated rent
- $2,021 high interval (Pro) →
- Mortgage (P&I)
- −$1,023
- Tax from tax record
- −$116 /mo · $1,391/yr
- Insurance
- −$81
- HOA
- −$0
- Vacancy / Maint / Mgmt
- −$424
- Net cashflow
- $377
Break-even live
UW: 25.0% down · 7.5% · 30yr · 1.5% tax · 5.0% vac · 8.0% maint · 8.0% mgmt
Financing live
Cash to close
- Down payment
- $48,750
- Closing costs
- $5,850
- Reserves months
- —
- Total cash needed
- —
Loan-product check · same deal, 3 products live
Conventional
25% down · 7.5% · 30yr
- Down + closing
- —
- Monthly P&I
- —
- Monthly cashflow
- —
- DSCR
- —
- Eligible?
- —
Personal DTI + credit; lowest rate.
DSCR
20% down · 8.5% · 30yr
- Down + closing
- —
- Monthly P&I
- —
- Monthly cashflow
- —
- DSCR
- —
- Eligible?
- —
No personal income docs; deal must DSCR.
Hard money
10% down · 12.0% · 12mo
- Down + closing
- —
- Monthly P&I
- —
- Monthly cashflow
- —
- DSCR
- —
- Eligible?
- —
Short-term bridge; refi at stabilization.
Rent comps 9 comps
| Address | Beds | Baths | Sqft | Rent | $/sqft | DOM | Units | Dist |
|---|---|---|---|---|---|---|---|---|
| 200 Tennyson Dr Broussard, LA | 3.0 | 2.5 | 1843 | $2,300 | $1.25 | 13d | 1 | 0.66mi |
| 200 Tennyson Dr Broussard, LA | 3.0 | 2.0 | 1843 | $2,495 | $1.35 | 43d | 1 | 0.66mi |
| 126 Heathwood Dr Broussard, LA | 4.0 | 3.0 | 1989 | $2,500 | $1.26 | 43d | 1 | 0.74mi |
| 106 Clearwater Dr Broussard, LA | 3.0 | 2.5 | 1838 | $2,200 | $1.20 | 21d | 1 | 0.78mi |
| 620 W Main St Broussard, LA | 3.0 | 2.0 | 1587 | $1,600 | $1.01 | 43d | 1 | 0.99mi |
| 404 Sparrowhawk St Broussard, LA | 3.0 | 2.0 | 1825 | $2,200 | $1.21 | 13d | 1 | 0.99mi |
| 304 Barataria Bay Pt Lafayette, LA | 3.0 | 2.5 | 1712 | $1,800 | $1.05 | 43d | 1 | 1.30mi |
| 303 Barataria Bay Pt Lafayette, LA | 3.0 | 2.5 | 1556 | $1,850 | $1.19 | 13d | 1 | 1.31mi |
| 104 Avalon St Lafayette, LA | 3.0 | 2.0 | 1895 | $1,800 | $0.95 | 43d | 1 | 1.41mi |
Listing history 34 events
-
2026-06-18days on market $195,000 Active 37 DOM
-
2026-06-17days on market $195,000 Active 36 DOM
-
2026-06-16days on market $195,000 Active 35 DOM
-
2026-06-15days on market $195,000 Active 34 DOM
-
2026-06-14days on market $195,000 Active 32 DOM
-
2026-06-13days on market $195,000 Active 31 DOM
-
2026-06-10days on market $195,000 Active 29 DOM
-
2026-06-09days on market $195,000 Active 28 DOM
-
2026-06-08days on market $195,000 Active 27 DOM
-
2026-06-07days on market $195,000 Active 26 DOM
-
2026-06-05days on market $195,000 Active 23 DOM
-
2026-06-03days on market $195,000 Active 22 DOM
-
2026-06-02days on market $195,000 Active 21 DOM
-
2026-06-01days on market $195,000 Active 20 DOM
-
2026-05-31days on market $195,000 Active 19 DOM
-
2026-05-30days on market $195,000 Active 18 DOM
-
2026-05-13price $195,000 602-char remark
-
2026-05-12$200,000 Active 602-char remark
-
2026-03-18soldstatus $154,000
-
2021-12-17soldstatus $170,000 242-char remark
Show marketing remark (242 chars)
Come and get it! This beautiful home in the well-established Aurora Park subdivision is ready to go! It features 3 gorgeous bedrooms, 2 full baths, and great living spaces! It also included a very nice fenced in back yard and a covered patio.
-
2021-12-17soldstatus $170,000
Show marketing remark (242 chars)
Come and get it! This beautiful home in the well-established Aurora Park subdivision is ready to go! It features 3 gorgeous bedrooms, 2 full baths, and great living spaces! It also included a very nice fenced in back yard and a covered patio.
-
2021-09-11$175,500 242-char remark
Show marketing remark (242 chars)
Come and get it! This beautiful home in the well-established Aurora Park subdivision is ready to go! It features 3 gorgeous bedrooms, 2 full baths, and great living spaces! It also included a very nice fenced in back yard and a covered patio.
-
2019-01-25soldstatus $123,425
Show marketing remark (353 chars)
Schedule your showing today for this wonderful three bedroom two bath home in the Aurora Park subdivision. The kitchen is open to a separate dining area with a large snack bar. The family will love the huge bonus room. The fenced in backyard features a covered patio, workshop, shed and a kennel. This property may qualify for Seller Financing (Vendee).
-
2018-09-21$120,000
Show marketing remark (353 chars)
Schedule your showing today for this wonderful three bedroom two bath home in the Aurora Park subdivision. The kitchen is open to a separate dining area with a large snack bar. The family will love the huge bonus room. The fenced in backyard features a covered patio, workshop, shed and a kennel. This property may qualify for Seller Financing (Vendee).
-
2015-06-17soldstatus $167,000
-
2015-06-17soldstatus $167,000
-
2015-03-07$167,900
-
2010-10-29soldstatus $146,000
-
2010-10-27soldstatus $146,000
-
2010-09-03$147,900
-
2002-03-19soldstatus $89,000
-
2002-01-04$89,900
-
1991-11-22soldstatus $50,531
-
1991-09-23$50,700
ⓘ Source: listings_history table (triggers on properties + properties_extension) + one-shot
backfill from property_details.listing_events for pre-trigger history.
Tax reassessment forecast LA · Resets to sale price
- Current annual tax
- $1,391 · $116/mo
- Projected year-2 tax
- $1,391 · $116/mo
- Expected delta
- $0/yr ($0/mo · 0.0%)
ⓘ Screening estimate from a state-policy table — verify with the county assessor before closing.
Climate risk First Street
- Flood 1/10 Low FEMA zone X (unshaded) · 0% chance over 30 yrs
- Wildfire 1/10 Low
- Heat 9/10 Extreme 7 d/yr ≥109°F today · 21 d/yr by 30 yrs out
- Wind 9/10 Extreme 99% chance of damaging wind over 30 yrs
- Air quality 2/10 Low 0 unhealthy d/yr today · 1 by 30 yrs out
Nearby sold comps map
Loading sold comps map…
Walkable amenities ~0.75 mi
Loading nearby amenities…
Taxation est. · year 1
- Rental income
- $24,252
- − Mortgage interest
- −$10,923
- − Property taxes
- −$1,391
- − Insurance
- −$975
- − Repairs & maintenance
- −$1,940
- − Management
- −$1,940
- − Depreciation
- −$5,673
- Taxable income
- $1,410
- Est. tax owed @ 24.0%
- −$338
- After-tax cash flow
- $4,183/yr
For passive investors: Depreciation is non-cash, so a rental often shows a tax loss while cash-flowing — sheltering income. Rental losses are passive: they offset passive income freely, and up to $25,000/yr can offset ordinary (W-2) income if you actively participate and your MAGI is under $100k (phasing out to $0 by $150k); unused losses carry forward. On sale, claimed depreciation is recaptured at up to 25%, and gains may owe capital-gains tax (a 1031 exchange can defer both). Figures are a year-1 estimate at your 24.0% rate — not tax advice; consult a CPA.
Schools (NCES district)
- District
- Lafayette Parish
- NCES district ID
- 2200870
- Math proficiency
- 38% ▼ -32.00%
- Reading proficiency
- 46% ▼ -24.00%
- Median HH income
- $50,238
- Composite
- 36.15/100
- National rank
- #4741
- State rank
- #19 of 98 in LA
Livability — Broussard
- Score
- 71/100
- State rank
- #49
- US rank
- #7184
Category grades
Schools grade is shown separately in the Schools card above.
Census & demographics
- County
- Lafayette Parish · 207,544 people
- City population
- 17,263
- Metro
- Lafayette, LA
- Population (ZIP)
- 40,592
- Household income
- $86,005
- Rent vs Own
- Severe rent burden
- 1860.0
Population outlook (Lafayette County) Hauer SSP2
- Today (2025)
- 280,930 people
- By 2030
- 301,092 · +7.2%
- By 2040
- 339,456 · +20.8%
- By 2050
- 375,156 · +33.5%
- By 2075
- 451,672 · +60.8%
- By 2100
- 497,203 · +77.0%
Race, ethnicity, and origin ACS 2023
- Neighborhood character
- Predominantly White (75%)
- Race & ethnicity
- White 75% Black 13% Two or more races 7% Hispanic / Latino 5% Asian 3%
- Common ancestry
- Lithuanian 20% Slovak 2% Italian 1%
- Foreign-born
- 5% · Canada, China
- Languages at home
- 91% English-only · Spanish 3% French/Haitian/Cajun 2% Other Indo-European 1%
Political lean MEDSL · Lafayette
- 2024 margin
- Solid R (+31.4) · D 33.5% · R 64.8% · Other 1.7%
- 2008→2024 swing
- -0.1pp no change · 2008: -31.3pp · 2024: -31.4pp
- All cycles
- 2024: R+31.4 2020: R+28.7 2016: R+33.6 2012: R+33.7 2008: R+31.3
Not yet ingested
- Civics
- —
Market trends
- HPI YoY
- ▼ -76.28%
- Current HPI
- 143.6305
- Rent YoY
- ▲ 1.23%
- Metro
- Lafayette, LA
- State GDP YoY
- ▲ 3.29%
- F500 in state
- 10
Industry mix (Fortune 500 HQ in LA)
| Industry | F500 HQs | Revenue |
|---|---|---|
| Telecommunications | 2 | $23B |
|
||
| Utilities | 1 | $12B |
|
||
| Wholesale / Distribution | 1 | $5B |
|
||
| Advertising | 1 | $2B |
|
||
Price history
+284.6% since first listed18 events — show timeline
- 2026-05-13 Price Changed $195,000 FSBO.com
- 2026-05-12 Listed $200,000 FSBO.com
- 2026-03-18 Sold (Public Records) $154,000 Public Records
- 2021-12-17 Sold (Public Records) $170,000 Public Records
- 2021-12-17 Sold (MLS) $170,000 AcadianaMLS
- 2021-09-11 Listed $175,500 AcadianaMLS
- 2019-01-25 Sold (MLS) $123,425 AcadianaMLS
- 2018-09-21 Listed $120,000 AcadianaMLS
- 2015-06-17 Sold (Public Records) $167,000 Public Records
- 2015-06-17 Sold (MLS) $167,000 AcadianaMLS
- 2015-03-07 Listed $167,900 AcadianaMLS
- 2010-10-29 Sold (Public Records) $146,000 Public Records
- 2010-10-27 Sold (MLS) $146,000 AcadianaMLS
- 2010-09-03 Listed $147,900 AcadianaMLS
- 2002-03-19 Sold (MLS) $89,000 AcadianaMLS
- 2002-01-04 Listed $89,900 AcadianaMLS
- 1991-11-22 Sold (MLS) $50,531 AcadianaMLS
- 1991-09-23 Listed $50,700 AcadianaMLS
Property tax history
+3.3%/yrLatest (2025): $1,391 · -1.3% YoY. Source: county tax records.
Cash-flow waterfall
monthlySold comps — $/sqft
last 12 mo · ≤1 miLoading sold comps…