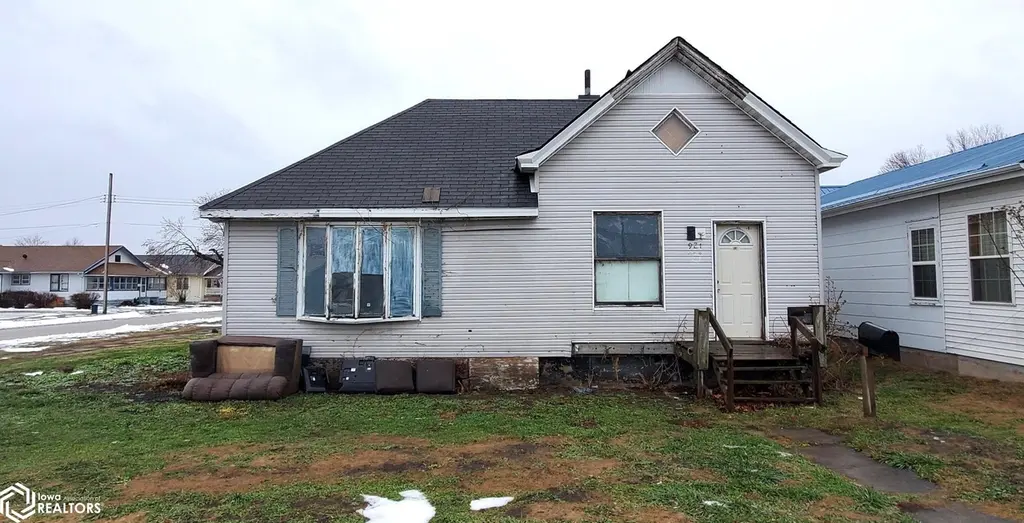
921 23rd St · Fort Madison, IA
Flood risk 3/10 · Minor
- FEMA flood zone
- X (unshaded)
- Chance of flooding over 30 yrs
- 0.1%
- Est. flood insurance / yr
- $473 – $860
Fire risk 3/10 · Minor
- Est. fire insurance / yr
- $902 – $1,676
Heat risk 4/10 · Minor
- Hot days now (above 107°F)
- 7 days/yr
- Hot days in 30 yrs
- 16 days/yr
Wind risk 2/10 · Minimal
- Chance of severe wind over 30 yrs
- —
Air-quality risk 2/10 · Minimal
- Unhealthy air days now
- 0 days/yr
- Unhealthy air days in 30 yrs
- 1 days/yr
Risk factors via First Street. Map © Google.
Why this score? — see what drove the D+ grade
The composite is a weighted blend of 9 inputs, each scored 0–100. Each bar is that input's sub-score; the figure is the points it added to the 100-point composite (weight × sub-score).
- Cash flow +15.0/30.0
- ARV discount +7.5/15.0
- 1% rule +5.0/10.0
- DSCR +5.0/10.0
- Schools +4.8/10.0
- Livability +3.8/5.0
- Rent growth +2.5/5.0
- Condition / age +2.5/5.0
- Appreciation +0.0/10.0
$19,900
🖨 Deal sheet 📄 Offer letter ✓ Due diligence
Listing remarks MLS
This property is an excellent opportunity for fix and flip, rental, or make it your own. Clean-out is scheduled, repairs and updates are needed, but there is tons of potential, nice level corner lot with alley access, and instant equity on this bargain. Call today!
Key facts
- Alley access
- Instant equity
- Level corner lot
Tags
Neighborhood map
What this means for you Summary
Snapshot
- This is a 3-bed/2.0-bath single-family listed at $20k.
Deal economics
- At list price, monthly cash flow is $818 ($10k/yr) — positive.
- The deal already cash-flows at list — no discount required.
- Meets the 1% rule at list price ($1k rent vs $20k).
- Recommended offer: $18k (12.0% below list) — sets the bar for market timing.
- Cap rate 55.6% vs local median 5.3% in Fort Madison — top-decile yield for the area; either an underpriced asset or a hidden risk that comps aren't pricing in. Stress-test before assuming the spread holds.
Location & tenants
- Location reads 75/100 on livability (#230 in IA, #4,353 nationally) — a middle-class / working-renter tenant base. Strengths: cost of living A+, housing A+, health & safety A+; Watch: commute F, employment D-.
- Fort Madison Community School District (town): math 55% / reading 58% proficiency, ranked #260 of 289 in IA (top 90%) — acceptable for families but not a draw, mixed tenant base, ~2y average lease.
- Market conditions: 64 active listings in the ZIP; 15 units permitted in Lee County in 2024 (0 in 5+ unit buildings).
Forward outlook
- Local home prices are declining (-3.0%/yr); year-one equity from $138 of loan paydown is wiped out by about $597 of value loss. Plan a longer hold.
- Lee County population projected at -15% by 2050 — secular population decline; favor cash flow + early exit over multi-decade hold.
- At projected returns (-3.0% appreciation + 3.0% rent growth), your $6k cash investment doubles in ~1 year — after that, you're playing with house money.
Negotiation context
- It's been on market 181 days — a 12% lower offer ($18k) is reasonable based on typical stale-listing flexibility.
Risks & watch-outs
- Watch-outs: built in 1900 — expect roof / HVAC / electrical / plumbing capex.
Questions for the listing agent
- It's been on market 181 days. Have you received any prior offers? Is the seller open to a 12% concession, seller financing, or rate buy-down credit?
- Built in 1900 — when were the roof, HVAC, electrical panel, plumbing, and water heater last replaced?
- Why hasn't it sold? Are there any deal-killer items the seller is aware of (foundation, flood, title, zoning, code violations)?
- Is there a deadline driving the sale (1031 exchange, divorce, estate, relocation)? That informs how much negotiation room exists.
- Schools are B-rated — typically a magnet for longer-tenancy family renters. What's the average tenant stay here, and is there a school-zone premium baked into asking?
- The area grade is low — what's the realistic commute time and amenity access for the typical tenant pool here? Any planned neighborhood developments (good or bad) we should know about?
- What's the average days-on-market for RENTAL listings here right now (not sales)? A rising rental-DOM trend means longer vacancies and softer asking-rent achievability than the comps imply.
- What's the recent tenant-quality profile in this submarket — average credit score on applications, eviction rate, late-payment / NSF rate, and stable-employment percentage? A property-management company in the area should have these aggregated.
- How much new for-sale + rental construction is in the pipeline within 1–3 miles? Heavy new supply typically softens prices + rents 12–24 months out; constrained supply supports both.
Investment metrics
- 1% rule
- 6.08% ✓
- Cap rate
- 55.64%
- Cash-on-cash
- 176.22%
- DSCR
- 8.84
- GRM
- 1.4
CMA / ARV
- ARV (median comp)
- $96,430
- List price
- $19,900
- Delta
- -79.36%
- Verdict
- UNDERPRICED
- Comps
- 20 within 1.0 mi
Show comp detail 12 sales within ~0.75 mi
| Address | Dist | Beds/Ba | Sqft | Sold | Price | $/sf | Match |
|---|---|---|---|---|---|---|---|
| 2510 Avenue I | 0.16mi | 3/1.0 | 1,370 (-1%) | 3mo | $21,500 | $16 | 85 |
| 33 Storms Ct | 0.33mi | 3/2.5 | 1,296 (-6%) | 3mo | $148,000 | $114 | 70 |
| 2411 Avenue G | 0.23mi | 4/1.5 (+1) | 1,265 (-8%) | 6mo | $95,000 | $75 | 63 |
| 2111 Avenue J | 0.15mi | 4/2.0 (+1) | 1,566 (+13%) | 4mo | $178,000 | $114 | 63 |
| 2826 Avenue L | 0.50mi | 2/1.0 (-1) | 1,456 (+5%) | 0mo | $58,000 | $40 | 58 |
| 2614 Avenue G | 0.30mi | 2/2.0 (-1) | 1,564 (+13%) | 2mo | $125,000 | $80 | 58 |
| 1503 Avenue G | 0.75mi | 3/1.0 | 1,343 (-3%) | 5mo | $23,500 | $17 | 53 |
| 103 Cherokee Ln | 0.64mi | 3/1.5 | 1,274 (-8%) | 4mo | $154,900 | $122 | 52 |
| 28 Oak Dr | 0.52mi | 3/1.5 | 1,200 (-13%) | 1mo | $180,000 | $150 | 51 |
| 2331 Avenue A | 0.63mi | 3/1.5 | 1,208 (-12%) | 5mo | $135,000 | $112 | 43 |
| 45 Richards Dr | 0.70mi | 2/1.0 (-1) | 1,250 (-10%) | 4mo | $122,000 | $98 | 40 |
| 121 21st St | 0.58mi | 2/1.0 (-1) | 1,202 (-13%) | 5mo | $50,000 | $42 | 38 |
Match score weights: distance 35% · size 25% · config 20% · recency 20%. Top-matched comps best support the ARV.
Projected returns pro-forma
-3.0% appreciation · 3.0% rent growth · sell at horizon
- IRR
- —
- Equity multiple
- 9.78×
- Total profit
- $48,909
- Equity at exit
- $2,967
- IRR
- —
- Equity multiple
- 20.70×
- Total profit
- $109,771
- Equity at exit
- $1,721
Cash invested: $5,572 (down + closing). Projections, not guarantees.
Landlord ↔ Tenant lean methodology
- Overall (STATE)
- 83 Strongly Landlord-Friendly
- State Iowa
- 83 Strongly Landlord-Friendly · R+6
- County
- — inherits STATE
- City
- — inherits STATE
ZIP-level market 52627
- Home prices YoY
- -28.6%
- Active inventory
- 64
- Price-to-rent
- 1.4×
Monthly cashflow live
- Estimated rent
- $1,210 medium interval (Pro) →
- Mortgage (P&I)
- −$104
- Tax est. 1.5%
- −$25 /mo · $298/yr
- Insurance
- −$8
- HOA
- −$0
- Vacancy / Maint / Mgmt
- −$254
- Net cashflow
- $818
Break-even live
UW: 25.0% down · 7.5% · 30yr · 1.5% tax · 5.0% vac · 8.0% maint · 8.0% mgmt
Financing live
Cash to close
- Down payment
- $4,975
- Closing costs
- $597
- Reserves months
- —
- Total cash needed
- —
Loan-product check · same deal, 3 products live
Conventional
25% down · 7.5% · 30yr
- Down + closing
- —
- Monthly P&I
- —
- Monthly cashflow
- —
- DSCR
- —
- Eligible?
- —
Personal DTI + credit; lowest rate.
DSCR
20% down · 8.5% · 30yr
- Down + closing
- —
- Monthly P&I
- —
- Monthly cashflow
- —
- DSCR
- —
- Eligible?
- —
No personal income docs; deal must DSCR.
Hard money
10% down · 12.0% · 12mo
- Down + closing
- —
- Monthly P&I
- —
- Monthly cashflow
- —
- DSCR
- —
- Eligible?
- —
Short-term bridge; refi at stabilization.
Listing history 18 events
-
2026-06-19days on market $19,900 Active 181 DOM
-
2026-06-18days on market $19,900 Active 180 DOM
-
2026-06-17days on market $19,900 Active 179 DOM
-
2026-06-16days on market $19,900 Active 178 DOM
-
2026-06-15days on market $19,900 Active 177 DOM
-
2026-06-14days on market $19,900 Active 175 DOM
-
2026-06-12days on market $19,900 Active 174 DOM
-
2026-06-09days on market $19,900 Active 171 DOM
-
2026-06-08days on market $19,900 Active 170 DOM
-
2026-06-07days on market $19,900 Active 169 DOM
-
2026-06-07days on market $19,900 Active 168 DOM
-
2026-06-03days on market $19,900 Active 165 DOM
-
2026-06-02days on market $19,900 Active 164 DOM
-
2026-06-01days on market $19,900 Active 163 DOM
-
2026-05-31days on market $19,900 Active 162 DOM
-
2026-05-30days on market $19,900 Active 161 DOM
-
2026-05-14price $19,900 265-char remark
Show marketing remark (265 chars)
This property is an excellent opportunity for fix and flip, rental, or make it your own. Clean-out is scheduled, repairs and updates are needed, but there is tons of potential, nice level corner lot with alley access, and instant equity on this bargain. Call today!
-
2025-12-20$24,900 Active 265-char remark
Show marketing remark (265 chars)
This property is an excellent opportunity for fix and flip, rental, or make it your own. Clean-out is scheduled, repairs and updates are needed, but there is tons of potential, nice level corner lot with alley access, and instant equity on this bargain. Call today!
ⓘ Source: listings_history table (triggers on properties + properties_extension) + one-shot
backfill from property_details.listing_events for pre-trigger history.
Climate risk First Street
- Flood 3/10 Moderate FEMA zone X (unshaded) · 10% chance over 30 yrs
- Wildfire 3/10 Moderate
- Heat 4/10 Moderate 7 d/yr ≥107°F today · 16 d/yr by 30 yrs out
- Wind 2/10 Low
- Air quality 2/10 Low 0 unhealthy d/yr today · 1 by 30 yrs out
Nearby sold comps map
Loading sold comps map…
Walkable amenities ~0.75 mi
Loading nearby amenities…
Taxation est. · year 1
- Rental income
- $14,518
- − Mortgage interest
- −$1,115
- − Property taxes
- −$298
- − Insurance
- −$100
- − Repairs & maintenance
- −$1,161
- − Management
- −$1,161
- − Depreciation
- −$579
- Taxable income
- $10,104
- Est. tax owed @ 24.0%
- −$2,425
- After-tax cash flow
- $7,394/yr
For passive investors: Depreciation is non-cash, so a rental often shows a tax loss while cash-flowing — sheltering income. Rental losses are passive: they offset passive income freely, and up to $25,000/yr can offset ordinary (W-2) income if you actively participate and your MAGI is under $100k (phasing out to $0 by $150k); unused losses carry forward. On sale, claimed depreciation is recaptured at up to 25%, and gains may owe capital-gains tax (a 1031 exchange can defer both). Figures are a year-1 estimate at your 24.0% rate — not tax advice; consult a CPA.
Schools (NCES district)
- District
- Fort Madison Community School District
- NCES district ID
- 1911850
- Math proficiency
- 55% ▼ -7.00%
- Reading proficiency
- 58% ▼ -2.00%
- Median HH income
- $46,801
- Composite
- 47.87/100
- National rank
- #2218
- State rank
- #260 of 289 in IA
Livability — Fort Madison
- Score
- 75/100
- State rank
- #230
- US rank
- #4353
Category grades
Schools grade is shown separately in the Schools card above.
Census & demographics
- Census place
- Fort Madison, IA
- Population (ZIP)
- 12,585
Population outlook (Lee County) Hauer SSP2
- Today (2025)
- 33,813 people
- By 2030
- 32,835 · -2.9%
- By 2040
- 30,690 · -9.2%
- By 2050
- 28,777 · -14.9%
- By 2075
- 25,568 · -24.4%
- By 2100
- 21,983 · -35.0%
Race, ethnicity, and origin ACS 2023
- Neighborhood character
- Predominantly White (88%)
- Race & ethnicity
- White 88% Two or more races 5% Hispanic / Latino 5% Black 4%
- Common ancestry
- Slovak 2% Portuguese 1% Italian 1%
- Foreign-born
- 1%
- Languages at home
- 98% English-only · Spanish 2%
Political lean MEDSL · Lee
- 2024 margin
- Strong R (+27.8) · D 35.0% · R 62.9% · Other 2.1%
- 2008→2024 swing
- -43.8pp toward R · 2008: 16.0pp · 2024: -27.8pp
- All cycles
- 2024: R+27.8 2020: R+19.3 2016: R+16.1 2012: D+16.0 2008: D+16.0
Not yet ingested
- Civics
- —
Market trends
- HPI YoY
- ▼ -70.32%
- Current HPI
- 175.7708
- Rent YoY
- —
- Metro
- —
- State GDP YoY
- ▲ 2.48%
- F500 in state
- 4
Industry mix (Fortune 500 HQ in IA)
| Industry | F500 HQs | Revenue |
|---|---|---|
| Financial Services | 1 | $16B |
|
||
| Retail / Convenience | 1 | $15B |
|
||
Price history
-20.1% since first listed2 events — show timeline
- 2026-05-14 Price Changed $19,900 IAR
- 2025-12-20 Listed $24,900 IAR
Property tax history
+9.6%/yrLatest (2025): $2,408 · +94.5% YoY. Source: county tax records.
Cash-flow waterfall
monthlySold comps — $/sqft
last 12 mo · ≤1 miLoading sold comps…