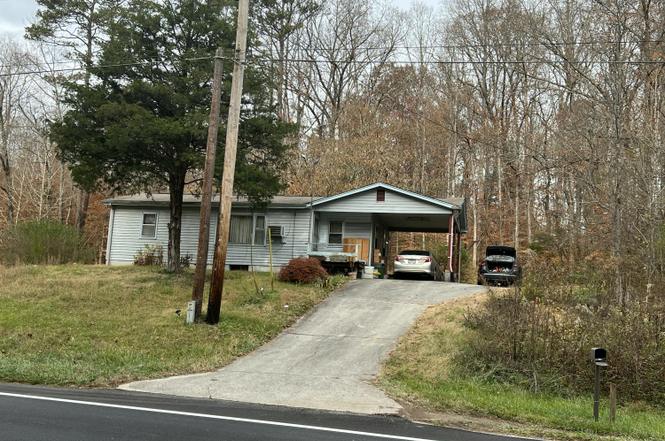
920 Oliver Springs Hwy · Oak Ridge, TN
Flood risk 1/10 · Minimal
- FEMA flood zone
- X (unshaded)
- Chance of flooding over 30 yrs
- 0.0%
- Est. flood insurance / yr
- $473 – $860
Fire risk 3/10 · Minor
- Est. fire insurance / yr
- $949 – $1,763
Heat risk 5/10 · Moderate
- Hot days now (above 103°F)
- 7 days/yr
- Hot days in 30 yrs
- 19 days/yr
Wind risk 2/10 · Minimal
- Chance of severe wind over 30 yrs
- 2.0%
Air-quality risk 3/10 · Minor
- Unhealthy air days now
- 3 days/yr
- Unhealthy air days in 30 yrs
- 4 days/yr
Risk factors via First Street. Map © Google.
Why this score? — see what drove the B- grade
The composite is a weighted blend of 9 inputs, each scored 0–100. Each bar is that input's sub-score; the figure is the points it added to the 100-point composite (weight × sub-score).
- Cash flow +30.0/30.0
- DSCR +10.0/10.0
- 1% rule +8.9/10.0
- ARV discount +7.5/15.0
- Livability +3.9/5.0
- Rent growth +2.5/5.0
- Condition / age +2.5/5.0
- Schools +2.3/10.0
- Appreciation +0.0/10.0
$115,000
🖨 Deal sheet 📄 Offer letter ✓ Due diligence
Listing remarks
New listing sold as part of an estate. This 3-bedroom, 1-bath home features hardwood floors throughout, a full unfinished basement with exterior access, and a convenient carport. Ideally located for commuters to Oak Ridge, Clinton, and Oliver Springs. Enjoy the added benefit of a fire station, elementary school, and park located directly across the road.
Key facts
- Exterior access
- Hardwood floors
- Convenient carport
Tags
Property features AI
Exterior
- Parking: 1-car garage; 1-car carport
- Utilities: Septic tank
- Home design: Not attached to another unit; Building area approx. 768 (source: tax records)
- Construction: Vinyl siding; Brick exterior
- Exterior features: Vinyl siding and brick exterior; Irregular lot; Wooded view / other
Interior
- Kitchen: Refrigerator included
- Bedrooms: Bedrooms count not specified
- Flooring: Carpet; Hardwood; Vinyl
- Bathrooms: 1 full bathroom
- Heating & cooling: Electric baseboard heating; Wall cooling
- Interior features: Eat-in kitchen; 6 total rooms
- Laundry & utility: Basement unfinished
Neighborhood map
What this means for you Summary
Snapshot
- This is a 3-bed/1.0-bath single-family listed at $115k.
Deal economics
- At list price, monthly cash flow is $575 ($7k/yr) — positive.
- The deal already cash-flows at list — no discount required.
- Meets the 1% rule at list price ($2k rent vs $115k).
- Recommended offer: $105k (9.0% below list) — sets the bar for market timing.
- Cap rate 12.3% vs local median 3.4% in Oak Ridge — top-decile yield for the area; either an underpriced asset or a hidden risk that comps aren't pricing in. Stress-test before assuming the spread holds.
Location & tenants
- Location reads 78/100 on livability (#4 in TN, #2,605 nationally) — a middle-class / working-renter tenant base. Strengths: amenities A+, cost of living A+, housing A+; Watch: commute F.
- Anderson County (town): math 25% / reading 28% proficiency, ranked #75 of 139 in TN (top 54%) — low school quality limits family demand, transient renter base, plan for 1-2y turnover.
- Zoned schools: Grand Oaks Elementary (math 42% / reading 37%, grade F, #231 of 952 statewide, top 26%, 330 students, 0% FRL); Norwood Middle School (math 17% / reading 12%, grade F, #231 of 333 statewide, top 70%, 159 students, 0% FRL); Clinton High School (math 17% / reading 37%, grade F, #104 of 332 statewide, top 33%, 1,126 students, 0% FRL) — zoned schools average 0% FRL vs 49% district-wide (49 pts lower); this property's tenant base skews higher-income than the district average.
- Market conditions: 160 active listings in the ZIP; 1 comparable units currently listed for rent nearby; 400 units permitted in Anderson County in 2024 (91 in 5+ unit buildings).
Forward outlook
- Local home prices are declining (-3.0%/yr); year-one equity from $795 of loan paydown is wiped out by about $3k of value loss. Plan a longer hold.
- At projected returns (-3.0% appreciation + 3.0% rent growth), your $32k cash investment doubles in ~6 years — after that, you're playing with house money.
Negotiation context
- It's been on market 100 days — a 9% lower offer ($105k) is reasonable based on typical stale-listing flexibility.
- 2 sale attempts; this cycle's ask has dropped $35k (23%) from the opening price — seller is motivated, your offer sets the floor, not the list.
Risks & watch-outs
- Climate carrying-cost: extreme-heat days projected 7→19/yr by 2055 (HVAC capex compounding) — expect insurance premiums to compound above CPI over the hold.
Questions for the listing agent
- It's been on market 100 days. Have you received any prior offers? Is the seller open to a 9% concession, seller financing, or rate buy-down credit?
- Built in 1960 — when were the roof, HVAC, electrical panel, plumbing, and water heater last replaced?
- Why hasn't it sold? Are there any deal-killer items the seller is aware of (foundation, flood, title, zoning, code violations)?
- Is there a deadline driving the sale (1031 exchange, divorce, estate, relocation)? That informs how much negotiation room exists.
- What's the average days-on-market for RENTAL listings here right now (not sales)? A rising rental-DOM trend means longer vacancies and softer asking-rent achievability than the comps imply.
- What's the recent tenant-quality profile in this submarket — average credit score on applications, eviction rate, late-payment / NSF rate, and stable-employment percentage? A property-management company in the area should have these aggregated.
- How much new for-sale + rental construction is in the pipeline within 1–3 miles? Heavy new supply typically softens prices + rents 12–24 months out; constrained supply supports both.
Investment metrics
- 1% rule
- 1.39% ✓
- Cap rate
- 12.29%
- Cash-on-cash
- 21.41%
- DSCR
- 1.95
- GRM
- 6.0
CMA / ARV
No comps found within radius.
Projected returns pro-forma
-3.0% appreciation · 3.0% rent growth · sell at horizon
- IRR
- 13.9%
- Equity multiple
- 1.56×
- Total profit
- $17,921
- Equity at exit
- $17,147
- IRR
- 22.7%
- Equity multiple
- 2.94×
- Total profit
- $62,564
- Equity at exit
- $9,943
Cash invested: $32,200 (down + closing). Projections, not guarantees.
Landlord ↔ Tenant lean methodology
- Overall (STATE)
- 87 Strongly Landlord-Friendly
- State Tennessee
- 87 Strongly Landlord-Friendly · R+13
- County
- — inherits STATE
- City
- — inherits STATE
ZIP-level market 37716
- Home prices YoY
- -5.0%
- Active inventory
- 160
- Price-to-rent
- 6.0×
Monthly cashflow live
- Estimated rent
- $1,600 medium interval (Pro) →
- Mortgage (P&I)
- −$603
- Tax from tax record
- −$38 /mo · $461/yr
- Insurance
- −$48
- HOA
- −$0
- Vacancy / Maint / Mgmt
- −$336
- Net cashflow
- $575
Break-even live
UW: 25.0% down · 7.5% · 30yr · 1.5% tax · 5.0% vac · 8.0% maint · 8.0% mgmt
Financing live
Cash to close
- Down payment
- $28,750
- Closing costs
- $3,450
- Reserves months
- —
- Total cash needed
- —
Loan-product check · same deal, 3 products live
Conventional
25% down · 7.5% · 30yr
- Down + closing
- —
- Monthly P&I
- —
- Monthly cashflow
- —
- DSCR
- —
- Eligible?
- —
Personal DTI + credit; lowest rate.
DSCR
20% down · 8.5% · 30yr
- Down + closing
- —
- Monthly P&I
- —
- Monthly cashflow
- —
- DSCR
- —
- Eligible?
- —
No personal income docs; deal must DSCR.
Hard money
10% down · 12.0% · 12mo
- Down + closing
- —
- Monthly P&I
- —
- Monthly cashflow
- —
- DSCR
- —
- Eligible?
- —
Short-term bridge; refi at stabilization.
Rent comps 1 comps
| Address | Beds | Baths | Sqft | Rent | $/sqft | DOM | Units | Dist |
|---|---|---|---|---|---|---|---|---|
| 126 Arkansas Ave Oak Ridge, TN | 3.0 | 1.0 | 1056 | $1,600 | $1.52 | 19d | 1 | 1.37mi |
Listing history 17 events
-
2026-06-18days on market $115,000 Active 100 DOM
-
2026-06-17days on market $115,000 Active 99 DOM
-
2026-06-16days on market $115,000 Active 98 DOM
-
2026-06-15days on market $115,000 Active 97 DOM
-
2026-06-14days on market $115,000 Active 95 DOM
-
2026-06-13days on market $115,000 Active 94 DOM
-
2026-06-10pricedays on market $115,000 Active 92 DOM
-
2026-06-09days on market $130,000 Active 91 DOM
-
2026-06-08days on market $130,000 Active 90 DOM
-
2026-06-07days on market $130,000 Active 89 DOM
-
2026-06-03days on market $130,000 Active 85 DOM
-
2026-06-03status $130,000 Active 84 DOM
-
2026-05-13status Pending
-
2026-03-11price $130,000
-
2026-02-20status Active
-
2025-12-15historical
-
2025-12-12$150,000 Active
ⓘ Source: listings_history table (triggers on properties + properties_extension) + one-shot
backfill from property_details.listing_events for pre-trigger history.
Tax reassessment forecast TN · Resets to sale price
- Current annual tax
- $461 · $38/mo
- Projected year-2 tax
- $816 · $68/mo
- Expected delta
- +$356/yr (+$30/mo · 77.1%)
ⓘ Screening estimate from a state-policy table — verify with the county assessor before closing.
Climate risk First Street
- Flood 1/10 Low FEMA zone X (unshaded) · 0% chance over 30 yrs
- Wildfire 3/10 Moderate
- Heat 5/10 Major 7 d/yr ≥103°F today · 19 d/yr by 30 yrs out
- Wind 2/10 Low 2% chance of damaging wind over 30 yrs
- Air quality 3/10 Moderate 3 unhealthy d/yr today · 4 by 30 yrs out
Nearby sold comps map
Loading sold comps map…
Walkable amenities ~0.75 mi
Loading nearby amenities…
Taxation est. · year 1
- Rental income
- $19,200
- − Mortgage interest
- −$6,442
- − Property taxes
- −$461
- − Insurance
- −$575
- − Repairs & maintenance
- −$1,536
- − Management
- −$1,536
- − Depreciation
- −$3,345
- Taxable income
- $5,305
- Est. tax owed @ 24.0%
- −$1,273
- After-tax cash flow
- $5,622/yr
For passive investors: Depreciation is non-cash, so a rental often shows a tax loss while cash-flowing — sheltering income. Rental losses are passive: they offset passive income freely, and up to $25,000/yr can offset ordinary (W-2) income if you actively participate and your MAGI is under $100k (phasing out to $0 by $150k); unused losses carry forward. On sale, claimed depreciation is recaptured at up to 25%, and gains may owe capital-gains tax (a 1031 exchange can defer both). Figures are a year-1 estimate at your 24.0% rate — not tax advice; consult a CPA.
Schools (NCES district)
- District
- Anderson County
- NCES district ID
- 4700090
- Math proficiency
- 25% ▼ -11.00%
- Reading proficiency
- 28% ▼ -4.00%
- Median HH income
- $43,541
- Composite
- 22.68/100
- National rank
- #8043
- State rank
- #75 of 139 in TN
Livability — Oak Ridge
- Score
- 78/100
- State rank
- #4
- US rank
- #2605
Category grades
Schools grade is shown separately in the Schools card above.
Census & demographics
- City population
- 33,038
- Population (ZIP)
- 26,361
Population outlook (Anderson County) Hauer SSP2
- Today (2025)
- 76,963 people
- By 2030
- 77,226 · +0.3%
- By 2040
- 76,905 · -0.1%
- By 2050
- 75,405 · -2.0%
- By 2075
- 70,858 · -7.9%
- By 2100
- 60,585 · -21.3%
Race, ethnicity, and origin ACS 2023
- Neighborhood character
- Predominantly White (91%)
- Race & ethnicity
- White 91% Two or more races 5% Hispanic / Latino 2% Black 1%
- Common ancestry
- Serbian 2% Slovak 2% Romanian 2%
- Foreign-born
- 2% · Canada
- Languages at home
- 97% English-only · Spanish 2%
Political lean MEDSL · Anderson
- 2024 margin
- Solid R (+35.7) · D 31.5% · R 67.3% · Other 1.2%
- 2008→2024 swing
- -9.5pp toward R · 2008: -26.2pp · 2024: -35.7pp
- All cycles
- 2024: R+35.7 2020: R+32.2 2016: R+34.3 2012: R+29.8 2008: R+26.2
Not yet ingested
- Civics
- —
Market trends
- HPI YoY
- ▼ -19.01%
- Current HPI
- 364.842
- Rent YoY
- —
- Metro
- —
- State GDP YoY
- ▲ 2.78%
- F500 in state
- 22
Industry mix (Fortune 500 HQ in TN)
| Industry | F500 HQs | Revenue |
|---|---|---|
| Healthcare | 3 | $91B |
|
||
| Retail | 3 | $72B |
|
||
| Transportation / Logistics | 1 | $88B |
|
||
| Paper / Packaging | 1 | $19B |
|
||
| Insurance | 1 | $13B |
|
||
| Energy | 1 | $12B |
|
||
Price history
-13.3% since first listed5 events — show timeline
- 2026-05-13 Pending — Knoxville MLS
- 2026-03-11 Price Changed $130,000 Knoxville MLS
- 2026-02-20 Relisted — Knoxville MLS
- 2025-12-15 Listing Removed — Knoxville MLS
- 2025-12-12 Listed $150,000 Knoxville MLS
Property tax history
+5.4%/yrLatest (2025): $461 · +43.2% YoY. Source: county tax records.
Cash-flow waterfall
monthlySold comps — $/sqft
last 12 mo · ≤1 miLoading sold comps…