 Duplex
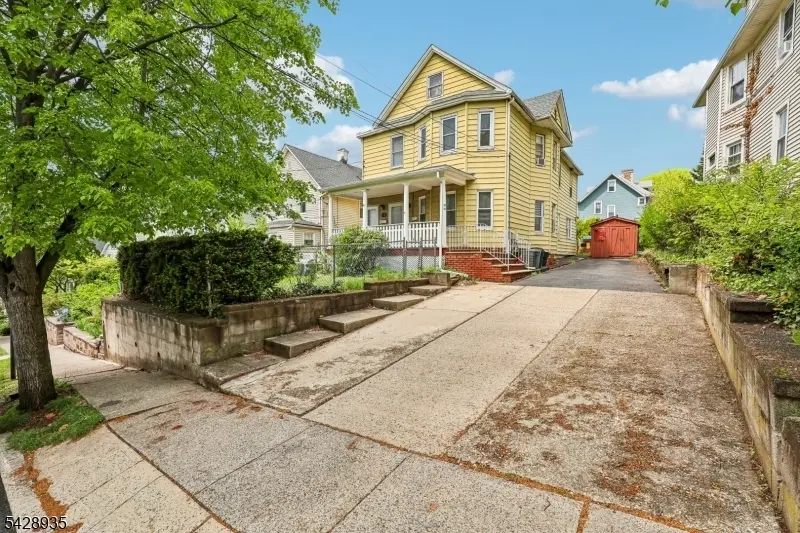
50 Preston St · Ridgefield Park, NJ
Flood risk 1/10 · Minimal
- FEMA flood zone
- X (unshaded)
- Chance of flooding over 30 yrs
- 0.0%
- Est. flood insurance / yr
- $507 – $1,088
Fire risk 1/10 · Minimal
- Est. fire insurance / yr
- $526 – $976
Heat risk 7/10 · Major
- Hot days now (above 99°F)
- 7 days/yr
- Hot days in 30 yrs
- 15 days/yr
Wind risk 6/10 · Moderate
- Chance of severe wind over 30 yrs
- 27.0%
Air-quality risk 4/10 · Minor
- Unhealthy air days now
- 4 days/yr
- Unhealthy air days in 30 yrs
- 7 days/yr
Risk factors via First Street. Map © Google.
Why this score? — see what drove the C- grade
The composite is a weighted blend of 9 inputs, each scored 0–100. Each bar is that input's sub-score; the figure is the points it added to the 100-point composite (weight × sub-score).
- ARV discount +15.0/15.0
- Cash flow +12.4/30.0
- Appreciation +5.0/10.0
- Livability +4.0/5.0
- DSCR +3.7/10.0
- 1% rule +3.5/10.0
- Schools +2.6/10.0
- Rent growth +2.5/5.0
- Condition / age +2.2/5.0
$775,000
🖨 Deal sheet 📄 Offer letter ✓ Due diligence
Multi-family units
County records classify this as Multi-Family (2-4 Unit). Listing-text estimate: 2 units. confirmed
Listing remarks
Exceptional investment opportunity in the heart of Ridgefield Park! This well-maintained two-family home offers incredible income potential in a prime location just minutes from New York City. Two units feature 3 spacious bedrooms and 1 full bathroom, with bright, functional layouts that appeal to both tenants and owner-occupants alike. The property also includes a fully finished attic, providing additional versatile space perfect for a home office, recreation area, or added value potential. Situated in a high-demand commuter location, this home offers convenient access to major highways, public transportation, shopping, and dining. Whether you're looking to expand your portfolio or live in
Key facts
- 6,098 sq ft lot
- 6 parking spots
- Built 1906
Property features AI
Finance
- Financial info: Two-unit property; Reported operating income and expenses listed as zero
Exterior
- Parking: Six parking spaces; Driveway with 2-car width
- Utilities: Natural gas available; Public sewer; Public water
- Home design: Two-story unit style; Approximate year built
- Construction: Vinyl siding; Asphalt shingle roof
- Exterior features: Open porch(es); Partially fenced yard
Interior
- Kitchen: Unit 1: Dishwasher, Gas range/oven; Unit 2: Gas range/oven
- Bedrooms: Two 3-bedroom units (one single-level, one two-story)
- Flooring: Carpeting; Wood floors
- Bathrooms: Two full bathrooms (one in each unit)
- Heating & cooling: Forced hot air heating (natural gas); Window A/C units
- Interior features: Carpeting; Wood floors; Unfinished basement
- Laundry & utility: Carbon monoxide detector (Unit 1)
Neighborhood map
What this means for you Summary
Snapshot
- This is a 2 × 3-bed/1.0-bath units multifamily listed at $775k. Condition is rated fair.
Deal economics
- At list price, monthly cash flow is $-128 ($-2k/yr) — negative. Per door: $-64/mo.
- To cash-flow at today's rent, offer at most $757k (2.4% below list).
- To meet the 1% rule (rent ≥ 1% of price), the offer needs to be $662k (14.6% below list).
- Recommended offer: $662k (14.6% below list) — sets the bar for 1% rule.
Location & tenants
- Location reads 80/100 on livability (#72 in NJ, #1,762 nationally) — a professional / high-income tenant draw. Strengths: crime A+, commute A+, employment A+; Watch: amenities D-, cost of living F.
- Ridgefield Park School District (suburban): math 18% / reading 39% proficiency, ranked #348 of 472 in NJ (top 74%) — low school quality limits family demand, transient renter base, plan for 1-2y turnover.
- Market conditions: 1 active listings in the ZIP; 3,488 units permitted in Bergen County in 2024 (1,610 in 5+ unit buildings).
Forward outlook
- In year one you build about $29k of equity ($5k loan paydown + $23k appreciation (3.0% local appreciation)).
- Bergen County population projected at +20% by 2050 — long-run rental-demand tailwind backs the buy-and-hold thesis.
- By year 2, paydown + projected appreciation supports a ~$47k cash-out refi (75% LTV) — recoverable capital for the next deal without selling this one.
Negotiation context
- It's been on market 40 days — a 3% lower offer ($752k) is reasonable based on typical stale-listing flexibility.
Risks & watch-outs
- Watch-outs: built in 1906 — expect roof / HVAC / electrical / plumbing capex.
- Climate carrying-cost: major wind risk, 27% chance of damaging wind over 30y; extreme-heat days projected 7→15/yr by 2055 (HVAC capex compounding) — expect insurance premiums to compound above CPI over the hold.
Questions for the listing agent
- What do current leases actually rent for vs. the listed asking? Can we see a recent rent roll and the last 12 months of T-12 income?
- It's been on market 40 days. Have you received any prior offers? Is the seller open to a 15% concession, seller financing, or rate buy-down credit?
- Can we see the unit-by-unit rent roll, current vacancy, and any below-market leases? What's the average tenancy length?
- What capital expenditures (roof, boiler, parking lot, exteriors) have been made in the last 5 years, and what's planned in the next 2?
- Have any recent inspections been done? Can we get a copy of the seller's disclosures and any deferred-maintenance estimates?
- Built in 1906 — when were the roof, HVAC, electrical panel, plumbing, and water heater last replaced?
- Is there a deadline driving the sale (1031 exchange, divorce, estate, relocation)? That informs how much negotiation room exists.
- Schools are B-rated — typically a magnet for longer-tenancy family renters. What's the average tenant stay here, and is there a school-zone premium baked into asking?
- What's the average days-on-market for RENTAL listings here right now (not sales)? A rising rental-DOM trend means longer vacancies and softer asking-rent achievability than the comps imply.
- What's the recent tenant-quality profile in this submarket — average credit score on applications, eviction rate, late-payment / NSF rate, and stable-employment percentage? A property-management company in the area should have these aggregated.
- How much new apartment / multifamily construction is in the pipeline within 1–3 miles? Heavy new supply (>2% of stock underway) typically softens rents 12–24 months out; light construction supports rent growth.
Investment metrics
- 1% rule
- 0.85% ✗
- Cap rate
- 6.10%
- Cash-on-cash
- -0.71%
- DSCR
- 0.97
- GRM
- 9.8
CMA / ARV
- ARV (median comp)
- $952,276
- List price
- $775,000
- Delta
- -18.62%
- Verdict
- UNDERPRICED
- Comps
- 3 within 2.0 mi
Projected returns pro-forma
3.0% appreciation · 3.0% rent growth · sell at horizon
- IRR
- 6.9%
- Equity multiple
- 1.39×
- Total profit
- $85,331
- Equity at exit
- $348,474
- IRR
- 9.7%
- Equity multiple
- 2.45×
- Total profit
- $315,421
- Equity at exit
- $537,039
Cash invested: $217,000 (down + closing). Projections, not guarantees.
Landlord ↔ Tenant lean methodology
- Overall (STATE)
- 21 Tenant-Leaning
- State New Jersey
- 21 Tenant-Leaning · D+6
- County
- — inherits STATE
- City
- — inherits STATE
ZIP-level market 07660-1430
- Active inventory
- 1
- Price-to-rent
- 19.5×
Monthly cashflow live
- Estimated rent
- $6,618 high interval (Pro) →
- Mortgage (P&I)
- −$4,064
- Tax est. 1.5%
- −$969 /mo · $11,625/yr
- Insurance
- −$323
- HOA
- −$0
- Vacancy / Maint / Mgmt
- −$1,390
- Net cashflow
- $-128
Break-even live
2-unit breakdown (identical units grouped — click to expand)
| Units | Beds | Baths | Est. rent |
|---|---|---|---|
| 2× units | 3 | 1 | $6,618 |
| #1 | 3 | 1 | $3,309 |
| #2 | 3 | 1 | $3,309 |
| Total (2 units) | $6,618 | ||
UW: 25.0% down · 7.5% · 30yr · 1.5% tax · 5.0% vac · 8.0% maint · 8.0% mgmt
Financing live
Cash to close
- Down payment
- $193,750
- Closing costs
- $23,250
- Reserves months
- —
- Total cash needed
- —
Loan-product check · same deal, 3 products live
Conventional
25% down · 7.5% · 30yr
- Down + closing
- —
- Monthly P&I
- —
- Monthly cashflow
- —
- DSCR
- —
- Eligible?
- —
Personal DTI + credit; lowest rate.
DSCR
20% down · 8.5% · 30yr
- Down + closing
- —
- Monthly P&I
- —
- Monthly cashflow
- —
- DSCR
- —
- Eligible?
- —
No personal income docs; deal must DSCR.
Hard money
10% down · 12.0% · 12mo
- Down + closing
- —
- Monthly P&I
- —
- Monthly cashflow
- —
- DSCR
- —
- Eligible?
- —
Short-term bridge; refi at stabilization.
Listing history 16 events
-
2026-06-18days on market $775,000 Active 40 DOM
-
2026-06-17days on market $775,000 Active 39 DOM
-
2026-06-16days on market $775,000 Active 38 DOM
-
2026-06-15days on market $775,000 Active 37 DOM
-
2026-06-13days on market $775,000 Active 35 DOM
-
2026-06-13days on market $775,000 Active 34 DOM
-
2026-06-09days on market $775,000 Active 31 DOM
-
2026-06-08days on market $775,000 Active 30 DOM
-
2026-06-07days on market $775,000 Active 29 DOM
-
2026-06-04days on market $775,000 Active 26 DOM
-
2026-06-03days on market $775,000 Active 25 DOM
-
2026-06-02days on market $775,000 Active 24 DOM
-
2026-06-01days on market $775,000 Active 23 DOM
-
2026-05-31days on market $775,000 Active 22 DOM
-
2026-05-09$775,000 Active 905-char remark
-
2026-05-02historical $775,000 905-char remark
ⓘ Source: listings_history table (triggers on properties + properties_extension) + one-shot
backfill from property_details.listing_events for pre-trigger history.
Climate risk First Street
- Flood 1/10 Low FEMA zone X (unshaded) · 0% chance over 30 yrs
- Wildfire 1/10 Low
- Heat 7/10 Severe 7 d/yr ≥99°F today · 15 d/yr by 30 yrs out
- Wind 6/10 Major 27% chance of damaging wind over 30 yrs
- Air quality 4/10 Moderate 4 unhealthy d/yr today · 7 by 30 yrs out
Nearby sold comps map
Loading sold comps map…
Walkable amenities ~0.75 mi
Loading nearby amenities…
Taxation est. · year 1
- Rental income
- $79,416
- − Mortgage interest
- −$43,412
- − Property taxes
- −$11,625
- − Insurance
- −$3,875
- − Repairs & maintenance
- −$6,353
- − Management
- −$6,353
- − Depreciation
- −$22,545
- Taxable loss
- −$14,748
- Est. tax savings @ 24.0%
- +$3,540
- After-tax cash flow
- $2,008/yr
For passive investors: Depreciation is non-cash, so a rental often shows a tax loss while cash-flowing — sheltering income. Rental losses are passive: they offset passive income freely, and up to $25,000/yr can offset ordinary (W-2) income if you actively participate and your MAGI is under $100k (phasing out to $0 by $150k); unused losses carry forward. On sale, claimed depreciation is recaptured at up to 25%, and gains may owe capital-gains tax (a 1031 exchange can defer both). Figures are a year-1 estimate at your 24.0% rate — not tax advice; consult a CPA.
Condition & rehab AI · 12 photos
This two-family home in Ridgefield Park requires moderate renovations to improve its condition and increase its value. Key areas for improvement include the kitchen, bathrooms, exterior, and flooring.
Repairs flagged
- Major kitchen cabinets — outdated and in poor condition
- Major bathroom fixtures — outdated and in poor condition
- Major exterior siding — weathered and in poor condition
- Major flooring — damaged and worn
- Major interior walls — peeling paint and outdated colors
- Major windows — old and single-pane
Value-add opportunities
- Both kitchen renovation — modernizing the kitchen would increase both resale and rental value
- Both bathroom renovation — modernizing the bathrooms would increase both resale and rental value
- Both exterior siding and landscaping — improving the exterior would increase both resale and rental value
Renovation cost estimate screening
| Repair item | Severity | Est. cost |
|---|---|---|
| kitchen cabinets · outdated and in poor condition | Major | $15,000–50,000 |
| bathroom fixtures · outdated and in poor condition | Major | $15,000–50,000 |
| exterior siding · weathered and in poor condition | Major | $15,000–50,000 |
| flooring · damaged and worn | Major | $15,000–50,000 |
| interior walls · peeling paint and outdated colors | Major | $15,000–50,000 |
| windows · old and single-pane | Major | $15,000–50,000 |
| Total estimated repair cost · 6 items | $90,000–300,000 |
Value-add ROI direction
- Both kitchen renovation — modernizing the kitchen would increase both resale and rental value ↑
- Both bathroom renovation — modernizing the bathrooms would increase both resale and rental value ↑
- Both exterior siding and landscaping — improving the exterior would increase both resale and rental value ↑
ⓘ Cost ranges are severity-bucket heuristics (US national rule-of-thumb). Get contractor quotes + a written scope before underwriting a rehab budget.
Schools (NCES district)
- District
- Ridgefield Park School District
- NCES district ID
- 3413800
- Math proficiency
- 18% ▼ -18.00%
- Reading proficiency
- 39% ▼ -15.00%
- Median HH income
- $65,945
- Composite
- 26.4/100
- National rank
- #7228
- State rank
- #348 of 472 in NJ
Livability — Ridgefield Park
- Score
- 80/100
- State rank
- #72
- US rank
- #1762
Category grades
Schools grade is shown separately in the Schools card above.
Census & demographics
- Census place
- Ridgefield Park, NJ
Population outlook (Bergen County) Hauer SSP2
- Today (2025)
- 1,021,896 people
- By 2030
- 1,063,119 · +4.0%
- By 2040
- 1,146,566 · +12.2%
- By 2050
- 1,229,132 · +20.3%
- By 2075
- 1,429,694 · +39.9%
- By 2100
- 1,547,614 · +51.4%
Not yet ingested
- Political lean
- —
- Race & ethnicity
- —
- Common origin
- —
- Civics
- —
Market trends
- HPI YoY
- —
- Current HPI
- —
- Rent YoY
- —
- Metro
- —
- State GDP YoY
- ▲ 2.05%
- F500 in state
- 34
Industry mix (Fortune 500 HQ in NJ)
| Industry | F500 HQs | Revenue |
|---|---|---|
| Consumer Goods | 3 | $31B |
|
||
| Pharmaceuticals | 2 | $153B |
|
||
| Technology | 2 | $21B |
|
||
| Insurance | 2 | $20B |
|
||
| Healthcare | 2 | $19B |
|
||
| Financial Services | 1 | $70B |
|
||
Price history
+0.0% since first listed2 events — show timeline
- 2026-05-09 Listed $775,000 GSMLS
- 2026-05-02 Coming Soon $775,000 GSMLS
Cash-flow waterfall
monthlySold comps — $/sqft
last 12 mo · ≤1 miLoading sold comps…