 Multi-family
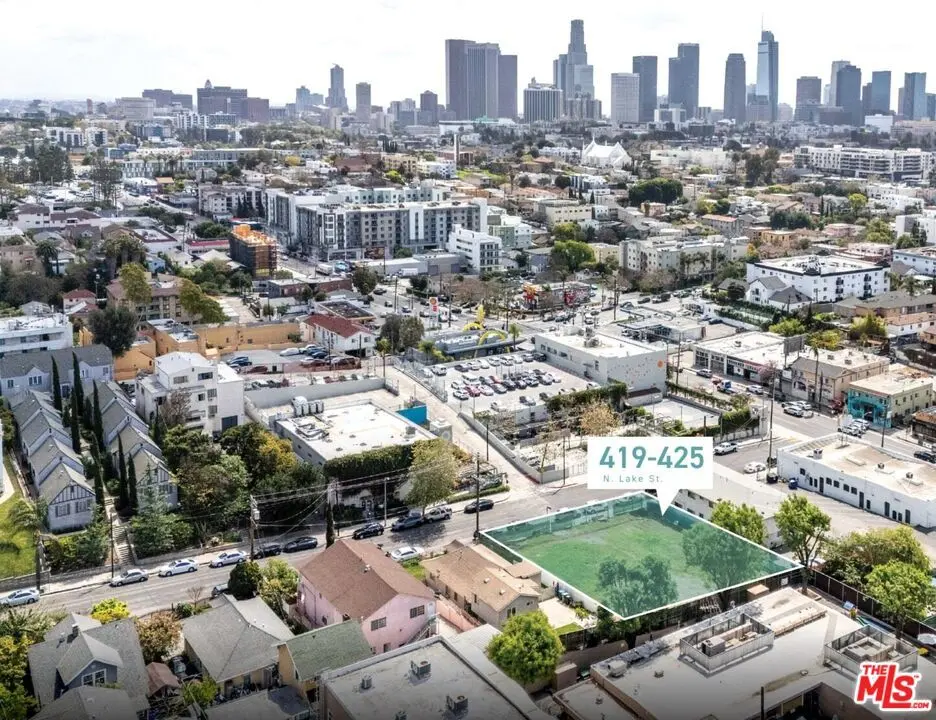
419 N Lake St · Los Angeles, CA
Flood risk 1/10 · Minimal
- FEMA flood zone
- X (unshaded)
- Chance of flooding over 30 yrs
- 0.0%
- Est. flood insurance / yr
- $507 – $1,088
Fire risk 1/10 · Minimal
- Est. fire insurance / yr
- $659 – $1,223
Heat risk 6/10 · Moderate
- Hot days now (above 92°F)
- 7 days/yr
- Hot days in 30 yrs
- 21 days/yr
Wind risk 1/10 · Minimal
- Chance of severe wind over 30 yrs
- —
Air-quality risk 5/10 · Moderate
- Unhealthy air days now
- 8 days/yr
- Unhealthy air days in 30 yrs
- 8 days/yr
Risk factors via First Street. Map © Google.
Why this score? — see what drove the D grade
The composite is a weighted blend of 9 inputs, each scored 0–100. Each bar is that input's sub-score; the figure is the points it added to the 100-point composite (weight × sub-score).
- Cash flow +15.0/30.0
- ARV discount +7.5/15.0
- 1% rule +5.0/10.0
- DSCR +5.0/10.0
- Schools +3.6/10.0
- Livability +3.4/5.0
- Rent growth +2.5/5.0
- Condition / age +2.5/5.0
- Appreciation +0.0/10.0
$3,575,000
🖨 Deal sheet (PDF) 📄 Offer letter ✓ Due diligence
Multi-family units
County records classify this as Multi-Family (2-4 Unit). Listing-text estimate: 1 unit. estimate disagrees with records
Listing remarks MLS
The offering consists of an entitled 95-unit ED1 project of income-restricted housing on a 12,011 (. 276ac) double-lot. The seller will deliver the project RTI (ready to issue) permits upon the close of escrow. Zoned LAR3-1VL, the project was granted six incentives/waivers including no maximum density. increased FAR, and decreased setbacks/open space as a result of the project's ED1 status. The project contemplates no subterranean parking, is 6 stories in height and offers a unit mix of studios and 1-bedrooms. Twenty at-grade parking spaces will be available to tenants along with 74 bicycle spaces and a roof deck lounge. Echo Park has witnessed significant multifamily development in recent years, driven by its increasing desirability and proximity to employment centers. The multifamily vacancy rate remained relatively low at around 5.4% in late 2024, pointing to consistent demand for rental units in this attractive and well-located neighborhood near major employment centers. Silver Lake is a key neighboring market to Echo Park, sharing a similar trajectory of artistic history, resulting in a strong and competitive multifamily market with high rental demand and increasing property values. Silver Lake is consistently one of the most desirable neighborhoods in Los Angeles, leading to very high demand for rental housing and correspondingly high rental rates. As of February 2025, average rents for apartments in Silver Lake were generally comparable to those in Echo Park, often exceeding $3,000 for a one-bedroom unit.
Key facts
- Bicycle spaces
- Zoned lar3-1vl
- Double-lot
Tags
Neighborhood map
What this means for you Summary
Snapshot
- This is a 2-bed/2.0-bath multifamily listed at $3.58M.
Deal economics
- At list price, monthly cash flow is $157k ($1.88M/yr) — positive.
- The deal already cash-flows at list — no discount required.
- Meets the 1% rule at list price ($225k rent vs $3.58M).
- Recommended offer: $3.15M (12.0% below list) — sets the bar for market timing.
- Cap rate 58.9% vs local median 2.1% in Los Angeles — top-decile yield for the area; either an underpriced asset or a hidden risk that comps aren't pricing in. Stress-test before assuming the spread holds.
Location & tenants
- Location reads 68/100 on livability (#273 in CA) — a middle-class / working-renter tenant base. Strengths: amenities A+, commute A+, employment B; Watch: health & safety C-, schools D+, crime F.
- Los Angeles Unified (urban): math 29% / reading 54% proficiency, ranked #223 of 517 in CA (top 43%) — families likely to look elsewhere, expect single-tenant / working-renter base with shorter leases; 67% free/reduced lunch — lower-income household profile, screen leases tightly.
- Market conditions: Rents soft (-0.0%/yr); 190 active listings in the ZIP; 40 comparable units currently listed for rent nearby; rentals at typical pace (median 26d on market — plan ~3-4 weeks tenant-placement turnaround); 40% of comp listings sitting > 30 days — soft ceiling on asking rent; solid renter incomes; 19,697 units permitted in Los Angeles County in 2024 (9,426 in 5+ unit buildings).
- At $224,878/mo this rent would consume 3090% of the median local household income ($87k/yr) (locally 4974% of renters already pay >50% of income on rent) — very limited rent-growth headroom before tenants either downsize or default.
Forward outlook
- Local home prices are declining (-3.0%/yr); year-one equity from $25k of loan paydown is wiped out by about $107k of value loss. Plan a longer hold.
- Los Angeles County population projected at +9% by 2050 — modest demand growth; plan on rents tracking national, not racing it.
- At projected returns (-3.0% appreciation + 0.0% rent growth), your $1.00M cash investment doubles in ~1 year — after that, you're playing with house money.
Negotiation context
- It's been on market 123 days — a 12% lower offer ($3.15M) is reasonable based on typical stale-listing flexibility.
- Current owner paid $15k; list at $3.58M implies a 23733% gain — meaningful room to come down on a strong offer.
Risks & watch-outs
- Watch-outs: built in 1924 — expect roof / HVAC / electrical / plumbing capex.
- Climate carrying-cost: extreme-heat days projected 7→21/yr by 2055 (HVAC capex compounding) — expect insurance premiums to compound above CPI over the hold.
Questions for the listing agent
- It's been on market 123 days. Have you received any prior offers? Is the seller open to a 12% concession, seller financing, or rate buy-down credit?
- Built in 1924 — when were the roof, HVAC, electrical panel, plumbing, and water heater last replaced?
- Why hasn't it sold? Are there any deal-killer items the seller is aware of (foundation, flood, title, zoning, code violations)?
- Is there a deadline driving the sale (1031 exchange, divorce, estate, relocation)? That informs how much negotiation room exists.
- Schools are D-rated, which usually means shorter tenancies and higher turnover. Who's the typical renter profile here, and what's been the actual vacancy rate?
- Crime grade is F in this area — have there been break-ins, vandalism, or insurance claims at this property in the last 3 years? What carrier currently insures it and at what premium?
- The area grade is low — what's the realistic commute time and amenity access for the typical tenant pool here? Any planned neighborhood developments (good or bad) we should know about?
- What's the average days-on-market for RENTAL listings here right now (not sales)? A rising rental-DOM trend means longer vacancies and softer asking-rent achievability than the comps imply.
- What's the recent tenant-quality profile in this submarket — average credit score on applications, eviction rate, late-payment / NSF rate, and stable-employment percentage? A property-management company in the area should have these aggregated.
- How much new apartment / multifamily construction is in the pipeline within 1–3 miles? Heavy new supply (>2% of stock underway) typically softens rents 12–24 months out; light construction supports rent growth.
Investment metrics
- 1% rule
- 6.29% ✓
- Cap rate
- 58.85%
- Cash-on-cash
- 187.72%
- DSCR
- 9.35
- GRM
- 1.3
CMA / ARV
- ARV (median comp)
- $10,487,315,871
- List price
- $3,575,000
- Delta
- -99.97%
- Verdict
- UNDERPRICED
- Comps
- 2 within 1.0 mi
Show comp detail 4 sales within ~0.75 mi
| Address | Dist | Beds/Ba | Sqft | Sold | Price | $/sf | Match |
|---|---|---|---|---|---|---|---|
| 1309 N Coronado St | 0.72mi | 2/2.0 | 1,332 (-1%) | 19mo | $1,104,172 | $829 | 49 |
| 150 S Mountain View Ave | 0.44mi | 3/2.0 (+1) | 1,441 (+7%) | 19mo | $950,000 | $659 | 46 |
| 2307 Reservoir St | 0.68mi | 2/3.0 | 1,470 (+9%) | 9mo | $949,000 | $646 | 41 |
| 230--230 1/2 N Alvarado St | 0.74mi | 2/2.0 | 1,178 (-12%) | 16mo | $715,000 | $607 | 32 |
Match score weights: distance 35% · size 25% · config 20% · recency 20%. Top-matched comps best support the ARV.
Projected returns pro-forma
-3.0% appreciation · 0.0% rent growth · sell at horizon
- IRR
- —
- Equity multiple
- 9.73×
- Total profit
- $8,736,072
- Equity at exit
- $533,044
- IRR
- —
- Equity multiple
- 18.89×
- Total profit
- $17,907,173
- Equity at exit
- $309,101
Cash invested: $1,001,000 (down + closing). Projections, not guarantees.
Landlord ↔ Tenant lean methodology
- Overall (CITY)
- 0 Strongly Tenant-Friendly
- State California
- 18 Strongly Tenant-Friendly · D+13
- County
- — inherits STATE
- City Los Angeles
- 0 Strongly Tenant-Friendly · D+22
ZIP-level market 90026
- Rents YoY
- -0.0%
- Active inventory
- 190
- Price-to-rent
- 125.9×
Monthly cashflow live
- Estimated rent
- $224,878 high interval (Pro) →
- Mortgage (P&I)
- −$18,748
- Tax from tax record
- −$827 /mo · $9,926/yr
- Insurance
- −$1,490
- HOA
- −$0
- Vacancy / Maint / Mgmt
- −$47,224
- Net cashflow
- $156,589
Break-even live
Sensitivity live
| Price | -10% $158,613 | -5% $157,601 | +0% $156,589 | +5% $155,577 | +10% $154,565 |
|---|---|---|---|---|---|
| Rent | -10% $138,824 | -5% $147,707 | +0% $156,589 | +5% $165,472 | +10% $174,355 |
| Rate | -1.0pp $158,390 | -0.5pp $157,498 | base $156,589 | +0.5pp $155,663 | +1.0pp $154,720 |
95-unit breakdown (identical units grouped — click to expand)
| Units | Beds | Baths | Est. rent |
|---|---|---|---|
| 95× units | 0 | 0 | $224,865 |
| #1 | 0 | 0 | $2,367 |
| #2 | 0 | 0 | $2,367 |
| #3 | 0 | 0 | $2,367 |
| #4 | 0 | 0 | $2,367 |
| #5 | 0 | 0 | $2,367 |
| #6 | 0 | 0 | $2,367 |
| #7 | 0 | 0 | $2,367 |
| #8 | 0 | 0 | $2,367 |
| #9 | 0 | 0 | $2,367 |
| #10 | 0 | 0 | $2,367 |
| #11 | 0 | 0 | $2,367 |
| #12 | 0 | 0 | $2,367 |
| #13 | 0 | 0 | $2,367 |
| #14 | 0 | 0 | $2,367 |
| #15 | 0 | 0 | $2,367 |
| #16 | 0 | 0 | $2,367 |
| #17 | 0 | 0 | $2,367 |
| #18 | 0 | 0 | $2,367 |
| #19 | 0 | 0 | $2,367 |
| #20 | 0 | 0 | $2,367 |
| #21 | 0 | 0 | $2,367 |
| #22 | 0 | 0 | $2,367 |
| #23 | 0 | 0 | $2,367 |
| #24 | 0 | 0 | $2,367 |
| #25 | 0 | 0 | $2,367 |
| #26 | 0 | 0 | $2,367 |
| #27 | 0 | 0 | $2,367 |
| #28 | 0 | 0 | $2,367 |
| #29 | 0 | 0 | $2,367 |
| #30 | 0 | 0 | $2,367 |
| #31 | 0 | 0 | $2,367 |
| #32 | 0 | 0 | $2,367 |
| #33 | 0 | 0 | $2,367 |
| #34 | 0 | 0 | $2,367 |
| #35 | 0 | 0 | $2,367 |
| #36 | 0 | 0 | $2,367 |
| #37 | 0 | 0 | $2,367 |
| #38 | 0 | 0 | $2,367 |
| #39 | 0 | 0 | $2,367 |
| #40 | 0 | 0 | $2,367 |
| #41 | 0 | 0 | $2,367 |
| #42 | 0 | 0 | $2,367 |
| #43 | 0 | 0 | $2,367 |
| #44 | 0 | 0 | $2,367 |
| #45 | 0 | 0 | $2,367 |
| #46 | 0 | 0 | $2,367 |
| #47 | 0 | 0 | $2,367 |
| #48 | 0 | 0 | $2,367 |
| #49 | 0 | 0 | $2,367 |
| #50 | 0 | 0 | $2,367 |
| #51 | 0 | 0 | $2,367 |
| #52 | 0 | 0 | $2,367 |
| #53 | 0 | 0 | $2,367 |
| #54 | 0 | 0 | $2,367 |
| #55 | 0 | 0 | $2,367 |
| #56 | 0 | 0 | $2,367 |
| #57 | 0 | 0 | $2,367 |
| #58 | 0 | 0 | $2,367 |
| #59 | 0 | 0 | $2,367 |
| #60 | 0 | 0 | $2,367 |
| #61 | 0 | 0 | $2,367 |
| #62 | 0 | 0 | $2,367 |
| #63 | 0 | 0 | $2,367 |
| #64 | 0 | 0 | $2,367 |
| #65 | 0 | 0 | $2,367 |
| #66 | 0 | 0 | $2,367 |
| #67 | 0 | 0 | $2,367 |
| #68 | 0 | 0 | $2,367 |
| #69 | 0 | 0 | $2,367 |
| #70 | 0 | 0 | $2,367 |
| #71 | 0 | 0 | $2,367 |
| #72 | 0 | 0 | $2,367 |
| #73 | 0 | 0 | $2,367 |
| #74 | 0 | 0 | $2,367 |
| #75 | 0 | 0 | $2,367 |
| #76 | 0 | 0 | $2,367 |
| #77 | 0 | 0 | $2,367 |
| #78 | 0 | 0 | $2,367 |
| #79 | 0 | 0 | $2,367 |
| #80 | 0 | 0 | $2,367 |
| #81 | 0 | 0 | $2,367 |
| #82 | 0 | 0 | $2,367 |
| #83 | 0 | 0 | $2,367 |
| #84 | 0 | 0 | $2,367 |
| #85 | 0 | 0 | $2,367 |
| #86 | 0 | 0 | $2,367 |
| #87 | 0 | 0 | $2,367 |
| #88 | 0 | 0 | $2,367 |
| #89 | 0 | 0 | $2,367 |
| #90 | 0 | 0 | $2,367 |
| #91 | 0 | 0 | $2,367 |
| #92 | 0 | 0 | $2,367 |
| #93 | 0 | 0 | $2,367 |
| #94 | 0 | 0 | $2,367 |
| #95 | 0 | 0 | $2,367 |
| Total (95 units) | $224,878 | ||
UW: 25.0% down · 7.5% · 30yr · 1.5% tax · 5.0% vac · 8.0% maint · 8.0% mgmt
Financing live
Cash to close
- Down payment
- $893,750
- Closing costs
- $107,250
- Reserves months
- —
- Total cash needed
- —
Loan-product check · same deal, 3 products live
Conventional
25% down · 7.5% · 30yr
- Down + closing
- —
- Monthly P&I
- —
- Monthly cashflow
- —
- DSCR
- —
- Eligible?
- —
Personal DTI + credit; lowest rate.
DSCR
20% down · 8.5% · 30yr
- Down + closing
- —
- Monthly P&I
- —
- Monthly cashflow
- —
- DSCR
- —
- Eligible?
- —
No personal income docs; deal must DSCR.
Hard money
10% down · 12.0% · 12mo
- Down + closing
- —
- Monthly P&I
- —
- Monthly cashflow
- —
- DSCR
- —
- Eligible?
- —
Short-term bridge; refi at stabilization.
Rent comps 40 comps
| Address | Beds | Baths | Sqft | Rent | $/sqft | DOM | Units | Dist |
|---|---|---|---|---|---|---|---|---|
| 2199 W Court St Los Angeles, CA | 3.0 | 2.5 | 1428 | $3,390 | $2.37 | 45d | 1 | 0.09mi |
| 245 N Alvarado St Los Angeles, CA | 2.0 | 1.0–2.0 | 710 | $2,850 | $4.01 | 9d | 9 | 0.14mi |
| 433 Rosenell Ter Los Angeles, CA | 1.0–2.0 | 1.0–2.0 | 878 | $2,810 | $3.20 | 16d | 48 | 0.15mi |
| 216 Rosemont Ave Unit 1 Los Angeles, CA | 2.0 | 1.0 | 900 | $2,050 | $2.28 | 13d | 1 | 0.16mi |
| 330 N Westlake Ave Los Angeles, CA | 1.0–2.0 | 1.0–2.0 | 928 | $3,771 | $4.06 | 0d | 8 | 0.18mi |
| 146 1/2 Rosemont Ave Los Angeles, CA | 3.0 | 2.0 | 1133 | $3,295 | $2.91 | 45d | 1 | 0.21mi |
| 449 1/2 W Sunset Blvd Los Angeles, CA | 1.0 | 1.0 | 950 | $2,995 | $3.15 | 45d | 1 | 0.22mi |
| 132 Rosemont Ave Unit 301 Los Angeles, CA | 2.0 | 2.5 | 1331 | $3,650 | $2.74 | 25d | 1 | 0.24mi |
| 132 Rosemont Ave Unit 302 Los Angeles, CA | 3.0 | 2.5 | 1331 | $3,895 | $2.93 | 25d | 1 | 0.24mi |
| 132 Rosemont Ave Unit 302 Los Angeles, CA | 3.0 | 2.5 | 1331 | $3,895 | $2.93 | 45d | 1 | 0.24mi |
| 132 Rosemont Ave Unit 101 Los Angeles, CA | 2.0 | 2.0 | 896 | $2,695 | $3.01 | 45d | 1 | 0.24mi |
| 312 N Coronado St Los Angeles, CA | 3.0 | 3.5 | 1432 | $3,950 | $2.76 | 45d | 1 | 0.25mi |
| 415 N Coronado St Unit 415 Coronado Los Angeles, CA | 2.0 | 1.0 | 1050 | $2,750 | $2.62 | 45d | 1 | 0.29mi |
| 222 N Coronado St Los Angeles, CA | 3.0 | 3.0 | 1502 | $4,700 | $3.13 | 45d | 1 | 0.31mi |
| 227 N Burlington Ave Unit 1 Los Angeles, CA | 3.0 | 3.0 | 1456 | $3,650 | $2.51 | 25d | 1 | 0.32mi |
| 227 N Burlington Ave Unit 3 Los Angeles, CA | 3.0 | 3.0 | 1068 | $4,000 | $3.75 | 45d | 1 | 0.32mi |
| 227 N Burlington Ave Los Angeles, CA | 3.0 | 3.0 | 1456 | $3,750 | $2.58 | 18d | 1 | 0.32mi |
| 225 N Burlington Ave Los Angeles, CA | 3.0 | 2.0 | 1163 | $3,500 | $3.01 | 9d | 1 | 0.32mi |
| 225 N Burlington Ave Unit 1-2 Los Angeles, CA | 3.0 | 3.0 | 1060 | $3,650 | $3.44 | 25d | 1 | 0.33mi |
| 225 N Burlington Ave Unit 225 Los Angeles, CA | 3.0 | 2.0 | 1163 | $3,500 | $3.01 | 25d | 1 | 0.33mi |
| 236 N Burlington Ave Los Angeles, CA | 3.0 | 3.5 | 1089 | $3,341 | $3.07 | 0d | 1 | 0.33mi |
| 234 N Burlington Ave Unit 236 Los Angeles, CA | 3.0 | 3.0 | 1089 | $3,475 | $3.19 | 16d | 1 | 0.33mi |
| 230 N Burlington Ave Unit A Los Angeles, CA | 3.0 | 2.0 | 1000 | $3,180 | $3.18 | 45d | 1 | 0.34mi |
| 230 N Burlington Ave Los Angeles, CA | 3.0 | 2.0 | 1350 | $3,650 | $2.70 | 45d | 1 | 0.34mi |
| 230 N Burlington Ave Unit 3/4 Los Angeles, CA | 3.0 | 2.0 | 1000 | $3,500 | $3.50 | 19d | 1 | 0.34mi |
| 719 Coronado Ter Los Angeles, CA | 3.0 | 1.5 | 1400 | $3,800 | $2.71 | 45d | 1 | 0.36mi |
| 255 N Union Ave Apt 6 Los Angeles, CA | 2.0 | 1.0 | 947 | $2,850 | $3.01 | 12d | 1 | 0.36mi |
| 142 1/2 N Burlington Ave Los Angeles, CA | 3.0 | 3.0 | 1060 | $3,650 | $3.44 | 9d | 1 | 0.37mi |
| 152 N Rampart Blvd Unit 202 Los Angeles, CA | 1.0 | 2.0 | 924 | $2,200 | $2.38 | 12d | 1 | 0.38mi |
| 333 Belmont Ave Los Angeles, CA | 3.0 | 1.0–2.0 | 813 | $3,899 | $4.79 | 9d | 5 | 0.38mi |
| 132 S Mountain View Ave Unit 132 Los Angeles, CA | 3.0 | 2.0 | 1200 | $2,825 | $2.35 | 45d | 1 | 0.39mi |
| 132 S Mountain View Ave Unit 1325 Los Angeles, CA | 3.0 | 2.0 | 1230 | $2,795 | $2.27 | 0d | 1 | 0.39mi |
| 200 S Park View St Los Angeles, CA | 2.0 | 1.0 | 950 | $2,800 | $2.95 | 45d | 1 | 0.40mi |
| 1701 Clinton St #209 Los Angeles, CA | 2.0 | 1.0 | 950 | $3,000 | $3.16 | 45d | 1 | 0.40mi |
| 1647 W Temple St Los Angeles, CA | 1.0–2.0 | 1.0–2.0 | 791 | $3,295 | $4.17 | 4d | 2 | 0.41mi |
| 1008 Rosemont Ave Los Angeles, CA | 1.0–2.0 | 1.0 | 900 | $2,203 | $2.45 | 22d | 3 | 0.43mi |
| 1800 Beverly Blvd Los Angeles, CA | 2.0 | 1.0–2.0 | 763 | $3,907 | $5.12 | 3d | 16 | 0.43mi |
| 826 N Coronado St Unit 1/2 Los Angeles, CA | 2.0 | 1.0 | 950 | $2,975 | $3.13 | 45d | 1 | 0.44mi |
| 134 S Coronado St Unit 136 1/2 Los Angeles, CA | 3.0 | 2.0 | 1300 | $3,150 | $2.42 | 4d | 1 | 0.46mi |
| 236 S Carondelet St Los Angeles, CA | 3.0 | 3.0 | 1400 | $3,599 | $2.57 | 16d | 1 | 0.50mi |
Listing history 16 events
-
2026-06-21days on market $3,575,000 Active 123 DOM
-
2026-06-18days on market $3,575,000 Active 120 DOM
-
2026-06-17days on market $3,575,000 Active 119 DOM
-
2026-06-16days on market $3,575,000 Active 118 DOM
-
2026-06-15days on market $3,575,000 Active 117 DOM
-
2026-06-13days on market $3,575,000 Active 115 DOM
-
2026-06-09days on market $3,575,000 Active 111 DOM
-
2026-06-08days on market $3,575,000 Active 110 DOM
-
2026-06-07days on market $3,575,000 Active 109 DOM
-
2026-06-04days on market $3,575,000 Active 106 DOM
-
2026-06-03days on market $3,575,000 Active 105 DOM
-
2026-06-02days on market $3,575,000 Active 104 DOM
-
2026-06-01days on market $3,575,000 Active 103 DOM
-
2026-05-31days on market $3,575,000 Active 102 DOM
-
2026-02-10$3,575,000 Active 1537-char remark
Show marketing remark (1537 chars)
The offering consists of an entitled 95-unit ED1 project of income-restricted housing on a 12,011 (. 276ac) double-lot. The seller will deliver the project RTI (ready to issue) permits upon the close of escrow. Zoned LAR3-1VL, the project was granted six incentives/waivers including no maximum density. increased FAR, and decreased setbacks/open space as a result of the project's ED1 status. The project contemplates no subterranean parking, is 6 stories in height and offers a unit mix of studios and 1-bedrooms. Twenty at-grade parking spaces will be available to tenants along with 74 bicycle spaces and a roof deck lounge. Echo Park has witnessed significant multifamily development in recent years, driven by its increasing desirability and proximity to employment centers. The multifamily vacancy rate remained relatively low at around 5.4% in late 2024, pointing to consistent demand for rental units in this attractive and well-located neighborhood near major employment centers. Silver Lake is a key neighboring market to Echo Park, sharing a similar trajectory of artistic history, resulting in a strong and competitive multifamily market with high rental demand and increasing property values. Silver Lake is consistently one of the most desirable neighborhoods in Los Angeles, leading to very high demand for rental housing and correspondingly high rental rates. As of February 2025, average rents for apartments in Silver Lake were generally comparable to those in Echo Park, often exceeding $3,000 for a one-bedroom unit.
-
1967-10-13soldstatus $15,000
ⓘ Source: listings_history table (triggers on properties + properties_extension) + one-shot
backfill from property_details.listing_events for pre-trigger history.
Tax reassessment forecast CA · Resets to sale price
- Current annual tax
- $9,926 · $827/mo
- Projected year-2 tax
- $27,170 · $2,264/mo
- Expected delta
- +$17,244/yr (+$1,437/mo · 173.7%)
ⓘ Screening estimate from a state-policy table — verify with the county assessor before closing.
Climate risk First Street
- Flood 1/10 Low FEMA zone X (unshaded) · 0% chance over 30 yrs
- Wildfire 1/10 Low
- Heat 6/10 Major 7 d/yr ≥92°F today · 21 d/yr by 30 yrs out
- Wind 1/10 Low
- Air quality 5/10 Major 8 unhealthy d/yr today · 8 by 30 yrs out
Nearby sold comps map
Loading sold comps map…
Walkable amenities ~0.75 mi
Loading nearby amenities…
Taxation est. · year 1
- Rental income
- $2,698,536
- − Mortgage interest
- −$200,256
- − Property taxes
- −$9,926
- − Insurance
- −$17,875
- − Repairs & maintenance
- −$215,883
- − Management
- −$215,883
- − Depreciation
- −$104,000
- Taxable income
- $1,934,714
- Est. tax owed @ 24.0%
- −$464,331
- After-tax cash flow
- $1,414,739/yr
For passive investors: Depreciation is non-cash, so a rental often shows a tax loss while cash-flowing — sheltering income. Rental losses are passive: they offset passive income freely, and up to $25,000/yr can offset ordinary (W-2) income if you actively participate and your MAGI is under $100k (phasing out to $0 by $150k); unused losses carry forward. On sale, claimed depreciation is recaptured at up to 25%, and gains may owe capital-gains tax (a 1031 exchange can defer both). Figures are a year-1 estimate at your 24.0% rate — not tax advice; consult a CPA.
Schools (NCES district)
- District
- Los Angeles Unified
- NCES district ID
- 0622710
- Math proficiency
- 29% ▼ -4.00%
- Reading proficiency
- 54% ▲ 10.00%
- Median HH income
- $50,403
- Composite
- 35.67/100
- National rank
- #4875
- State rank
- #223 of 517 in CA
Livability — Los Angeles
- Score
- 68/100
- State rank
- #273
- US rank
- #9237
Category grades
Schools grade is shown separately in the Schools card above.
Census & demographics
- Census place
- Los Angeles, CA
- County
- Los Angeles County · 9,444,647 people
- City population
- 3,838,149
- Metro
- Los Angeles-Long Beach-Anaheim, CA
- Population (ZIP)
- 62,692
- Household income
- $87,334
- Rent vs Own
- Severe rent burden
- 4974.0
Population outlook (Los Angeles County) Hauer SSP2
- Today (2025)
- 10,940,515 people
- By 2030
- 11,256,481 · +2.9%
- By 2040
- 11,729,929 · +7.2%
- By 2050
- 11,948,407 · +9.2%
- By 2075
- 11,818,114 · +8.0%
- By 2100
- 10,842,928 · -0.9%
Race, ethnicity, and origin ACS 2023
- Neighborhood character
- Diverse neighborhood (Simpson 0.67)
- Race & ethnicity
- Hispanic / Latino 46% White 31% Asian 13% Two or more races 13% Black 4% Native American 1%
- Hispanic origin (detail)
- Mexican 26%
- Common ancestry
- Lithuanian 2% Italian 2% Romanian 1%
- Foreign-born
- 34% · Canada, China, South Korea
- Languages at home
- 47% English-only · Spanish 39% Tagalog/Filipino 5% Chinese 2%
Political lean MEDSL · Los Angeles
- 2024 margin
- Solid D (+32.9) · D 64.8% · R 31.9% · Other 3.3%
- 2008→2024 swing
- -7.4pp toward R · 2008: 40.4pp · 2024: 32.9pp
- All cycles
- 2024: D+32.9 2020: D+44.2 2016: D+48.0 2012: D+40.0 2008: D+40.4
Not yet ingested
- Civics
- —
Market trends
- HPI YoY
- ▼ -1087.70%
- Current HPI
- 456.3465
- Rent YoY
- ▬ -0.01%
- Metro
- Los Angeles-Long Beach-Anaheim, CA
- State GDP YoY
- ▲ 3.21%
- F500 in state
- 116
Industry mix (Fortune 500 HQ in CA)
| Industry | F500 HQs | Revenue |
|---|---|---|
| Technology | 27 | $1,492B |
|
||
| Financial Services | 3 | $174B |
|
||
| Retail | 3 | $44B |
|
||
| Insurance | 3 | $26B |
|
||
| Media / Entertainment | 2 | $115B |
|
||
| Pharmaceuticals / Biotech | 2 | $62B |
|
||
Price history
+23733.3% since first listed2 events — show timeline
- 2026-02-10 Listed $3,575,000 TheMLS
- 1967-10-13 Sold (Public Records) $15,000 Public Records
Property tax history
+15.7%/yrLatest (2025): $9,926 · +806.2% YoY. Source: county tax records.
Cash-flow waterfall
monthlySold comps — $/sqft
last 12 mo · ≤1 miLoading sold comps…