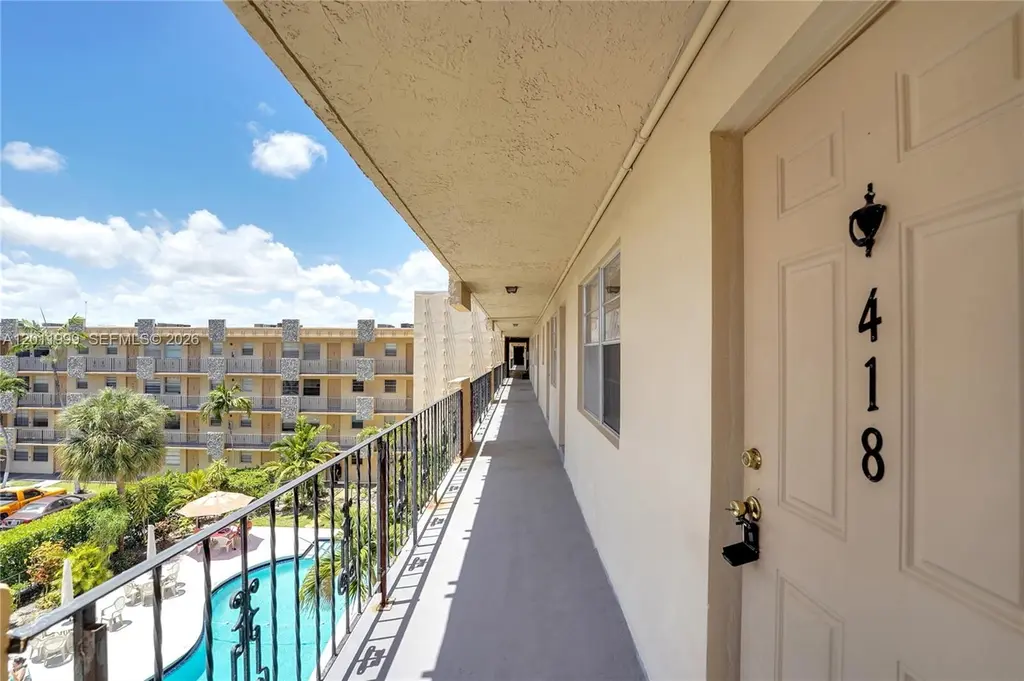
2145 Pierce St #418 · Hollywood, FL
Flood risk No data
- FEMA flood zone
- —
- Chance of flooding over 30 yrs
- —
- Est. flood insurance / yr
- —
Fire risk No data
- Est. fire insurance / yr
- —
Heat risk No data
- Hot days now (above threshold)
- —
- Hot days in 30 yrs
- —
Wind risk No data
- Chance of severe wind over 30 yrs
- —
Air-quality risk No data
- Unhealthy air days now
- —
- Unhealthy air days in 30 yrs
- —
Risk factors via First Street. Map © Google.
Why this score? — see what drove the C+ grade
The composite is a weighted blend of 9 inputs, each scored 0–100. Each bar is that input's sub-score; the figure is the points it added to the 100-point composite (weight × sub-score).
- Cash flow +25.9/30.0
- 1% rule +9.0/10.0
- DSCR +8.7/10.0
- ARV discount +7.5/15.0
- Schools +4.1/10.0
- Livability +3.8/5.0
- Rent growth +2.6/5.0
- Condition / age +2.5/5.0
- Appreciation +0.0/10.0
$150,000
🖨 Deal sheet (PDF) 📄 Offer letter ✓ Due diligence
Listing remarks
The Best Unit Views in the Building! MOVE-IN-READY unit! This Impeccably NEWLY RENOVATED 2-bedroom, 1- bathroom paradise oasis in a 55+ condominium. Featuring a brand-new beautiful kitchen, new gorgeous flooring throughout, plus a brand-new AC! A prime location, within walking distance of downtown Hollywood, & just minutes away from the beautiful beach. Walking distance to restaurants, shopping, & art galleries. Close to a major airport & the world-famous Hard Rock Casino. The clubhouse features multiple BBQ stations, a large heated pool (shields from wind), laundry, & newer elevators. 1 assigned parking + guest parking. Includes storage unit. A very LOW maintenan
Key facts
- $389 HOA
- Parking
- Community pool
Property features AI
Finance
- Other: Pets not allowed
- HOA & community: Monthly association fee; Association amenities include pool (association-managed, heated), clubhouse, elevator(s), bike storage, hobby room, storage, picnic/barbecue area, trash service, pest control, grounds maintenance, and roof maintenance; Laundry service included in association; Located in a senior community
Exterior
- Parking: Guest parking available; One assigned parking space
- Security: Security/high-impact doors; Fire alarm; Smoke detectors
- Utilities: Cable available; Association provides hot water and sewer; Electric service for heating and cooling
- Home design: Block construction; Four-story building; Updated/remodeled condition; Entry on 4th level; Has attached property
- Construction: Block construction; Effective year built noted
- Exterior features: Balcony; Open balcony/patio; Courtyard; Barbecue area; Exterior lighting; Security/high-impact doors; Fire alarm and smoke detectors
Interior
- Kitchen: Electric range; Microwave; Refrigerator; Self-cleaning oven
- Flooring: Tile flooring
- Bathrooms: 1 full bathroom
- Heating & cooling: Central heating (electric); Central air conditioning (electric); Ceiling fans
- Interior features: Breakfast area; Eat-in kitchen and kitchen/dining combo; Separate/formal dining room; Living/dining room combination
- Laundry & utility: Laundry service included in association amenities
Neighborhood map
What this means for you Summary
Snapshot
- This is a 2-bed/1.0-bath condo listed at $150k.
Deal economics
- At list price, monthly cash flow is $367 ($4k/yr) — positive.
- The deal already cash-flows at list — no discount required.
- Meets the 1% rule at list price ($2k rent vs $150k).
- Recommended offer: $146k (3.0% below list) — sets the bar for market timing.
- Cap rate 9.2% vs local median 3.2% in Hollywood — top-decile yield for the area; either an underpriced asset or a hidden risk that comps aren't pricing in. Stress-test before assuming the spread holds.
Location & tenants
- Location reads 76/100 on livability (#232 in FL, #3,548 nationally) — a middle-class / working-renter tenant base. Strengths: commute A+, housing A+, crime B+; Watch: amenities D.
- Broward (suburban): math 42% / reading 53% proficiency, ranked #46 of 73 in FL (top 63%) — families likely to look elsewhere, expect single-tenant / working-renter base with shorter leases.
- Market conditions: Rents flat; 590 active listings in the ZIP; 40 comparable units currently listed for rent nearby; rentals at typical pace (median 19d on market — plan ~3-4 weeks tenant-placement turnaround); 2,111 units permitted in Broward County in 2024 (1,265 in 5+ unit buildings).
- This rent runs 44% of the median local income ($56k/yr) — at the standard rent-burdened threshold; future hikes will face affordability resistance.
Forward outlook
- Local home prices are declining (-3.0%/yr); year-one equity from $1k of loan paydown is wiped out by about $4k of value loss. Plan a longer hold.
- Broward County population projected at +34% by 2050 — long-run rental-demand tailwind backs the buy-and-hold thesis.
Negotiation context
- It's been on market 47 days — a 3% lower offer ($146k) is reasonable based on typical stale-listing flexibility.
- 3 sale attempts with the ask held roughly flat each time — persistent listings suggest the price (not the market) is what's stuck; bring a comps-based counter.
- Current owner paid $63k; list at $150k implies a 138% gain — meaningful room to come down on a strong offer.
Questions for the listing agent
- It's been on market 47 days. Have you received any prior offers? Is the seller open to a 3% concession, seller financing, or rate buy-down credit?
- Built in 1969 — when were the roof, HVAC, electrical panel, plumbing, and water heater last replaced?
- What does the HOA fee cover, when was the last increase, and are there any pending special assessments or reserve-fund shortfalls?
- Any open or pending special assessments — roof, HVAC, plumbing, elevator, façade? What's the per-unit balance and payoff schedule, and is the seller paying it off at close or rolling it to the buyer?
- Is there a deadline driving the sale (1031 exchange, divorce, estate, relocation)? That informs how much negotiation room exists.
- What's the average days-on-market for RENTAL listings here right now (not sales)? A rising rental-DOM trend means longer vacancies and softer asking-rent achievability than the comps imply.
- What's the recent tenant-quality profile in this submarket — average credit score on applications, eviction rate, late-payment / NSF rate, and stable-employment percentage? A property-management company in the area should have these aggregated.
- How much new apartment / multifamily construction is in the pipeline within 1–3 miles? Heavy new supply (>2% of stock underway) typically softens rents 12–24 months out; light construction supports rent growth.
Investment metrics
- 1% rule
- 1.40% ✓
- Cap rate
- 9.23%
- Cash-on-cash
- 10.49%
- DSCR
- 1.47
- GRM
- 6.0
CMA / ARV
No comps found within radius.
Projected returns pro-forma
-3.0% appreciation · 0.43% rent growth · sell at horizon
- IRR
- -3.9%
- Equity multiple
- 0.86×
- Total profit
- $-6,008
- Equity at exit
- $22,365
- IRR
- 2.0%
- Equity multiple
- 1.12×
- Total profit
- $5,069
- Equity at exit
- $12,969
Cash invested: $42,000 (down + closing). Projections, not guarantees.
Landlord ↔ Tenant lean methodology
- Overall (STATE)
- 87 Strongly Landlord-Friendly
- State Florida
- 87 Strongly Landlord-Friendly · R+3
- County
- — inherits STATE
- City
- — inherits STATE
ZIP-level market 33020
- Rents YoY
- 0.4%
- Active inventory
- 590
- Price-to-rent
- 6.0×
Monthly cashflow live
- Estimated rent
- $2,094 high interval (Pro) →
- Mortgage (P&I)
- −$787
- Tax from tax record
- −$49 /mo · $582/yr
- Insurance
- −$62
- HOA
- −$389
- Vacancy / Maint / Mgmt
- −$440
- Net cashflow
- $367
Break-even live
Sensitivity live
| Price | -10% $452 | -5% $410 | +0% $367 | +5% $325 | +10% $282 |
|---|---|---|---|---|---|
| Rent | -10% $202 | -5% $285 | +0% $367 | +5% $450 | +10% $533 |
| Rate | -1.0pp $443 | -0.5pp $405 | base $367 | +0.5pp $328 | +1.0pp $289 |
UW: 25.0% down · 7.5% · 30yr · 1.5% tax · 5.0% vac · 8.0% maint · 8.0% mgmt
Financing live
Cash to close
- Down payment
- $37,500
- Closing costs
- $4,500
- Reserves months
- —
- Total cash needed
- —
Loan-product check · same deal, 3 products live
Conventional
25% down · 7.5% · 30yr
- Down + closing
- —
- Monthly P&I
- —
- Monthly cashflow
- —
- DSCR
- —
- Eligible?
- —
Personal DTI + credit; lowest rate.
DSCR
20% down · 8.5% · 30yr
- Down + closing
- —
- Monthly P&I
- —
- Monthly cashflow
- —
- DSCR
- —
- Eligible?
- —
No personal income docs; deal must DSCR.
Hard money
10% down · 12.0% · 12mo
- Down + closing
- —
- Monthly P&I
- —
- Monthly cashflow
- —
- DSCR
- —
- Eligible?
- —
Short-term bridge; refi at stabilization.
Rent comps 40 comps
| Address | Beds | Baths | Sqft | Rent | $/sqft | DOM | Units | Dist |
|---|---|---|---|---|---|---|---|---|
| 2233 Hollywood Blvd Hollywood, FL | 1.0–2.0 | 1.0–2.0 | 913 | $3,515 | $3.85 | 16d | 94 | 0.39mi |
| 2165 Van Buren St Hollywood, FL | 3.0 | 1.0–3.0 | 1072 | $3,609 | $3.37 | 2d | 14 | 0.44mi |
| 2204 McKinley St #2 Hollywood, FL | 1.0 | 1.0 | 635 | $1,800 | $2.83 | 2d | 1 | 0.49mi |
| 2204 McKinley St #2 Hollywood, FL | 1.0 | 1.0 | 635 | $1,850 | $2.91 | 18d | 1 | 0.49mi |
| 1818 Hollywood Blvd Hollywood, FL | 3.0 | 1.0–2.5 | 1089 | $4,135 | $3.80 | 2d | 17 | 0.56mi |
| 2001 Van Buren St Hollywood, FL | 2.0 | 1.0–2.0 | 788 | $3,599 | $4.57 | 16d | 171 | 0.56mi |
| 1521 N 23rd Ave Hollywood, FL | 2.0 | 2.0 | 750 | $2,000 | $2.67 | 25d | 1 | 0.56mi |
| 2443 Cleveland St Unit 2 Hollywood, FL | 1.0 | 1.0 | 600 | $1,500 | $2.50 | 25d | 1 | 0.58mi |
| 2111 Roosevelt St Unit 3 Hollywood, FL | 1.0 | 1.0 | 600 | $1,425 | $2.38 | 25d | 1 | 0.58mi |
| 1776 Polk St Hollywood, FL | 1.0–2.0 | 1.0–2.0 | 954 | $3,598 | $3.77 | 16d | 25 | 0.59mi |
| 1944 Taft St Unit 2 Hollywood, FL | 2.0 | 2.0 | 750 | $1,800 | $2.40 | 8d | 1 | 0.67mi |
| 2619 Arthur St Unit 3 Hollywood, FL | 1.0 | 1.0 | 450 | $1,280 | $2.84 | 25d | 1 | 0.69mi |
| 1947 Taft St Unit 0 Hollywood, FL | 2.0 | 2.0 | 650 | $1,900 | $2.92 | 25d | 1 | 0.69mi |
| 1815 McKinley St Unit 9 Hollywood, FL | 2.0 | 1.0 | 650 | $1,750 | $2.69 | 17d | 1 | 0.70mi |
| 1770 S Young Cir Hollywood, FL | 2.0 | 1.0–2.0 | 881 | $4,768 | $5.41 | 2d | 42 | 0.73mi |
| 320 S Federal Hwy Hollywood, FL | 2.0 | 1.0–2.0 | 742 | $3,616 | $4.87 | 25d | 9 | 0.74mi |
| 303 S Federal Hwy Hollywood, FL | 1.0–3.0 | 1.0–3.0 | 992 | $2,932 | $2.95 | 3d | 35 | 0.75mi |
| 1710 McKinley St #5 Hollywood, FL | 1.0 | 1.0 | 573 | $1,450 | $2.53 | 19d | 1 | 0.75mi |
| 1710 McKinley St #5 Hollywood, FL | 1.0 | 1.0 | 573 | $1,400 | $2.44 | 25d | 1 | 0.75mi |
| 1816 Taft St Unit 8 Hollywood, FL | 1.0 | 1.0 | 500 | $1,399 | $2.80 | 4d | 1 | 0.76mi |
| 2806 Taylor St Apt C Hollywood, FL | 2.0 | 2.0 | 650 | $2,295 | $3.53 | 8d | 1 | 0.83mi |
| 2806 Taylor St Apt C Hollywood, FL | 2.0 | 2.0 | 650 | $2,295 | $3.53 | 25d | 1 | 0.83mi |
| 2830 Fillmore St Unit 2 Hollywood, FL | 1.0 | 1.0 | 750 | $1,450 | $1.93 | 8d | 1 | 0.87mi |
| 2830 Fillmore St Unit 5 Hollywood, FL | 1.0 | 1.0 | 700 | $1,450 | $2.07 | 25d | 1 | 0.87mi |
| 1533 Cleveland St Hollywood, FL | 1.0 | 1.0 | 512 | $1,200 | $2.34 | 25d | 1 | 0.89mi |
| 2840 Taylor St #28 Hollywood, FL | 1.0 | 1.0 | 560 | $1,800 | $3.21 | 25d | 1 | 0.90mi |
| 1560 McKinley St Unit 115w Hollywood, FL | 1.0 | 1.5 | 665 | $1,500 | $2.26 | 4d | 1 | 0.91mi |
| 2910 Pierce St Unit P102 Hollywood, FL | 1.0 | 1.0 | 700 | $1,595 | $2.28 | 25d | 1 | 0.93mi |
| 2843 Fillmore St Hollywood, FL | 1.0–2.0 | 1.0 | 800 | $2,095 | $2.62 | 25d | 1 | 0.93mi |
| 2847 Fillmore St Hollywood, FL | 1.0 | 1.0 | 700 | $1,600 | $2.29 | 3d | 1 | 0.95mi |
| 2630 Madison St Unit b Hollywood, FL | 1.0 | 1.0 | 400 | $1,500 | $3.75 | 25d | 1 | 0.95mi |
| 2630 Madison St Hollywood, FL | 1.0 | 1.0 | 400 | $1,500 | $3.75 | 25d | 1 | 0.95mi |
| 1958 Liberty St Hollywood, FL | 1.0 | 1.0 | 3837 | $1,469 | $0.38 | 4d | 2 | 0.96mi |
| 1520 McKinley St Unit 107E Hollywood, FL | 1.0 | 1.5 | 665 | $1,700 | $2.56 | 18d | 1 | 0.97mi |
| 2118 N 19th Ave Unit 1-4 Hollywood, FL | 2.0 | 1.0 | 650 | $1,690 | $2.60 | 3d | 1 | 0.99mi |
| 1425 Arthur St Unit 414B Hollywood, FL | 1.0 | 1.5 | 597 | $1,750 | $2.93 | 19d | 1 | 1.01mi |
| 1930 Thomas St Unit 1930 Hollywood, FL | 1.0 | 1.0 | 600 | $1,450 | $2.42 | 25d | 1 | 1.03mi |
| 1913 Thomas St Hollywood, FL | 1.0 | 1.0 | 600 | $1,600 | $2.67 | 19d | 1 | 1.08mi |
| 2915 Jackson St Hollywood, FL | 1.0 | 1.0 | 500 | $1,425 | $2.85 | 14d | 1 | 1.09mi |
| 2915 Jackson St Unit 12 Hollywood, FL | 1.0 | 1.0 | 500 | $1,425 | $2.85 | 17d | 1 | 1.09mi |
HOA detail condo
- Monthly dues
- $389 · $4,668/yr
- Likely covers
- poolparking
- Assessments
- None detected in remarks — confirm with the listing agent.
Listing history 26 events
-
2026-06-21days on market $150,000 Active 47 DOM
-
2026-06-18days on market $150,000 Active 44 DOM
-
2026-06-17days on market $150,000 Active 43 DOM
-
2026-06-16days on market $150,000 Active 42 DOM
-
2026-06-15days on market $150,000 Active 41 DOM
-
2026-06-13days on market $150,000 Active 39 DOM
-
2026-06-09days on market $150,000 Active 35 DOM
-
2026-06-08days on market $150,000 Active 34 DOM
-
2026-06-07days on market $150,000 Active 33 DOM
-
2026-06-04days on market $150,000 Active 30 DOM
-
2026-06-03days on market $150,000 Active 29 DOM
-
2026-06-02days on market $150,000 Active 28 DOM
-
2026-06-01days on market $150,000 Active 27 DOM
-
2026-05-31days on market $150,000 Active 26 DOM
-
2026-05-05historical
-
2026-05-01$150,000 Active
-
2026-04-06price $165,999
-
2026-01-21price $168,000
-
2025-08-09historical $1,800
-
2025-08-05$1,800
-
2025-07-15price $180,000
-
2025-05-03$195,000 Active
-
2004-05-28soldstatus $63,000
-
2003-02-07soldstatus $45,000
-
1972-09-01soldstatus $21,500
-
1970-08-01soldstatus $16,900
ⓘ Source: listings_history table (triggers on properties + properties_extension) + one-shot
backfill from property_details.listing_events for pre-trigger history.
Tax reassessment forecast FL · Resets to sale price
- Current annual tax
- $582 · $49/mo
- Projected year-2 tax
- $1,245 · $104/mo
- Expected delta
- +$663/yr (+$55/mo · 113.8%)
ⓘ Screening estimate from a state-policy table — verify with the county assessor before closing.
Nearby sold comps map
Loading sold comps map…
Walkable amenities ~0.75 mi
Loading nearby amenities…
Taxation est. · year 1
- Rental income
- $25,123
- − Mortgage interest
- −$8,402
- − Property taxes
- −$582
- − Insurance
- −$750
- − Repairs & maintenance
- −$2,010
- − Management
- −$2,010
- − HOA
- −$4,668
- − Depreciation
- −$4,364
- Taxable income
- $2,337
- Est. tax owed @ 24.0%
- −$561
- After-tax cash flow
- $3,846/yr
For passive investors: Depreciation is non-cash, so a rental often shows a tax loss while cash-flowing — sheltering income. Rental losses are passive: they offset passive income freely, and up to $25,000/yr can offset ordinary (W-2) income if you actively participate and your MAGI is under $100k (phasing out to $0 by $150k); unused losses carry forward. On sale, claimed depreciation is recaptured at up to 25%, and gains may owe capital-gains tax (a 1031 exchange can defer both). Figures are a year-1 estimate at your 24.0% rate — not tax advice; consult a CPA.
Schools (NCES district)
- District
- Broward
- NCES district ID
- 1200180
- Math proficiency
- 42% ▼ -18.00%
- Reading proficiency
- 53% ▼ -5.00%
- Median HH income
- $52,139
- Composite
- 40.88/100
- National rank
- #3621
- State rank
- #46 of 73 in FL
Livability — Hollywood
- Score
- 76/100
- State rank
- #232
- US rank
- #3548
Category grades
Schools grade is shown separately in the Schools card above.
Census & demographics
- Census place
- Hollywood, FL
- County
- Broward County · 1,963,430 people
- City population
- 109,079
- Metro
- Miami-Fort Lauderdale-Pompano Beach, FL
- Population (ZIP)
- 46,322
- Household income
- $56,473
- Rent vs Own
- Severe rent burden
- 3948.0
Population outlook (Broward County) Hauer SSP2
- Today (2025)
- 2,207,033 people
- By 2030
- 2,360,704 · +7.0%
- By 2040
- 2,661,208 · +20.6%
- By 2050
- 2,946,698 · +33.5%
- By 2075
- 3,602,273 · +63.2%
- By 2100
- 3,970,984 · +79.9%
Race, ethnicity, and origin ACS 2023
- Neighborhood character
- Diverse neighborhood (Simpson 0.68)
- Race & ethnicity
- Hispanic / Latino 43% Two or more races 31% White 28% Black 24% Asian 1%
- Hispanic origin (detail)
- Mexican 1% Puerto Rican 4% Cuban 9% Dominican 3% Salvadoran 3%
- Common ancestry
- Hispanic 5% Lithuanian 2% Scotch-Irish 1%
- Foreign-born
- 41% · Canada, Jamaica, Dominican Republic
- Languages at home
- 48% English-only · Spanish 38% French/Haitian/Cajun 6% Russian/Polish/Slavic 2%
Political lean MEDSL · Broward
- 2024 margin
- D (+17.0) · D 58.0% · R 41.0%
- 2008→2024 swing
- -17.8pp toward R · 2008: 34.7pp · 2024: 17.0pp
- All cycles
- 2024: D+17.0 2020: D+29.8 2016: D+35.0 2012: D+34.9 2008: D+34.7
Not yet ingested
- Civics
- —
Market trends
- HPI YoY
- ▼ -406.34%
- Current HPI
- 524.7664
- Rent YoY
- ▲ 0.43%
- Metro
- Miami-Fort Lauderdale-Pompano Beach, FL
- State GDP YoY
- ▲ 3.28%
- F500 in state
- 36
Industry mix (Fortune 500 HQ in FL)
| Industry | F500 HQs | Revenue |
|---|---|---|
| Industrial Technology | 2 | $29B |
|
||
| Insurance | 2 | $17B |
|
||
| Retail | 1 | $60B |
|
||
| Technology Distribution | 1 | $58B |
|
||
| Homebuilding | 1 | $35B |
|
||
| Technology Manufacturing | 1 | $35B |
|
||
Price history
+787.6% since first listed12 events — show timeline
- 2026-05-05 Listing Removed — MARMLS
- 2026-05-01 Listed $150,000 MARMLS
- 2026-04-06 Price Changed $165,999 MARMLS
- 2026-01-21 Price Changed $168,000 MARMLS
- 2025-08-09 Rental Removed $1,800 MARMLS
- 2025-08-05 Listed for Rent $1,800 MARMLS
- 2025-07-15 Price Changed $180,000 MARMLS
- 2025-05-03 Listed $195,000 MARMLS
- 2004-05-28 Sold (Public Records) $63,000 Public Records
- 2003-02-07 Sold (Public Records) $45,000 Public Records
- 1972-09-01 Sold (Public Records) $21,500 Public Records
- 1970-08-01 Sold (Public Records) $16,900 Public Records
Property tax history
+2.4%/yrLatest (2025): $582 · +5.3% YoY. Source: county tax records.
Cash-flow waterfall
monthlySold comps — $/sqft
last 12 mo · ≤1 miLoading sold comps…