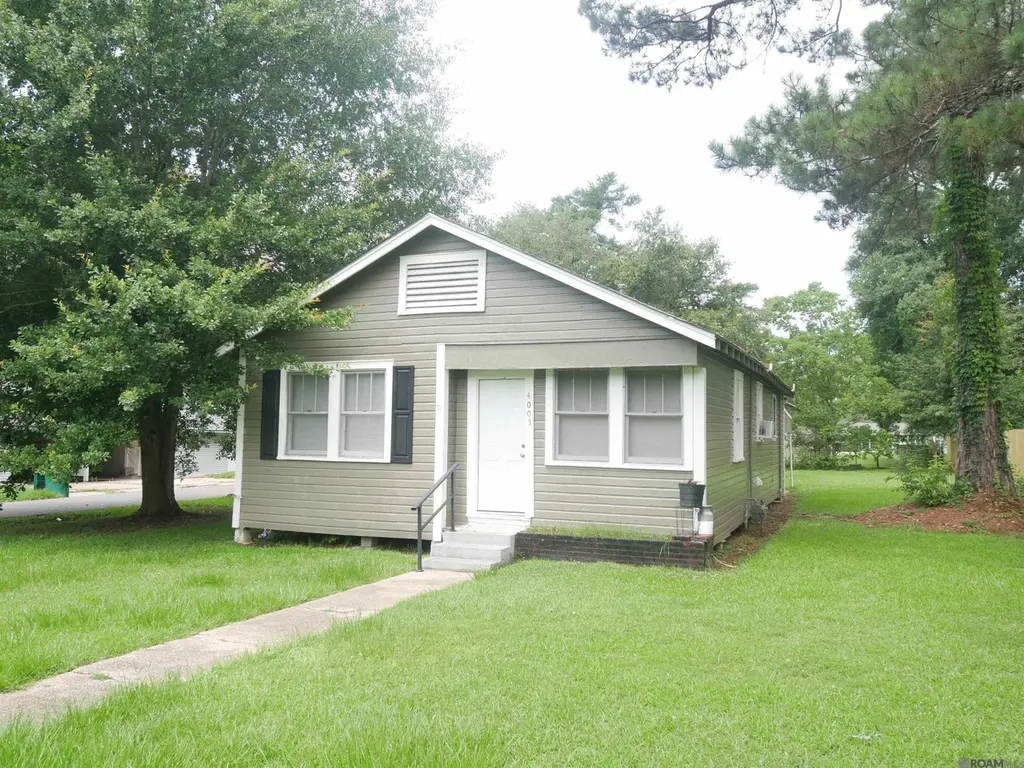
4005 Lee St · Zachary, LA
Flood risk 1/10 · Minimal
- FEMA flood zone
- X (unshaded)
- Chance of flooding over 30 yrs
- 0.0%
- Est. flood insurance / yr
- $507 – $1,088
Fire risk 2/10 · Minimal
- Est. fire insurance / yr
- $1,269 – $2,357
Heat risk 8/10 · Major
- Hot days now (above 108°F)
- 7 days/yr
- Hot days in 30 yrs
- 20 days/yr
Wind risk 9/10 · Severe
- Chance of severe wind over 30 yrs
- 99.0%
Air-quality risk 2/10 · Minimal
- Unhealthy air days now
- 1 days/yr
- Unhealthy air days in 30 yrs
- 2 days/yr
Risk factors via First Street. Map © Google.
Why this score? — see what drove the C grade
The composite is a weighted blend of 9 inputs, each scored 0–100. Each bar is that input's sub-score; the figure is the points it added to the 100-point composite (weight × sub-score).
- Cash flow +19.7/30.0
- ARV discount +15.0/15.0
- DSCR +6.2/10.0
- 1% rule +4.8/10.0
- Schools +4.7/10.0
- Rent growth +3.5/5.0
- Livability +3.5/5.0
- Condition / age +2.5/5.0
- Appreciation +0.0/10.0
$140,000
🖨 Deal sheet 📄 Offer letter ✓ Due diligence
Listing remarks MLS
Newly renovated Cottage style home located near the center hub of Zachary on a corner lot. The 3BD/1BA home features an open floor plan connecting kitchen, dining area and den together. The three bedrooms are located on the opposite side of the main area. New flooring has been installed in the kitchen/dining, den and bathroom. The newly painted kitchen cabinets are accented by laminated cabinet top. All rooms are freshly painted and equipped with ceiling fans. The house is centrally cooled and heated. The large back yard has a newly installed wood fence for added privacy and oak trees for extra shade. This one is a must see and very affordable.
Key facts
- Open floor plan
- New flooring
- Corner lot
Tags
Property features AI
Exterior
- Parking: Carport
- Utilities: Public water
- Home design: Detached single-family residence; Residential property
- Construction: Wood siding construction; Pillar/post/pier foundation
- Exterior features: Wood siding; Lot dimensions approximately 65.55 x 150 (about 0.22 acres); Subdivision: Kennedy Place
Interior
- Bathrooms: 1 full bathroom
- Heating & cooling: Central heating; Central air conditioning
- Interior features: Walk-in closet(s)
Neighborhood map
What this means for you Summary
Snapshot
- This is a 3-bed/1.0-bath single-family listed at $140k.
Deal economics
- At list price, monthly cash flow is $164 ($2k/yr) — positive.
- The deal already cash-flows at list — no discount required.
- To meet the 1% rule (rent ≥ 1% of price), the offer needs to be $138k (1.7% below list).
- Recommended offer: $138k (1.7% below list) — sets the bar for 1% rule.
- Cap rate 7.7% vs local median 4.5% in Zachary — top-decile yield for the area; either an underpriced asset or a hidden risk that comps aren't pricing in. Stress-test before assuming the spread holds.
Location & tenants
- Location reads 69/100 on livability (#64 in LA) — a middle-class / working-renter tenant base. Strengths: schools A+, employment A+, housing A+; Watch: crime C-, amenities F, commute F.
- Zachary Community School District (suburban): math 46% / reading 60% proficiency, ranked #8 of 98 in LA (top 8%) — acceptable for families but not a draw, mixed tenant base, ~2y average lease.
- Market conditions: Rents rising fast (+4.2%/yr); 584 active listings in the ZIP; 4 comparable units currently listed for rent nearby; rentals at typical pace (median 19d on market — plan ~3-4 weeks tenant-placement turnaround); solid renter incomes; 2,252 units permitted in East Baton Rouge Parish in 2024 (440 in 5+ unit buildings).
Forward outlook
- Local home prices are declining (-3.0%/yr); year-one equity from $968 of loan paydown is wiped out by about $4k of value loss. Plan a longer hold.
- East Baton Rouge County population projected at +4% by 2050 — modest demand growth; plan on rents tracking national, not racing it.
Negotiation context
- Only 14 days on market — expect competitive offers; lowballing is unlikely to land.
- 14 sale attempts since 15y ago with the ask held roughly flat each time — persistent listings suggest the price (not the market) is what's stuck; bring a comps-based counter.
Risks & watch-outs
- Climate carrying-cost: severe wind risk, 99% chance of damaging wind over 30y; extreme-heat days projected 7→20/yr by 2055 (HVAC capex compounding) — expect insurance premiums to compound above CPI over the hold.
Questions for the listing agent
- Built in 1965 — when were the roof, HVAC, electrical panel, plumbing, and water heater last replaced?
- Is there a deadline driving the sale (1031 exchange, divorce, estate, relocation)? That informs how much negotiation room exists.
- Schools are A-rated — typically a magnet for longer-tenancy family renters. What's the average tenant stay here, and is there a school-zone premium baked into asking?
- What's the average days-on-market for RENTAL listings here right now (not sales)? A rising rental-DOM trend means longer vacancies and softer asking-rent achievability than the comps imply.
- What's the recent tenant-quality profile in this submarket — average credit score on applications, eviction rate, late-payment / NSF rate, and stable-employment percentage? A property-management company in the area should have these aggregated.
- How much new for-sale + rental construction is in the pipeline within 1–3 miles? Heavy new supply typically softens prices + rents 12–24 months out; constrained supply supports both.
Investment metrics
- 1% rule
- 0.98% ✗
- Cap rate
- 7.70%
- Cash-on-cash
- 5.02%
- DSCR
- 1.22
- GRM
- 8.5
CMA / ARV
- ARV (on-the-fly)
- $171,797
- Comps found
- 12
Show comp detail 12 sales within ~0.75 mi
| Address | Dist | Beds/Ba | Sqft | Sold | Price | $/sf | Match |
|---|---|---|---|---|---|---|---|
| 4031 Florida St | 0.06mi | 3/1.0 | 1,034 (-10%) | 12mo | $120,000 | $116 | 70 |
| 4279 Robert St | 0.28mi | 3/1.5 | 1,105 (-4%) | 15mo | $165,000 | $149 | 66 |
| 4226 Nelson St | 0.34mi | 2/1.0 (-1) | 1,147 (-0%) | 21mo | $114,900 | $100 | 61 |
| 4543 41st St | 0.56mi | 3/1.0 | 1,182 (+2%) | 14mo | $180,000 | $152 | 58 |
| 3978 Nelson St | 0.48mi | 3/1.0 | 1,054 (-9%) | 8mo | $150,000 | $142 | 57 |
| 3290 Old Baker Rd | 0.49mi | 3/2.0 | 1,296 (+12%) | 1mo | $204,900 | $158 | 52 |
| 4843 Kennedy Dr | 0.64mi | 3/2.0 | 1,116 (-3%) | 18mo | $190,000 | $170 | 46 |
| 4105 Bennett St | 0.46mi | 2/1.0 (-1) | 1,293 (+12%) | 14mo | $173,000 | $134 | 41 |
| 4035 Nelson St | 0.47mi | 2/1.0 (-1) | 1,295 (+12%) | 14mo | $185,000 | $143 | 41 |
| 4866 June St | 0.59mi | 3/1.5 | 1,253 (+9%) | 19mo | $190,000 | $152 | 40 |
| 5417 Greenridge Ln | 0.59mi | 3/2.0 | 1,323 (+15%) | 5mo | $229,000 | $173 | 40 |
| 4021 Cottonwood St | 0.56mi | 3/2.0 | 1,303 (+13%) | 21mo | $184,500 | $142 | 31 |
Match score weights: distance 35% · size 25% · config 20% · recency 20%. Top-matched comps best support the ARV.
Projected returns pro-forma
-3.0% appreciation · 4.18% rent growth · sell at horizon
- IRR
- -7.2%
- Equity multiple
- 0.73×
- Total profit
- $-10,604
- Equity at exit
- $20,874
- IRR
- 3.7%
- Equity multiple
- 1.28×
- Total profit
- $11,130
- Equity at exit
- $12,105
Cash invested: $39,200 (down + closing). Projections, not guarantees.
Landlord ↔ Tenant lean methodology
- Overall (STATE)
- 90 Strongly Landlord-Friendly
- State Louisiana
- 90 Strongly Landlord-Friendly · R+12
- County
- — inherits STATE
- City
- — inherits STATE
ZIP-level market 70791
- Home prices YoY
- -21.6%
- Rents YoY
- 4.2%
- Active inventory
- 584
- Price-to-rent
- 8.5×
Monthly cashflow live
- Estimated rent
- $1,377 medium interval (Pro) →
- Mortgage (P&I)
- −$734
- Tax from tax record
- −$131 /mo · $1,576/yr
- Insurance
- −$58
- HOA
- −$0
- Vacancy / Maint / Mgmt
- −$289
- Net cashflow
- $164
Break-even live
UW: 25.0% down · 7.5% · 30yr · 1.5% tax · 5.0% vac · 8.0% maint · 8.0% mgmt
Financing live
Cash to close
- Down payment
- $35,000
- Closing costs
- $4,200
- Reserves months
- —
- Total cash needed
- —
Loan-product check · same deal, 3 products live
Conventional
25% down · 7.5% · 30yr
- Down + closing
- —
- Monthly P&I
- —
- Monthly cashflow
- —
- DSCR
- —
- Eligible?
- —
Personal DTI + credit; lowest rate.
DSCR
20% down · 8.5% · 30yr
- Down + closing
- —
- Monthly P&I
- —
- Monthly cashflow
- —
- DSCR
- —
- Eligible?
- —
No personal income docs; deal must DSCR.
Hard money
10% down · 12.0% · 12mo
- Down + closing
- —
- Monthly P&I
- —
- Monthly cashflow
- —
- DSCR
- —
- Eligible?
- —
Short-term bridge; refi at stabilization.
Rent comps 4 comps
| Address | Beds | Baths | Sqft | Rent | $/sqft | DOM | Units | Dist |
|---|---|---|---|---|---|---|---|---|
| 4133 Lee St #17 Zachary, LA | 2.0 | 1.0 | 800 | $975 | $1.22 | 14d | 1 | 0.11mi |
| 4133 Lee St #17 Zachary, LA | 2.0 | 1.0 | 800 | $975 | $1.22 | 19d | 1 | 0.11mi |
| 5633 Emmie Dr Zachary, LA | 3.0 | 3.0 | 1441 | $2,150 | $1.49 | 19d | 1 | 0.88mi |
| 4150 McHugh Rd Zachary, LA | 1.0–3.0 | 1.0–2.0 | 993 | $1,690 | $1.70 | 14d | 8 | 1.04mi |
Listing history 11 events
-
2026-06-18days on market $140,000 Active 14 DOM
-
2026-06-17days on market $140,000 Active 13 DOM
-
2026-06-16days on market $140,000 Active 12 DOM
-
2026-06-15days on market $140,000 Active 11 DOM
-
2026-06-14days on market $140,000 Active 9 DOM
-
2026-06-13days on market $140,000 Active 8 DOM
-
2026-06-10days on market $140,000 Active 6 DOM
-
2026-06-09days on market $140,000 Active 5 DOM
-
2026-06-08days on market $140,000 Active 4 DOM
-
2026-06-07remarks 653-char remark
-
2026-06-07$140,000 Active 3 DOM
ⓘ Source: listings_history table (triggers on properties + properties_extension) + one-shot
backfill from property_details.listing_events for pre-trigger history.
Tax reassessment forecast LA · Resets to sale price
- Current annual tax
- $1,576 · $131/mo
- Projected year-2 tax
- $1,576 · $131/mo
- Expected delta
- $0/yr ($0/mo · 0.0%)
ⓘ Screening estimate from a state-policy table — verify with the county assessor before closing.
Climate risk First Street
- Flood 1/10 Low FEMA zone X (unshaded) · 0% chance over 30 yrs
- Wildfire 2/10 Low
- Heat 8/10 Severe 7 d/yr ≥108°F today · 20 d/yr by 30 yrs out
- Wind 9/10 Extreme 99% chance of damaging wind over 30 yrs
- Air quality 2/10 Low 1 unhealthy d/yr today · 2 by 30 yrs out
Nearby sold comps map
Loading sold comps map…
Walkable amenities ~0.75 mi
Loading nearby amenities…
Taxation est. · year 1
- Rental income
- $16,522
- − Mortgage interest
- −$7,842
- − Property taxes
- −$1,576
- − Insurance
- −$700
- − Repairs & maintenance
- −$1,322
- − Management
- −$1,322
- − Depreciation
- −$4,073
- Taxable loss
- −$313
- Est. tax savings @ 24.0%
- +$75
- After-tax cash flow
- $2,041/yr
For passive investors: Depreciation is non-cash, so a rental often shows a tax loss while cash-flowing — sheltering income. Rental losses are passive: they offset passive income freely, and up to $25,000/yr can offset ordinary (W-2) income if you actively participate and your MAGI is under $100k (phasing out to $0 by $150k); unused losses carry forward. On sale, claimed depreciation is recaptured at up to 25%, and gains may owe capital-gains tax (a 1031 exchange can defer both). Figures are a year-1 estimate at your 24.0% rate — not tax advice; consult a CPA.
Schools (NCES district)
- District
- Zachary Community School District
- NCES district ID
- 2200039
- Math proficiency
- 46% ▼ -38.00%
- Reading proficiency
- 60% ▼ -28.00%
- Median HH income
- $68,531
- Composite
- 46.99/100
- National rank
- #2349
- State rank
- #8 of 98 in LA
Livability — Zachary
- Score
- 69/100
- State rank
- #64
- US rank
- #8274
Category grades
Schools grade is shown separately in the Schools card above.
Census & demographics
- Census place
- Zachary, LA
- County
- East Baton Rouge Parish · 399,686 people
- City population
- 30,385
- Metro
- Baton Rouge, LA
- Population (ZIP)
- 30,385
- Household income
- $78,263
- Rent vs Own
- Severe rent burden
- 718.0
Population outlook (East Baton Rouge County) Hauer SSP2
- Today (2025)
- 464,810 people
- By 2030
- 472,137 · +1.6%
- By 2040
- 480,243 · +3.3%
- By 2050
- 484,422 · +4.2%
- By 2075
- 492,069 · +5.9%
- By 2100
- 476,347 · +2.5%
Race, ethnicity, and origin ACS 2023
- Neighborhood character
- Diverse neighborhood (Simpson 0.55)
- Race & ethnicity
- White 53% Black 41% Two or more races 4% Hispanic / Latino 2% Asian 2%
- Common ancestry
- Lithuanian 6% Italian 2% Slovak 1%
- Foreign-born
- 2% · Canada
- Languages at home
- 96% English-only · Spanish 1% German/W. Germanic 1% French/Haitian/Cajun 1%
Political lean MEDSL · East Baton Rouge
- 2024 margin
- D (+11.1) · D 54.5% · R 43.4% · Other 2.1%
- 2008→2024 swing
- +8.9pp toward D · 2008: 2.2pp · 2024: 11.1pp
- All cycles
- 2024: D+11.1 2020: D+13.1 2016: D+9.2 2012: D+5.2 2008: D+2.2
Not yet ingested
- Civics
- —
Market trends
- HPI YoY
- ▼ -47.01%
- Current HPI
- 170.2143
- Rent YoY
- ▲ 4.18%
- Metro
- Baton Rouge, LA
- State GDP YoY
- ▲ 3.29%
- F500 in state
- 10
Industry mix (Fortune 500 HQ in LA)
| Industry | F500 HQs | Revenue |
|---|---|---|
| Telecommunications | 2 | $23B |
|
||
| Utilities | 1 | $12B |
|
||
| Wholesale / Distribution | 1 | $5B |
|
||
| Advertising | 1 | $2B |
|
||
Price history
+28.4% since first listed24 events — show timeline
- 2026-06-04 Listed $140,000 GBRMLS
- 2026-06-04 Listed $140,000 AcadianaMLS
- 2023-06-01 Listed $1,050 GBRMLS
- 2023-06-01 Sold (MLS) — GBRMLS
- 2023-02-01 Sold (MLS) — GBRMLS
- 2022-11-01 Listed $1,050 GBRMLS
- 2022-10-28 Sold (Public Records) $135,000 Public Records
- 2022-10-28 Sold (MLS) — GBRMLS
- 2022-10-03 Pending — GBRMLS
- 2022-10-02 Listed $140,000 AcadianaMLS
- 2022-10-02 Listed $140,000 GBRMLS
- 2021-03-01 Delisted — GBRMLS
- 2021-01-17 Pending — GBRMLS
- 2020-12-27 Relisted — GBRMLS
- 2020-12-26 Pending — GBRMLS
- 2020-12-01 Relisted — GBRMLS
- 2020-11-16 Pending — GBRMLS
- 2020-10-01 Listed $117,000 AcadianaMLS
- 2020-10-01 Listed $117,000 GBRMLS
- 2012-12-20 Sold (MLS) — GBRMLS
- 2012-09-26 Listed $60,000 AcadianaMLS
- 2012-09-26 Listed $60,000 GBRMLS
- 2011-10-19 Listed $109,000 AcadianaMLS
- 2011-10-19 Listed $109,000 GBRMLS
Property tax history
+3.7%/yrLatest (2025): $1,576 · -2.8% YoY. Source: county tax records.
Cash-flow waterfall
monthlySold comps — $/sqft
last 12 mo · ≤1 miLoading sold comps…