12200 Stone Ave N #38 · Seattle, WA
Flood risk 1/10 · Minimal
- FEMA flood zone
- X (unshaded)
- Chance of flooding over 30 yrs
- 0.0%
- Est. flood insurance / yr
- $473 – $860
Fire risk 1/10 · Minimal
- Est. fire insurance / yr
- $604 – $1,122
Heat risk 3/10 · Minor
- Hot days now (above 86°F)
- 7 days/yr
- Hot days in 30 yrs
- 15 days/yr
Wind risk 1/10 · Minimal
- Chance of severe wind over 30 yrs
- —
Air-quality risk 7/10 · Major
- Unhealthy air days now
- 10 days/yr
- Unhealthy air days in 30 yrs
- 11 days/yr
Risk factors via First Street. Map © Google.
Why this score? — see what drove the B grade
The composite is a weighted blend of 9 inputs, each scored 0–100. Each bar is that input's sub-score; the figure is the points it added to the 100-point composite (weight × sub-score).
- Cash flow +30.0/30.0
- 1% rule +10.0/10.0
- DSCR +10.0/10.0
- ARV discount +7.5/15.0
- Schools +6.1/10.0
- Condition / age +4.0/5.0
- Livability +3.8/5.0
- Rent growth +2.9/5.0
- Appreciation +0.0/10.0
$125,000
🖨 Deal sheet (PDF) 📄 Offer letter ✓ Due diligence
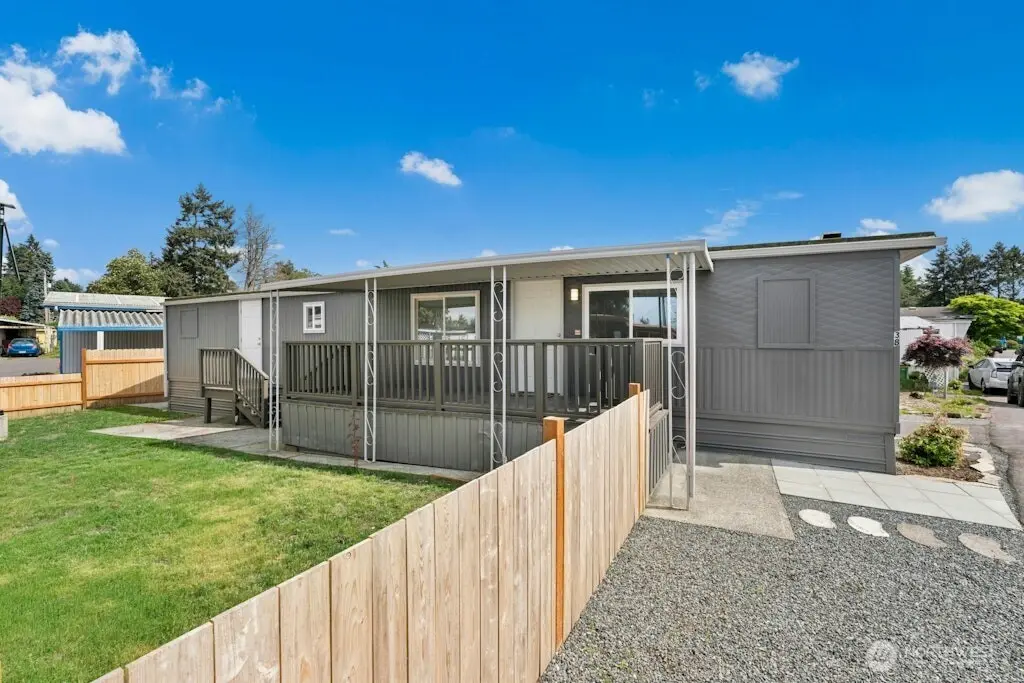
Listing remarks
Completely refreshed and move-in ready! This beautifully updated manufactured home features a bright open layout with new flooring, fresh interior finishes, and recessed lighting. A sleek modern kitchen with crisp white cabinetry, generous prep space, and new stainless steel appliances for a clean contemporary look. Spacious living and dining areas flow seamlessly together, creating a clean, modern feel throughout. The home offers comfortable bedrooms, an updated bathroom with integrated laundry area, and smart use of space throughout. Outside, enjoy a covered front deck, fully-fenced yard space, fresh exterior paint, and plenty of parking. The large lot provides room to garden, play, enter
Key facts
- Fully-fenced yard
- Open layout
- Covered front deck
Tags
Property features AI
Finance
- Other: Property listed as residential, manufactured home; Calculated building area 780 (tape measure)
- Financial info: Land lease: $1,470; Listing terms: Cash
- HOA & community: Park-approved sale; Halcyon park with about 80 homes; Pets allowed
Exterior
- Parking: 2 uncovered open parking spaces
- Utilities: Public water (paid by park); Sewer paid by park; Seattle City Light power; Electric energy source
- Home design: Manufactured single-wide home; One level; Updated/remodeled; Manufactured home make: Buddy, model 60E/12; Mobile home remains
- Construction: Manufactured house (single wide)
- Exterior features: Corner lot; Landscaped; Patio/porch/deck
Interior
- Kitchen: Dishwasher; Refrigerator
- Bedrooms: 2 bedrooms
- Flooring: Laminate
- Bathrooms: 1 full bathroom
- Heating & cooling: Ductless heating; Has cooling
- Interior features: Water heater (electric, located in closet)
- Laundry & utility: Washer; Dryer
Neighborhood map
What this means for you Summary
Snapshot
- This is a 2-bed/1.0-bath manufactured listed at $125k. Condition is rated good.
Deal economics
- At list price, monthly cash flow is $747 ($9k/yr) — positive.
- The deal already cash-flows at list — no discount required.
- Meets the 1% rule at list price ($2k rent vs $125k).
- Recommended offer: $121k (3.0% below list) — sets the bar for market timing.
- Cap rate 13.5% vs local median 1.6% in Seattle — top-decile yield for the area; either an underpriced asset or a hidden risk that comps aren't pricing in. Stress-test before assuming the spread holds.
Location & tenants
- Location reads 75/100 on livability (#166 in WA, #4,033 nationally) — a middle-class / working-renter tenant base. Strengths: amenities A+, commute A+, employment A+; Watch: crime F, cost of living F.
- Seattle Public Schools (urban): math 64% / reading 72% proficiency, ranked #19 of 291 in WA (top 6%) — acceptable for families but not a draw, mixed tenant base, ~2y average lease.
- Zoned schools: Hazel Wolf K-8 (720 students, 22% FRL); Whitman Middle School (679 students, 15% FRL); Ingraham High School (1,452 students, 33% FRL).
- Market conditions: Rents rising (+1.6%/yr); 244 active listings in the ZIP; 40 comparable units currently listed for rent nearby; rentals leasing fast (median 0d on market — plan ~1-2 weeks tenant-placement turnaround); solid renter incomes; 10,555 units permitted in King County in 2024 (7,119 in 5+ unit buildings).
Forward outlook
- Local home prices are declining (-3.0%/yr); year-one equity from $864 of loan paydown is wiped out by about $4k of value loss. Plan a longer hold.
- King County population projected at +44% by 2050 — long-run rental-demand tailwind backs the buy-and-hold thesis.
- At projected returns (-3.0% appreciation + 1.6% rent growth), your $35k cash investment doubles in ~6 years — after that, you're playing with house money.
Negotiation context
- It's been on market 40 days — a 3% lower offer ($121k) is reasonable based on typical stale-listing flexibility.
Questions for the listing agent
- It's been on market 40 days. Have you received any prior offers? Is the seller open to a 3% concession, seller financing, or rate buy-down credit?
- Built in 1966 — when were the roof, HVAC, electrical panel, plumbing, and water heater last replaced?
- Is there a deadline driving the sale (1031 exchange, divorce, estate, relocation)? That informs how much negotiation room exists.
- Schools are A-rated — typically a magnet for longer-tenancy family renters. What's the average tenant stay here, and is there a school-zone premium baked into asking?
- Crime grade is F in this area — have there been break-ins, vandalism, or insurance claims at this property in the last 3 years? What carrier currently insures it and at what premium?
- What's the average days-on-market for RENTAL listings here right now (not sales)? A rising rental-DOM trend means longer vacancies and softer asking-rent achievability than the comps imply.
- What's the recent tenant-quality profile in this submarket — average credit score on applications, eviction rate, late-payment / NSF rate, and stable-employment percentage? A property-management company in the area should have these aggregated.
- How much new for-sale + rental construction is in the pipeline within 1–3 miles? Heavy new supply typically softens prices + rents 12–24 months out; constrained supply supports both.
Investment metrics
- 1% rule
- 1.63% ✓
- Cap rate
- 13.47%
- Cash-on-cash
- 25.63%
- DSCR
- 2.14
- GRM
- 5.1
CMA / ARV
- ARV (on-the-fly)
- $72,540
- Comps found
- 1
Show comp detail 1 sale within ~0.75 mi
| Address | Dist | Beds/Ba | Sqft | Sold | Price | $/sf | Match |
|---|---|---|---|---|---|---|---|
| 1333 N 125th St | 0.13mi | 2/1.0 | 700 (-10%) | 18mo | $65,000 | $93 | 62 |
Match score weights: distance 35% · size 25% · config 20% · recency 20%. Top-matched comps best support the ARV.
Projected returns pro-forma
-3.0% appreciation · 1.56% rent growth · sell at horizon
- IRR
- 17.6%
- Equity multiple
- 1.70×
- Total profit
- $24,468
- Equity at exit
- $18,638
- IRR
- 25.0%
- Equity multiple
- 3.03×
- Total profit
- $71,118
- Equity at exit
- $10,808
Cash invested: $35,000 (down + closing). Projections, not guarantees.
Landlord ↔ Tenant lean methodology
- Overall (CITY)
- 0 Strongly Tenant-Friendly
- State Washington
- 28 Tenant-Leaning · D+8
- County
- — inherits STATE
- City Seattle
- 0 Strongly Tenant-Friendly · D+52
ZIP-level market 98133
- Rents YoY
- 1.6%
- Active inventory
- 244
- Price-to-rent
- 5.1×
Monthly cashflow live
- Estimated rent
- $2,040 high interval (Pro) →
- Mortgage (P&I)
- −$656
- Tax est. 1.5%
- −$156 /mo · $1,875/yr
- Insurance
- −$52
- HOA
- −$0
- Vacancy / Maint / Mgmt
- −$428
- Net cashflow
- $747
Break-even live
Sensitivity live
| Price | -10% $834 | -5% $791 | +0% $747 | +5% $704 | +10% $661 |
|---|---|---|---|---|---|
| Rent | -10% $586 | -5% $667 | +0% $747 | +5% $828 | +10% $909 |
| Rate | -1.0pp $810 | -0.5pp $779 | base $747 | +0.5pp $715 | +1.0pp $682 |
UW: 25.0% down · 7.5% · 30yr · 1.5% tax · 5.0% vac · 8.0% maint · 8.0% mgmt
Financing live
Cash to close
- Down payment
- $31,250
- Closing costs
- $3,750
- Reserves months
- —
- Total cash needed
- —
Loan-product check · same deal, 3 products live
Conventional
25% down · 7.5% · 30yr
- Down + closing
- —
- Monthly P&I
- —
- Monthly cashflow
- —
- DSCR
- —
- Eligible?
- —
Personal DTI + credit; lowest rate.
DSCR
20% down · 8.5% · 30yr
- Down + closing
- —
- Monthly P&I
- —
- Monthly cashflow
- —
- DSCR
- —
- Eligible?
- —
No personal income docs; deal must DSCR.
Hard money
10% down · 12.0% · 12mo
- Down + closing
- —
- Monthly P&I
- —
- Monthly cashflow
- —
- DSCR
- —
- Eligible?
- —
Short-term bridge; refi at stabilization.
Rent comps 40 comps
| Address | Beds | Baths | Sqft | Rent | $/sqft | DOM | Units | Dist |
|---|---|---|---|---|---|---|---|---|
| 11550 Stone Ave N Seattle, WA | 1.0 | 1.0 | 626 | $1,600 | $2.56 | 0d | 1 | 0.28mi |
| 11501 Stone Ave N Unit 1364261P Seattle, WA | 1.0 | 1.0 | 645 | $2,450 | $3.80 | 0d | 1 | 0.35mi |
| 1100 N 115th St Seattle, WA | 2.0 | 2.0 | 1988 | $5,924 | $2.98 | 0d | 3 | 0.41mi |
| 903 N 130th St #303 Seattle, WA | 1.0 | 1.0 | 619 | $1,850 | $2.99 | 0d | 1 | 0.47mi |
| 625 N 130th St Seattle, WA | 1.0 | 1.0 | 690 | $1,595 | $2.31 | 0d | 2 | 0.57mi |
| 11210 Meridian Ave N Seattle, WA | 2.0 | 1.0 | 800 | $1,950 | $2.44 | 0d | 1 | 0.65mi |
| 13280 Linden Ave N Seattle, WA | 1.0–3.0 | 1.0–2.0 | 692 | $1,524 | $2.20 | 0d | 8 | 0.66mi |
| 12250 Greenwood Ave N Seattle, WA | 2.0 | 1.0 | 841 | $2,045 | $2.43 | 0d | 2 | 0.66mi |
| 11758 Greenwood Ave N Seattle, WA | 1.0 | 1.0 | 700 | $1,295 | $1.85 | 0d | 1 | 0.67mi |
| 2116 N 112th St Apt 304 Seattle, WA | 1.0 | 1.0 | 750 | $1,495 | $1.99 | 3d | 1 | 0.67mi |
| 2116 N 112th St Unit 402 Seattle, WA | 2.0 | 1.5 | 950 | $1,895 | $1.99 | 45d | 1 | 0.67mi |
| 12520 Greenwood Ave N Unit 204 Seattle, WA | 2.0 | 2.0 | 1000 | $1,995 | $2.00 | 0d | 1 | 0.68mi |
| 11740 Greenwood Ave N Seattle, WA | 1.0–2.0 | 1.0–2.0 | 885 | $2,295 | $2.59 | 0d | 4 | 0.68mi |
| 11223 Corliss Ave N #303 Seattle, WA | 1.0 | 1.0 | 691 | $1,850 | $2.68 | 4d | 1 | 0.69mi |
| 12536 Greenwood Ave N Seattle, WA | 1.0–2.0 | 1.0 | 632 | $1,995 | $3.15 | 0d | 3 | 0.69mi |
| 12550 Greenwood Ave N Seattle, WA | 2.0 | 2.0 | 975 | $1,895 | $1.94 | 25d | 1 | 0.70mi |
| 11716 Greenwood Ave N Seattle, WA | 2.0 | 2.0 | 1000 | $1,995 | $2.00 | 23d | 1 | 0.70mi |
| 2152 N 112th St Seattle, WA | 1.0 | 1.0 | 600 | $1,395 | $2.33 | 45d | 1 | 0.72mi |
| 11749 Greenwood Ave N Seattle, WA | 1.0 | 1.0 | 676 | $1,498 | $2.21 | 15d | 3 | 0.72mi |
| 11540 Greenwood Ave N Seattle, WA | 1.0–2.0 | 1.0 | 687 | $1,995 | $2.90 | 0d | 4 | 0.73mi |
| 10710 Stone Ave N Unit 10710 Seattle, WA | 2.0 | 1.0 | 830 | $1,795 | $2.16 | 0d | 1 | 0.74mi |
| 300 N 130th St #7307 Seattle, WA | 1.0 | 1.0 | 707 | $2,295 | $3.25 | 3d | 1 | 0.74mi |
| 11701 Greenwood Ave N #216 Seattle, WA | 2.0 | 1.0 | 970 | $2,150 | $2.22 | 6d | 1 | 0.74mi |
| 11701 Greenwood Ave N Unit 214 Seattle, WA | 2.0 | 1.0 | 1040 | $2,150 | $2.07 | 14d | 1 | 0.74mi |
| 10708 Stone Ave N Unit 10710 Seattle, WA | 2.0 | 1.0 | 830 | $1,895 | $2.28 | 14d | 1 | 0.74mi |
| 12748 Greenwood Ave N Seattle, WA | 1.0–2.0 | 1.0–2.0 | 765 | $2,245 | $2.93 | 0d | 2 | 0.75mi |
| 13530 Linden Ave N Seattle, WA | 1.0–3.0 | 1.0–2.0 | 867 | $2,058 | $2.37 | 0d | 12 | 0.75mi |
| 326 NE 125th St Unit 2 Seattle, WA | 2.0 | 2.0 | 800 | $2,595 | $3.24 | 45d | 1 | 0.75mi |
| 13748 Stone Ave N Seattle, WA | 2.0 | 2.5 | 996 | $3,350 | $3.36 | 45d | 1 | 0.76mi |
| 11541 Greenwood Ave N Seattle, WA | 1.0 | 1.0 | 750 | $1,475 | $1.97 | 0d | 1 | 0.77mi |
| 11254 Greenwood Ave N Seattle, WA | 1.0–2.0 | 1.0–2.0 | 877 | $1,995 | $2.27 | 0d | 2 | 0.77mi |
| 11254 Greenwood Ave N Unit 301 Seattle, WA | 2.0 | 2.0 | 1075 | $2,195 | $2.04 | 18d | 1 | 0.77mi |
| 11254 Greenwood Ave N Unit 101 Seattle, WA | 1.0 | 1.0 | 680 | $1,745 | $2.57 | 18d | 1 | 0.77mi |
| 11244 Greenwood Ave N Seattle, WA | 1.0–2.0 | 1.0–2.0 | 767 | $2,475 | $3.22 | 0d | 8 | 0.78mi |
| 11501 Greenwood Ave N Seattle, WA | 2.0 | 1.0 | 896 | $1,825 | $2.04 | 0d | 1 | 0.79mi |
| 10550 Midvale Ave N Unit 3 Seattle, WA | 2.0 | 1.0 | 750 | $1,900 | $2.53 | 45d | 1 | 0.80mi |
| 10550 Midvale Ave N Unit 4 Seattle, WA | 2.0 | 1.0 | 750 | $1,850 | $2.47 | 0d | 1 | 0.80mi |
| 11255 Greenwood Ave N Seattle, WA | 2.0 | 2.0 | 888 | $1,995 | $2.25 | 0d | 1 | 0.80mi |
| 10711 Meridian Ave N Seattle, WA | 1.0–2.0 | 1.0–2.0 | 853 | $2,235 | $2.62 | 0d | 7 | 0.81mi |
| 303 NE 115th St Unit 1 Seattle, WA | 2.0 | 2.0 | 830 | $3,400 | $4.10 | 0d | 1 | 0.82mi |
Listing history 21 events
-
2026-06-21days on market $125,000 Active 40 DOM
-
2026-06-21days on market $125,000 Active 39 DOM
-
2026-06-19days on market $125,000 Active 38 DOM
-
2026-06-18days on market $125,000 Active 37 DOM
-
2026-06-17days on market $125,000 Active 36 DOM
-
2026-06-16days on market $125,000 Active 35 DOM
-
2026-06-15days on market $125,000 Active 34 DOM
-
2026-06-15days on market $125,000 Active 33 DOM
-
2026-06-13days on market $125,000 Active 32 DOM
-
2026-06-12days on market $125,000 Active 31 DOM
-
2026-06-10days on market $125,000 Active 29 DOM
-
2026-06-09days on market $125,000 Active 28 DOM
-
2026-06-08days on market $125,000 Active 27 DOM
-
2026-06-07days on market $125,000 Active 26 DOM
-
2026-06-07days on market $125,000 Active 25 DOM
-
2026-06-04days on market $125,000 Active 23 DOM
-
2026-06-03days on market $125,000 Active 22 DOM
-
2026-06-02days on market $125,000 Active 21 DOM
-
2026-06-01days on market $125,000 Active 20 DOM
-
2026-05-31days on market $125,000 Active 19 DOM
-
2026-05-12$125,000 Active
ⓘ Source: listings_history table (triggers on properties + properties_extension) + one-shot
backfill from property_details.listing_events for pre-trigger history.
Climate risk First Street
- Flood 1/10 Low FEMA zone X (unshaded) · 0% chance over 30 yrs
- Wildfire 1/10 Low
- Heat 3/10 Moderate 7 d/yr ≥86°F today · 15 d/yr by 30 yrs out
- Wind 1/10 Low
- Air quality 7/10 Severe 10 unhealthy d/yr today · 11 by 30 yrs out
Nearby sold comps map
Loading sold comps map…
Walkable amenities ~0.75 mi
Loading nearby amenities…
Taxation est. · year 1
- Rental income
- $24,476
- − Mortgage interest
- −$7,002
- − Property taxes
- −$1,875
- − Insurance
- −$625
- − Repairs & maintenance
- −$1,958
- − Management
- −$1,958
- − Depreciation
- −$3,636
- Taxable income
- $7,421
- Est. tax owed @ 24.0%
- −$1,781
- After-tax cash flow
- $7,188/yr
For passive investors: Depreciation is non-cash, so a rental often shows a tax loss while cash-flowing — sheltering income. Rental losses are passive: they offset passive income freely, and up to $25,000/yr can offset ordinary (W-2) income if you actively participate and your MAGI is under $100k (phasing out to $0 by $150k); unused losses carry forward. On sale, claimed depreciation is recaptured at up to 25%, and gains may owe capital-gains tax (a 1031 exchange can defer both). Figures are a year-1 estimate at your 24.0% rate — not tax advice; consult a CPA.
Condition & rehab AI · 23 photos
This beautifully updated manufactured home is move-in ready with fresh finishes and modern appliances. It offers a bright open layout and a fully-fenced yard space, making it an attractive option for both resale and rental.
Value-add opportunities
- Both Landscaping and curb appeal improvements — Enhances curb appeal and adds value for both resale and rental.
- Both Add a smart thermostat — Improves energy efficiency and adds a modern touch.
- Both Install smart home security system — Enhances safety and adds a modern touch.
- Both Add a smart home automation system — Enhances convenience and adds a modern touch.
Renovation cost estimate screening
Value-add ROI direction
- Both Landscaping and curb appeal improvements — Enhances curb appeal and adds value for both resale and rental. ↑
- Both Add a smart thermostat — Improves energy efficiency and adds a modern touch. ↑
- Both Install smart home security system — Enhances safety and adds a modern touch. ↑
- Both Add a smart home automation system — Enhances convenience and adds a modern touch. ↑
ⓘ Cost ranges are severity-bucket heuristics (US national rule-of-thumb). Get contractor quotes + a written scope before underwriting a rehab budget.
Schools (NCES district)
- District
- Seattle Public Schools
- NCES district ID
- 5307710
- Math proficiency
- 64% ▼ -1.00%
- Reading proficiency
- 72% ▬ 0.00%
- Median HH income
- $68,695
- Composite
- 60.76/100
- National rank
- #1649
- State rank
- #19 of 291 in WA
Livability — Seattle
- Score
- 75/100
- State rank
- #166
- US rank
- #4033
Category grades
Schools grade is shown separately in the Schools card above.
Census & demographics
- Census place
- Seattle, WA
- County
- King County · 2,251,916 people
- City population
- 706,262
- Metro
- Seattle-Tacoma-Bellevue, WA
- Population (ZIP)
- 53,249
- Household income
- $93,662
- Rent vs Own
- Severe rent burden
- 3152.0
Population outlook (King County) Hauer SSP2
- Today (2025)
- 2,576,485 people
- By 2030
- 2,803,316 · +8.8%
- By 2040
- 3,255,921 · +26.4%
- By 2050
- 3,706,444 · +43.9%
- By 2075
- 4,746,063 · +84.2%
- By 2100
- 5,407,730 · +109.9%
Race, ethnicity, and origin ACS 2023
- Neighborhood character
- Diverse neighborhood (Simpson 0.64)
- Race & ethnicity
- White 56% Asian 15% Two or more races 12% Hispanic / Latino 11% Black 9%
- Hispanic origin (detail)
- Mexican 7%
- Common ancestry
- Portuguese 4% Italian 4% Slovak 3%
- Foreign-born
- 23% · Canada, China, South Korea
- Languages at home
- 72% English-only · Spanish 7% Chinese 4% Other Asian/Pacific 3%
Political lean MEDSL · King
- 2024 margin
- Solid D (+51.7) · D 74.2% · R 22.5% · Other 3.4%
- 2008→2024 swing
- +9.6pp toward D · 2008: 42.1pp · 2024: 51.7pp
- All cycles
- 2024: D+51.7 2020: D+52.7 2016: D+50.4 2012: D+39.9 2008: D+42.1
Not yet ingested
- Civics
- —
Market trends
- HPI YoY
- ▼ -1155.41%
- Current HPI
- 344.45
- Rent YoY
- ▲ 1.56%
- Metro
- Seattle-Tacoma-Bellevue, WA
- State GDP YoY
- ▲ 4.65%
- F500 in state
- 22
Industry mix (Fortune 500 HQ in WA)
| Industry | F500 HQs | Revenue |
|---|---|---|
| Retail | 2 | $269B |
|
||
| Technology / Retail | 1 | $638B |
|
||
| Technology | 1 | $245B |
|
||
| Telecommunications | 1 | $38B |
|
||
| Food / Beverage | 1 | $36B |
|
||
| Automotive / Trucks | 1 | $34B |
|
||
Price history
1 event — show timeline
- 2026-05-12 Listed $125,000 NWMLS as Distributed by MLS Grid
Cash-flow waterfall
monthlySold comps — $/sqft
last 12 mo · ≤1 miLoading sold comps…