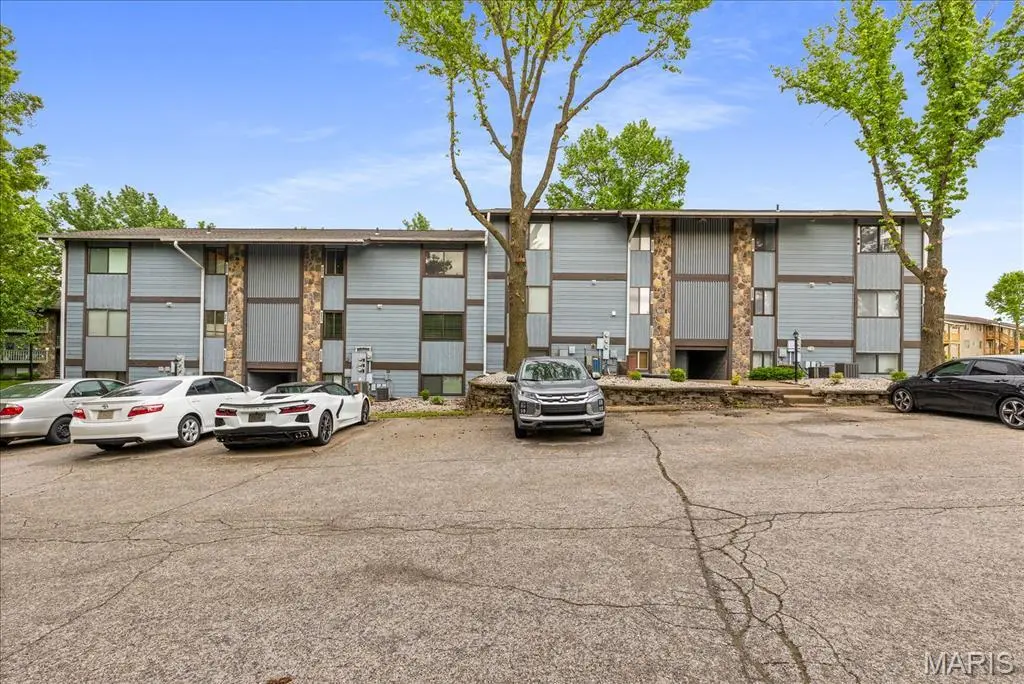
1722 Gascony Parc Dr #1722 · Lake St. Louis, MO
Flood risk 1/10 · Minimal
- FEMA flood zone
- X (unshaded)
- Chance of flooding over 30 yrs
- 0.0%
- Est. flood insurance / yr
- $507 – $1,088
Fire risk 1/10 · Minimal
- Est. fire insurance / yr
- $1,054 – $1,958
Heat risk 5/10 · Moderate
- Hot days now (above 107°F)
- 7 days/yr
- Hot days in 30 yrs
- 20 days/yr
Wind risk 2/10 · Minimal
- Chance of severe wind over 30 yrs
- 1.0%
Air-quality risk 1/10 · Minimal
- Unhealthy air days now
- 0 days/yr
- Unhealthy air days in 30 yrs
- 0 days/yr
Risk factors via First Street. Map © Google.
Why this score? — see what drove the B- grade
The composite is a weighted blend of 9 inputs, each scored 0–100. Each bar is that input's sub-score; the figure is the points it added to the 100-point composite (weight × sub-score).
- Cash flow +27.4/30.0
- 1% rule +10.0/10.0
- DSCR +9.6/10.0
- ARV discount +8.9/15.0
- Schools +4.3/10.0
- Rent growth +3.6/5.0
- Livability +2.5/5.0
- Condition / age +2.5/5.0
- Appreciation +0.0/10.0
$114,900
🖨 Deal sheet 📄 Offer letter ✓ Due diligence
Listing remarks
Back on the Market - no fault of seller- Looking for a GREAT 2 bedroom and 1 full bath with updates? THIS IS IT! Newer kitchen with stove, refrigerator, microwave, washer and dryer. The kitchen and dining room area have a newer laminate flooring. Living room walks out to a deck that overlooks the pool. Full Lake St. Louis amenities, close to parks, shopping and the highway. (Washer/ Dryer and Refrigerator are negotiable) HURRY before this one is gone!
Key facts
- Close to parks
- Newer kitchen
- Close to highway
Tags
Property features AI
Finance
- HOA & community: HOA manages community amenities including boating, clubhouse, lake and pool; Monthly HOA fee; HOA fee covers insurance, grounds maintenance, parking/road maintenance, common area maintenance, exterior maintenance, pool and pool maintenance, pest control, roof, sewer, snow removal, trash and water
Exterior
- Utilities: Public water; Public sewer; Single-phase electric; Cable connected
- Home design: Residential condominium; One level
- Construction: Cedar and wood siding exterior
- Exterior features: Adjoins common ground; Private outdoor in-ground pool
Interior
- Kitchen: Kitchen (main level)
- Bedrooms: 2 bedrooms on the main level
- Bathrooms: 1 full bathroom on the main level
- Heating & cooling: Electric heat; Central air; Attic fan; Ceiling fans
- Interior features: Attic fan; Ceiling fans; Central air
Neighborhood map
What this means for you Summary
Snapshot
- This is a 2-bed/1.0-bath condo listed at $115k.
Deal economics
- At list price, monthly cash flow is $335 ($4k/yr) — positive.
- The deal already cash-flows at list — no discount required.
- Meets the 1% rule at list price ($2k rent vs $115k).
- Recommended offer: $111k (3.0% below list) — sets the bar for market timing.
- Cap rate 9.8% vs local median 3.1% in Lake St. Louis — top-decile yield for the area; either an underpriced asset or a hidden risk that comps aren't pricing in. Stress-test before assuming the spread holds.
Location & tenants
- Location reads: area grade B — affects rentability + tenant quality, not the cash-flow math above.
- Wentzville R-IV (suburban): math 44% / reading 52% proficiency, ranked #32 of 324 in MO (top 10%) — families likely to look elsewhere, expect single-tenant / working-renter base with shorter leases; only 18% free/reduced lunch — higher-income household profile.
- Zoned schools: Lakeview Elementary (math 50% / reading 56%, grade C, #221 of 1,115 statewide, top 20%, 630 students, 12% FRL); Emil E. Holt Sr. High (math 48% / reading 58%, grade C-, #88 of 521 statewide, top 17%, 1,273 students, 12% FRL).
- Market conditions: Rents rising fast (+4.2%/yr); 230 active listings in the ZIP; 2 comparable units currently listed for rent nearby; high-income renter base; 2,021 units permitted in St. Charles County in 2024 (568 in 5+ unit buildings).
- This rent is only 17% of the median local income ($138k/yr) — well below the 30% rent-burden line; pricing power to push rent on renewal without tenant pushback.
Forward outlook
- Local home prices are declining (-3.0%/yr); year-one equity from $794 of loan paydown is wiped out by about $3k of value loss. Plan a longer hold.
- St. Charles County population projected at +22% by 2050 — long-run rental-demand tailwind backs the buy-and-hold thesis.
- At projected returns (-3.0% appreciation + 4.2% rent growth), your $32k cash investment doubles in ~8 years — after that, you're playing with house money.
Negotiation context
- It's been on market 39 days — a 3% lower offer ($111k) is reasonable based on typical stale-listing flexibility.
- 2 sale attempts with the ask held roughly flat each time — persistent listings suggest the price (not the market) is what's stuck; bring a comps-based counter.
Risks & watch-outs
- Watch-outs: HOA is 22% of rent.
- Climate carrying-cost: extreme-heat days projected 7→20/yr by 2055 (HVAC capex compounding) — expect insurance premiums to compound above CPI over the hold.
Questions for the listing agent
- It's been on market 39 days. Have you received any prior offers? Is the seller open to a 3% concession, seller financing, or rate buy-down credit?
- Built in 1970 — when were the roof, HVAC, electrical panel, plumbing, and water heater last replaced?
- What does the HOA fee cover, when was the last increase, and are there any pending special assessments or reserve-fund shortfalls?
- Any open or pending special assessments — roof, HVAC, plumbing, elevator, façade? What's the per-unit balance and payoff schedule, and is the seller paying it off at close or rolling it to the buyer?
- Is there a deadline driving the sale (1031 exchange, divorce, estate, relocation)? That informs how much negotiation room exists.
- What's the average days-on-market for RENTAL listings here right now (not sales)? A rising rental-DOM trend means longer vacancies and softer asking-rent achievability than the comps imply.
- What's the recent tenant-quality profile in this submarket — average credit score on applications, eviction rate, late-payment / NSF rate, and stable-employment percentage? A property-management company in the area should have these aggregated.
- How much new apartment / multifamily construction is in the pipeline within 1–3 miles? Heavy new supply (>2% of stock underway) typically softens rents 12–24 months out; light construction supports rent growth.
Investment metrics
- 1% rule
- 1.70% ✓
- Cap rate
- 9.79%
- Cash-on-cash
- 12.48%
- DSCR
- 1.56
- GRM
- 4.9
CMA / ARV
- ARV (median comp)
- $118,662
- List price
- $114,900
- Delta
- -3.17%
- Verdict
- FAIR
- Comps
- 20 within 1.0 mi
Projected returns pro-forma
-3.0% appreciation · 4.21% rent growth · sell at horizon
- IRR
- 4.2%
- Equity multiple
- 1.17×
- Total profit
- $5,386
- Equity at exit
- $17,132
- IRR
- 15.3%
- Equity multiple
- 2.35×
- Total profit
- $43,403
- Equity at exit
- $9,934
Cash invested: $32,172 (down + closing). Projections, not guarantees.
Landlord ↔ Tenant lean methodology
- Overall (STATE)
- 81 Strongly Landlord-Friendly
- State Missouri
- 81 Strongly Landlord-Friendly · R+10
- County
- — inherits STATE
- City
- — inherits STATE
ZIP-level market 63367
- Rents YoY
- 4.2%
- Active inventory
- 230
- Price-to-rent
- 4.9×
Monthly cashflow live
- Estimated rent
- $1,952 medium interval (Pro) →
- Mortgage (P&I)
- −$603
- Tax from tax record
- −$129 /mo · $1,544/yr
- Insurance
- −$48
- HOA
- −$428
- Vacancy / Maint / Mgmt
- −$410
- Net cashflow
- $335
Break-even live
UW: 25.0% down · 7.5% · 30yr · 1.5% tax · 5.0% vac · 8.0% maint · 8.0% mgmt
Financing live
Cash to close
- Down payment
- $28,725
- Closing costs
- $3,447
- Reserves months
- —
- Total cash needed
- —
Loan-product check · same deal, 3 products live
Conventional
25% down · 7.5% · 30yr
- Down + closing
- —
- Monthly P&I
- —
- Monthly cashflow
- —
- DSCR
- —
- Eligible?
- —
Personal DTI + credit; lowest rate.
DSCR
20% down · 8.5% · 30yr
- Down + closing
- —
- Monthly P&I
- —
- Monthly cashflow
- —
- DSCR
- —
- Eligible?
- —
No personal income docs; deal must DSCR.
Hard money
10% down · 12.0% · 12mo
- Down + closing
- —
- Monthly P&I
- —
- Monthly cashflow
- —
- DSCR
- —
- Eligible?
- —
Short-term bridge; refi at stabilization.
Rent comps 2 comps
| Address | Beds | Baths | Sqft | Rent | $/sqft | DOM | Units | Dist |
|---|---|---|---|---|---|---|---|---|
| 17 Warsen Ave Wentzville, MO | 3.0 | 1.0 | 864 | $1,875 | $2.17 | 14d | 1 | 1.09mi |
| 1000 Centinnial Club DR O'Fallon, MO | 2.0–3.0 | 2.0–2.5 | 1309 | $2,290 | $1.75 | 1d | 32 | 1.15mi |
HOA detail condo
- Monthly dues
- $428 · $5,136/yr
- Likely covers
- pool
- Assessments
- None detected in remarks — confirm with the listing agent.
Listing history 21 events
-
2026-06-18days on market $114,900 Active 39 DOM
-
2026-06-17days on market $114,900 Active 38 DOM
-
2026-06-16days on market $114,900 Active 37 DOM
-
2026-06-15days on market $114,900 Active 36 DOM
-
2026-06-13days on market $114,900 Active 34 DOM
-
2026-06-13days on market $114,900 Active 33 DOM
-
2026-06-09days on market $114,900 Active 30 DOM
-
2026-06-08days on market $114,900 Active 29 DOM
-
2026-06-07days on market $114,900 Active 28 DOM
-
2026-06-05days on market $114,900 Active 25 DOM
-
2026-06-03days on market $114,900 Active 24 DOM
-
2026-06-02days on market $114,900 Active 23 DOM
-
2026-06-01days on market $114,900 Active 22 DOM
-
2026-05-31days on market $114,900 Active 21 DOM
-
2026-05-18status Pending 414-char remark
-
2026-04-29$114,900 Active 414-char remark
-
2024-03-20soldstatus $145,000
-
2018-10-04soldstatus
-
2000-07-20soldstatus $47,500
-
1996-08-01soldstatus
-
1983-06-01soldstatus $36,000
ⓘ Source: listings_history table (triggers on properties + properties_extension) + one-shot
backfill from property_details.listing_events for pre-trigger history.
Tax reassessment forecast MO · Resets to sale price
- Current annual tax
- $1,544 · $129/mo
- Projected year-2 tax
- $1,544 · $129/mo
- Expected delta
- $0/yr ($0/mo · 0.0%)
ⓘ Screening estimate from a state-policy table — verify with the county assessor before closing.
Climate risk First Street
- Flood 1/10 Low FEMA zone X (unshaded) · 0% chance over 30 yrs
- Wildfire 1/10 Low
- Heat 5/10 Major 7 d/yr ≥107°F today · 20 d/yr by 30 yrs out
- Wind 2/10 Low 100% chance of damaging wind over 30 yrs
- Air quality 1/10 Low 0 unhealthy d/yr today · 0 by 30 yrs out
Nearby sold comps map
Loading sold comps map…
Walkable amenities ~0.75 mi
Loading nearby amenities…
Taxation est. · year 1
- Rental income
- $23,420
- − Mortgage interest
- −$6,436
- − Property taxes
- −$1,544
- − Insurance
- −$574
- − Repairs & maintenance
- −$1,874
- − Management
- −$1,874
- − HOA
- −$5,136
- − Depreciation
- −$3,343
- Taxable income
- $2,639
- Est. tax owed @ 24.0%
- −$633
- After-tax cash flow
- $3,383/yr
For passive investors: Depreciation is non-cash, so a rental often shows a tax loss while cash-flowing — sheltering income. Rental losses are passive: they offset passive income freely, and up to $25,000/yr can offset ordinary (W-2) income if you actively participate and your MAGI is under $100k (phasing out to $0 by $150k); unused losses carry forward. On sale, claimed depreciation is recaptured at up to 25%, and gains may owe capital-gains tax (a 1031 exchange can defer both). Figures are a year-1 estimate at your 24.0% rate — not tax advice; consult a CPA.
Schools (NCES district)
- District
- Wentzville R-IV
- NCES district ID
- 2931650
- Math proficiency
- 44% ▼ -9.00%
- Reading proficiency
- 52% ▼ -7.00%
- Median HH income
- $74,961
- Composite
- 43.49/100
- National rank
- #2994
- State rank
- #32 of 324 in MO
Livability — Lake St. Louis
No livability data for this city. (Only ~50 U.S. cities are tracked.)
Census & demographics
- Census place
- Lake St. Louis, MO
- County
- Saint Charles County · 399,703 people
- City population
- 27,893
- Metro
- St. Louis, MO-IL
- Population (ZIP)
- 29,725
- Household income
- $137,648
- Rent vs Own
- Severe rent burden
- 184.0
Population outlook (St. Charles County) Hauer SSP2
- Today (2025)
- 437,857 people
- By 2030
- 461,707 · +5.4%
- By 2040
- 503,222 · +14.9%
- By 2050
- 534,684 · +22.1%
- By 2075
- 597,047 · +36.4%
- By 2100
- 609,682 · +39.2%
Race, ethnicity, and origin ACS 2023
- Neighborhood character
- Predominantly White (86%)
- Race & ethnicity
- White 86% Two or more races 6% Black 5% Hispanic / Latino 3% Asian 2%
- Common ancestry
- Lithuanian 4% Romanian 4% Italian 3%
- Foreign-born
- 4% · Canada
- Languages at home
- 96% English-only · Spanish 2% Other Indo-European 1%
Political lean MEDSL · St. Charles
- 2024 margin
- R (+17.0) · D 40.8% · R 57.8% · Other 1.4%
- 2008→2024 swing
- -7.2pp toward R · 2008: -9.7pp · 2024: -17.0pp
- All cycles
- 2024: R+17.0 2020: R+17.5 2016: R+26.4 2012: R+21.0 2008: R+9.7
Not yet ingested
- Civics
- —
Market trends
- HPI YoY
- ▼ -165.38%
- Current HPI
- 208.2774
- Rent YoY
- ▲ 4.21%
- Metro
- St. Louis, MO-IL
- State GDP YoY
- ▲ 1.84%
- F500 in state
- 20
Industry mix (Fortune 500 HQ in MO)
| Industry | F500 HQs | Revenue |
|---|---|---|
| Healthcare | 1 | $163B |
|
||
| Insurance | 1 | $21B |
|
||
| Industrial Technology | 1 | $17B |
|
||
| Retail | 1 | $16B |
|
||
| Industrial Distribution | 1 | $10B |
|
||
| Utilities | 1 | $9B |
|
||
Price history
+219.2% since first listed8 events — show timeline
- 2026-05-29 Relisted — MARIS as Distributed by MLS Grid
- 2026-05-18 Pending — MARIS as Distributed by MLS Grid
- 2026-04-29 Listed $114,900 MARIS as Distributed by MLS Grid
- 2024-03-20 Sold (Public Records) $145,000 Public Records
- 2018-10-04 Sold (Public Records) — Public Records
- 2000-07-20 Sold (Public Records) $47,500 Public Records
- 1996-08-01 Sold (Public Records) — Public Records
- 1983-06-01 Sold (Public Records) $36,000 Public Records
Property tax history
+9.2%/yrLatest (2025): $1,544 · +16.6% YoY. Source: county tax records.
Cash-flow waterfall
monthlySold comps — $/sqft
last 12 mo · ≤1 miLoading sold comps…