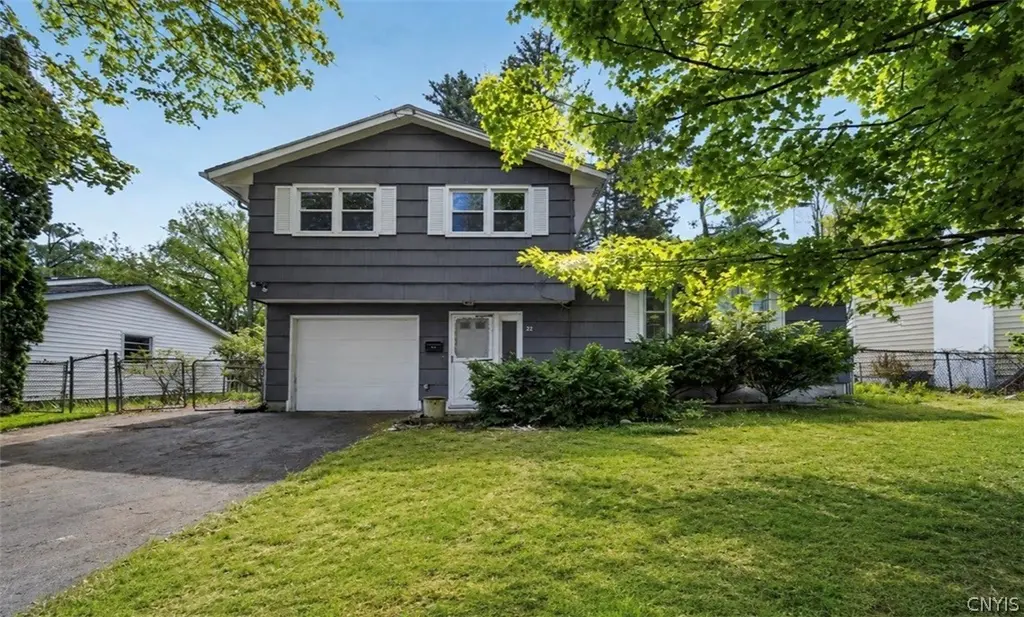
22 Apricot Ln · Liverpool, NY
Flood risk 1/10 · Minimal
- FEMA flood zone
- X (unshaded)
- Chance of flooding over 30 yrs
- 0.0%
- Est. flood insurance / yr
- $473 – $860
Fire risk 1/10 · Minimal
- Est. fire insurance / yr
- $691 – $1,283
Heat risk 3/10 · Minor
- Hot days now (above 95°F)
- 7 days/yr
- Hot days in 30 yrs
- 16 days/yr
Wind risk 1/10 · Minimal
- Chance of severe wind over 30 yrs
- —
Air-quality risk 2/10 · Minimal
- Unhealthy air days now
- 0 days/yr
- Unhealthy air days in 30 yrs
- 1 days/yr
Risk factors via First Street. Map © Google.
Why this score? — see what drove the D+ grade
The composite is a weighted blend of 9 inputs, each scored 0–100. Each bar is that input's sub-score; the figure is the points it added to the 100-point composite (weight × sub-score).
- ARV discount +15.0/15.0
- Cash flow +12.3/30.0
- 1% rule +5.0/10.0
- Schools +4.3/10.0
- Livability +4.3/5.0
- DSCR +3.6/10.0
- Rent growth +2.5/5.0
- Condition / age +2.5/5.0
- Appreciation +0.0/10.0
$199,000
🖨 Deal sheet (PDF) 📄 Offer letter ✓ Due diligence
Listing remarks
Charming split-level home in Liverpool’s Bayberry neighborhood offering 1,364 SF with 4 bedrooms and 1.5 baths. The upper level features 3 bedrooms, while the lower level includes a possible 4th bedroom or office. Original hardwood floors run throughout much of the home, and the living room features a beautiful stone fireplace with a wood-burning stove and a large picture window providing abundant natural light. The kitchen overlooks the backyard, and sliding doors off the dining area lead to a large back deck ideal for entertaining. The property also includes a storage shed for additional outdoor storage. The basement was formerly used as a rec room and includes a half bath, dry bar
Key facts
- Wood-burning stove
- Large picture window
- Stone fireplace
Tags
Property features AI
Exterior
- Parking: Attached garage with storage and workshop space (1 car)
- Utilities: Electricity available; Public water; Sewer connected
- Home design: Single-story home; Resale property
- Construction: Cedar and wood siding; Asphalt shingle roof; Block foundation; Existing construction
- Exterior features: Deck; Blacktop driveway; Shed(s) and exterior storage
Interior
- Kitchen: Built-in range; Built-in oven; Electric cooktop; Dishwasher; Refrigerator
- Bedrooms: One main-level bedroom
- Flooring: Hardwood; Varied flooring
- Bathrooms: One full bathroom; One half bathroom
- Heating & cooling: Gas forced-air heating
- Interior features: Separate/formal dining room; Entrance foyer; Separate/formal living room; Home office; Basement (partial) with sump pump; Fireplace (1)
- Laundry & utility: Washer and dryer in basement
Neighborhood map
What this means for you Summary
Snapshot
- This is a 3-bed/1.5-bath single-family listed at $199k.
Deal economics
- At list price, monthly cash flow is $-38 ($-451/yr) — negative.
- To cash-flow at today's rent, offer at most $192k (3.3% below list).
- To meet the 1% rule (rent ≥ 1% of price), the offer needs to be $199k (0.1% below list).
- Recommended offer: $192k (3.3% below list) — sets the bar for cash-flow.
- Cap rate 6.1% vs local median 5.0% in Liverpool — meaningfully above typical; check what's discounted (condition, days-on-market, listing class) to confirm the premium yield is real.
Location & tenants
- Location reads 86/100 on livability (#16 in NY, #363 nationally) — a professional / high-income tenant draw. Strengths: commute A+, housing A+, health & safety A+.
- Liverpool Central School District (suburban): math 49% / reading 49% proficiency, ranked #381 of 590 in NY (top 65%) — families likely to look elsewhere, expect single-tenant / working-renter base with shorter leases.
- Zoned schools: Elmcrest Elementary School (math 45% / reading 53%, grade D, #1,177 of 2,108 statewide, top 56%, 408 students, 38% FRL); Liverpool Middle School (math 47% / reading 62%, grade B-, #214 of 729 statewide, top 31%, 313 students, 51% FRL); Liverpool High School (math 94% / reading 54%, grade B+, #658 of 1,100 statewide, top 60%, 2,124 students, 42% FRL) — zoned schools average 44% FRL vs 28% district-wide (16 pts higher); higher-poverty schools than district average — tighter screening recommended.
- Market conditions: 94 active listings in the ZIP; 4 comparable units currently listed for rent nearby; rentals lingering (median 45d on market — plan ~5-8 weeks vacancy on turnover, expect pricing pressure); 50% of comp listings sitting > 30 days — soft ceiling on asking rent; solid renter incomes; 616 units permitted in Onondaga County in 2024 (256 in 5+ unit buildings).
Forward outlook
- Local home prices are declining (-3.0%/yr); year-one equity from $1k of loan paydown is wiped out by about $6k of value loss. Plan a longer hold.
- Onondaga County population projected to shrink 9% by 2050 — rents likely to lag national; underwrite the cash flow, not the appreciation.
Negotiation context
- Only 14 days on market — expect competitive offers; lowballing is unlikely to land.
Risks & watch-outs
- Watch-outs: property tax is 2.9% of price.
Questions for the listing agent
- What do current leases actually rent for vs. the listed asking? Can we see a recent rent roll and the last 12 months of T-12 income?
- Built in 1962 — when were the roof, HVAC, electrical panel, plumbing, and water heater last replaced?
- Property tax is high relative to price — has the assessment been appealed recently, and will the sale trigger a re-assessment?
- Is there a deadline driving the sale (1031 exchange, divorce, estate, relocation)? That informs how much negotiation room exists.
- The area grade is low — what's the realistic commute time and amenity access for the typical tenant pool here? Any planned neighborhood developments (good or bad) we should know about?
- What's the average days-on-market for RENTAL listings here right now (not sales)? A rising rental-DOM trend means longer vacancies and softer asking-rent achievability than the comps imply.
- What's the recent tenant-quality profile in this submarket — average credit score on applications, eviction rate, late-payment / NSF rate, and stable-employment percentage? A property-management company in the area should have these aggregated.
- How much new for-sale + rental construction is in the pipeline within 1–3 miles? Heavy new supply typically softens prices + rents 12–24 months out; constrained supply supports both.
Investment metrics
- 1% rule
- 1.00% ✗
- Cap rate
- 6.07%
- Cash-on-cash
- -0.81%
- DSCR
- 0.96
- GRM
- 8.3
CMA / ARV
- ARV (median comp)
- $287,456
- List price
- $199,000
- Delta
- -30.77%
- Verdict
- UNDERPRICED
- Comps
- 20 within 1.0 mi
Show comp detail 12 sales within ~0.75 mi
| Address | Dist | Beds/Ba | Sqft | Sold | Price | $/sf | Match |
|---|---|---|---|---|---|---|---|
| 106 Pinewood Dr | 0.37mi | 3/2.0 | 1,365 (+0%) | 2mo | $290,000 | $212 | 79 |
| 4170 Wetzel Rd | 0.42mi | 3/2.0 | 1,311 (-4%) | 4mo | $235,437 | $180 | 69 |
| 4106 Wetzel Rd | 0.42mi | 3/1.0 | 1,296 (-5%) | 6mo | $220,000 | $170 | 65 |
| 115 Sotherden Dr | 0.30mi | 3/1.5 | 1,236 (-9%) | 8mo | $248,000 | $201 | 64 |
| 6 Quail Path | 0.57mi | 3/1.5 | 1,308 (-4%) | 6mo | $290,000 | $222 | 62 |
| 210 Blackberry Rd | 0.33mi | 3/2.5 | 1,484 (+9%) | 8mo | $289,500 | $195 | 59 |
| 114 Glenwood Dr S | 0.30mi | 4/2.0 (+1) | 1,488 (+9%) | 7mo | $220,000 | $148 | 58 |
| 81 Bayberry Cir | 0.74mi | 3/1.5 | 1,342 (-2%) | 9mo | $255,000 | $190 | 56 |
| 48 Bayberry Cir | 0.69mi | 3/1.5 | 1,440 (+6%) | 6mo | $250,000 | $174 | 54 |
| 4252 Vega Crse | 0.66mi | 3/1.5 | 1,248 (-8%) | 9mo | $225,000 | $180 | 48 |
| 13 Ilex Ln | 0.67mi | 4/2.0 (+1) | 1,234 (-10%) | 8mo | $210,000 | $170 | 39 |
| 4190 Gemini | 0.70mi | 3/1.5 | 1,176 (-14%) | 9mo | $283,000 | $241 | 37 |
Match score weights: distance 35% · size 25% · config 20% · recency 20%. Top-matched comps best support the ARV.
Projected returns pro-forma
-3.0% appreciation · 3.0% rent growth · sell at horizon
- IRR
- -17.5%
- Equity multiple
- 0.38×
- Total profit
- $-34,465
- Equity at exit
- $29,672
- IRR
- -9.4%
- Equity multiple
- 0.42×
- Total profit
- $-32,387
- Equity at exit
- $17,206
Cash invested: $55,720 (down + closing). Projections, not guarantees.
Landlord ↔ Tenant lean methodology
- Overall (STATE)
- 15 Strongly Tenant-Friendly
- State New York
- 15 Strongly Tenant-Friendly · D+10
- County
- — inherits STATE
- City
- — inherits STATE
ZIP-level market 13090
- Active inventory
- 94
- Price-to-rent
- 8.3×
Monthly cashflow live
- Estimated rent
- $1,989 medium interval (Pro) →
- Mortgage (P&I)
- −$1,044
- Tax from tax record
- −$482 /mo · $5,784/yr
- Insurance
- −$83
- HOA
- −$0
- Vacancy / Maint / Mgmt
- −$418
- Net cashflow
- $-38
Break-even live
Sensitivity live
| Price | -10% $75 | -5% $19 | +0% $-38 | +5% $-94 | +10% $-150 |
|---|---|---|---|---|---|
| Rent | -10% $-195 | -5% $-116 | +0% $-38 | +5% $41 | +10% $120 |
| Rate | -1.0pp $63 | -0.5pp $13 | base $-38 | +0.5pp $-89 | +1.0pp $-142 |
UW: 25.0% down · 7.5% · 30yr · 1.5% tax · 5.0% vac · 8.0% maint · 8.0% mgmt
Financing live
Cash to close
- Down payment
- $49,750
- Closing costs
- $5,970
- Reserves months
- —
- Total cash needed
- —
Loan-product check · same deal, 3 products live
Conventional
25% down · 7.5% · 30yr
- Down + closing
- —
- Monthly P&I
- —
- Monthly cashflow
- —
- DSCR
- —
- Eligible?
- —
Personal DTI + credit; lowest rate.
DSCR
20% down · 8.5% · 30yr
- Down + closing
- —
- Monthly P&I
- —
- Monthly cashflow
- —
- DSCR
- —
- Eligible?
- —
No personal income docs; deal must DSCR.
Hard money
10% down · 12.0% · 12mo
- Down + closing
- —
- Monthly P&I
- —
- Monthly cashflow
- —
- DSCR
- —
- Eligible?
- —
Short-term bridge; refi at stabilization.
Rent comps 4 comps
| Address | Beds | Baths | Sqft | Rent | $/sqft | DOM | Units | Dist |
|---|---|---|---|---|---|---|---|---|
| 4314 Wetzel Rd Liverpool, NY | 2.0 | 1.0 | 900 | $1,200 | $1.33 | 45d | 1 | 0.65mi |
| 66 Grampian Rd Liverpool, NY | 1.0–2.0 | 1.0 | 840 | $1,300 | $1.55 | 45d | 1 | 1.25mi |
| 1 Gallowgate Ct Liverpool, NY | 3.0 | 1.5 | 1585 | $1,698 | $1.07 | 15d | 1 | 1.27mi |
| 364 Cameco Cir Liverpool, NY | 2.0 | 1.5 | 1072 | $2,200 | $2.05 | 15d | 1 | 1.46mi |
Listing history 1 events
-
2026-05-13$199,000 Active 900-char remark
ⓘ Source: listings_history table (triggers on properties + properties_extension) + one-shot
backfill from property_details.listing_events for pre-trigger history.
Tax reassessment forecast NY · Partial reset (capped growth)
- Current annual tax
- $5,784 · $482/mo
- Projected year-2 tax
- $5,784 · $482/mo
- Expected delta
- $0/yr ($0/mo · 0.0%)
ⓘ Screening estimate from a state-policy table — verify with the county assessor before closing.
Climate risk First Street
- Flood 1/10 Low FEMA zone X (unshaded) · 0% chance over 30 yrs
- Wildfire 1/10 Low
- Heat 3/10 Moderate 7 d/yr ≥95°F today · 16 d/yr by 30 yrs out
- Wind 1/10 Low
- Air quality 2/10 Low 0 unhealthy d/yr today · 1 by 30 yrs out
Nearby sold comps map
Loading sold comps map…
Walkable amenities ~0.75 mi
Loading nearby amenities…
Taxation est. · year 1
- Rental income
- $23,863
- − Mortgage interest
- −$11,147
- − Property taxes
- −$5,784
- − Insurance
- −$995
- − Repairs & maintenance
- −$1,909
- − Management
- −$1,909
- − Depreciation
- −$5,789
- Taxable loss
- −$3,671
- Est. tax savings @ 24.0%
- +$881
- After-tax cash flow
- $430/yr
For passive investors: Depreciation is non-cash, so a rental often shows a tax loss while cash-flowing — sheltering income. Rental losses are passive: they offset passive income freely, and up to $25,000/yr can offset ordinary (W-2) income if you actively participate and your MAGI is under $100k (phasing out to $0 by $150k); unused losses carry forward. On sale, claimed depreciation is recaptured at up to 25%, and gains may owe capital-gains tax (a 1031 exchange can defer both). Figures are a year-1 estimate at your 24.0% rate — not tax advice; consult a CPA.
Schools (NCES district)
- District
- Liverpool Central School District
- NCES district ID
- 3617520
- Math proficiency
- 49% ▼ -6.00%
- Reading proficiency
- 49% ▲ 1.00%
- Median HH income
- $59,134
- Composite
- 42.84/100
- National rank
- #3134
- State rank
- #381 of 590 in NY
Livability — Liverpool
- Score
- 86/100
- State rank
- #16
- US rank
- #363
Category grades
Schools grade is shown separately in the Schools card above.
Census & demographics
- County
- Onondaga County · 247,257 people
- City population
- 29,004
- Metro
- Syracuse, NY
- Population (ZIP)
- 29,004
- Household income
- $88,492
- Rent vs Own
- Severe rent burden
- 733.0
Population outlook (Onondaga County) Hauer SSP2
- Today (2025)
- 467,894 people
- By 2030
- 463,381 · -1.0%
- By 2040
- 447,697 · -4.3%
- By 2050
- 426,399 · -8.9%
- By 2075
- 373,661 · -20.1%
- By 2100
- 307,967 · -34.2%
Race, ethnicity, and origin ACS 2023
- Neighborhood character
- Predominantly White (79%)
- Race & ethnicity
- White 79% Two or more races 9% Hispanic / Latino 7% Black 6% Asian 3%
- Hispanic origin (detail)
- Mexican 1% Puerto Rican 4%
- Common ancestry
- Romanian 7% Lithuanian 4% Italian 2%
- Foreign-born
- 6% · Canada, China, South Korea
- Languages at home
- 93% English-only · Other Indo-European 2% Spanish 1% Russian/Polish/Slavic 1%
Political lean MEDSL · Onondaga
- 2024 margin
- D (+17.3) · D 58.6% · R 41.4%
- 2008→2024 swing
- -3.0pp toward R · 2008: 20.3pp · 2024: 17.3pp
- All cycles
- 2024: D+17.3 2020: D+20.6 2016: D+12.8 2012: D+21.1 2008: D+20.3
Not yet ingested
- Civics
- —
Market trends
- HPI YoY
- ▼ -228.53%
- Current HPI
- 320.4989
- Rent YoY
- —
- Metro
- Syracuse, NY
- State GDP YoY
- ▲ 2.60%
- F500 in state
- 92
Industry mix (Fortune 500 HQ in NY)
| Industry | F500 HQs | Revenue |
|---|---|---|
| Financial Services | 10 | $950B |
|
||
| Consumer Goods | 9 | $162B |
|
||
| Insurance | 4 | $225B |
|
||
| Telecommunications | 2 | $144B |
|
||
| Pharmaceuticals | 2 | $112B |
|
||
| Media / Entertainment | 2 | $69B |
|
||
Price history
3 events — show timeline
- 2026-05-28 Pending — CNYIS
- 2026-05-23 Contingent — CNYIS
- 2026-05-13 Listed $199,000 CNYIS
Property tax history
+3.4%/yrLatest (2025): $5,784 · +5.2% YoY. Source: county tax records.
Cash-flow waterfall
monthlySold comps — $/sqft
last 12 mo · ≤1 miLoading sold comps…