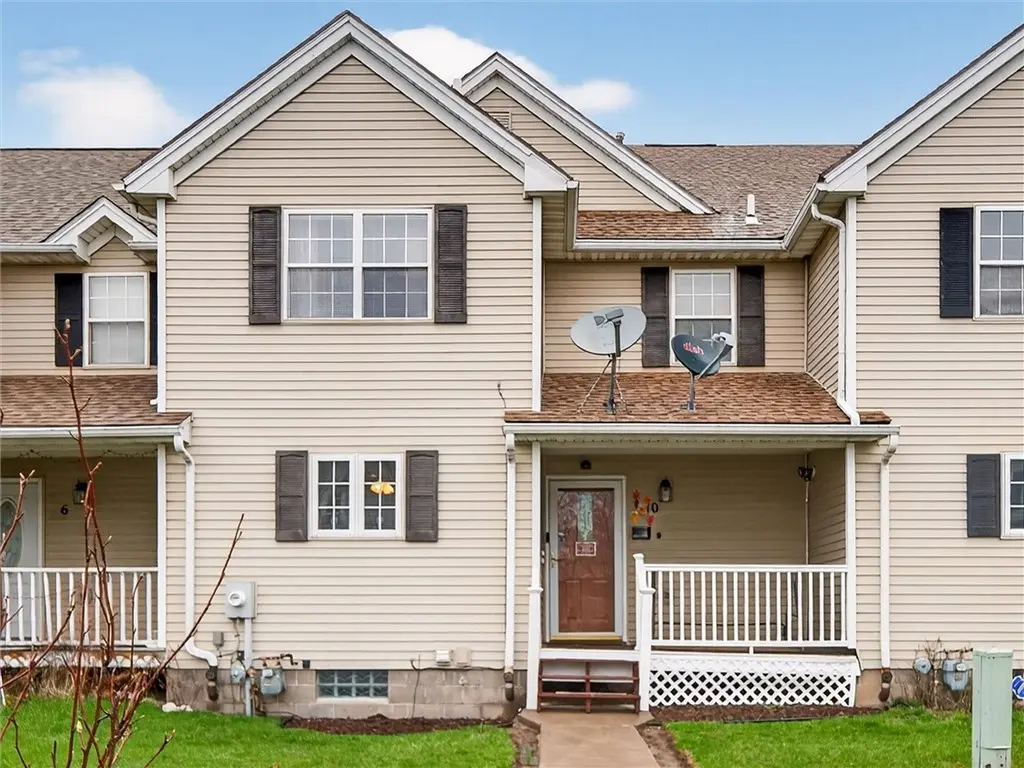
10 Wangman St · Rochester, NY
Flood risk 1/10 · Minimal
- FEMA flood zone
- X (unshaded)
- Chance of flooding over 30 yrs
- 0.0%
- Est. flood insurance / yr
- $473 – $860
Fire risk 1/10 · Minimal
- Est. fire insurance / yr
- $691 – $1,283
Heat risk 2/10 · Minimal
- Hot days now (above 95°F)
- 7 days/yr
- Hot days in 30 yrs
- 15 days/yr
Wind risk 1/10 · Minimal
- Chance of severe wind over 30 yrs
- —
Air-quality risk 2/10 · Minimal
- Unhealthy air days now
- 1 days/yr
- Unhealthy air days in 30 yrs
- 2 days/yr
Risk factors via First Street. Map © Google.
Why this score? — see what drove the B- grade
The composite is a weighted blend of 9 inputs, each scored 0–100. Each bar is that input's sub-score; the figure is the points it added to the 100-point composite (weight × sub-score).
- Cash flow +30.0/30.0
- 1% rule +10.0/10.0
- DSCR +10.0/10.0
- Appreciation +5.4/10.0
- Livability +3.8/5.0
- Rent growth +2.5/5.0
- Condition / age +2.5/5.0
- Schools +1.9/10.0
- ARV discount +0.2/15.0
$124,900
🖨 Deal sheet (PDF) 📄 Offer letter ✓ Due diligence
Listing remarks MLS
Quaint 6 Unit Townhome Development with No HOA FEES * Great curb appeal * Built 1995 * Excellent condition * New Central Air 2008 * Very dry 12 course basement used as recreation room * Sliding glass patio doors lead to yard *
Key facts
- Bright living space
- New furnace
- New walk-in shower
Tags
Property features AI
Exterior
- Parking: Attached garage (1 car)
- Utilities: Public water connected; Sewer connected
- Home design: 2-story house; Existing construction; Vinyl siding
- Construction: Block foundation
- Exterior features: Blacktop driveway; Open porch
Interior
- Kitchen: Convection oven; Dishwasher; Refrigerator; Gas water heater
- Flooring: Carpet; Vinyl; Varied flooring
- Bathrooms: 1 full bathroom; 1 half bathroom; 1 main-level bathroom
- Heating & cooling: Gas forced-air heating; Central air conditioning
- Interior features: Kitchen/family room combo; Low threshold shower
- Laundry & utility: Laundry in basement
Neighborhood map
What this means for you Summary
Snapshot
- This is a 3-bed/1.5-bath single-family listed at $125k.
Deal economics
- At list price, monthly cash flow is $730 ($9k/yr) — positive.
- The deal already cash-flows at list — no discount required.
- Meets the 1% rule at list price ($2k rent vs $125k).
- Cap rate 13.3% vs local median 9.3% in Rochester — top-decile yield for the area; either an underpriced asset or a hidden risk that comps aren't pricing in. Stress-test before assuming the spread holds.
Location & tenants
- Location reads 76/100 on livability (#222 in NY, #3,482 nationally) — a middle-class / working-renter tenant base. Strengths: commute A+, cost of living A+, housing A+; Watch: crime F, employment F.
- Rochester City School District (urban): math 21% / reading 26% proficiency, ranked #589 of 590 in NY (top 100%) — low school quality limits family demand, transient renter base, plan for 1-2y turnover; 82% free/reduced lunch — lower-income household profile, screen leases tightly.
- Zoned schools: School 45-Mary Mcleod Bethune (math 2% / reading 12%, grade F, #2,087 of 2,108 statewide, top 99%, 519 students, 95% FRL); East Lower School (math 2% / reading 22%, grade F, #715 of 729 statewide, top 98%, 304 students, 86% FRL); Edison Career And Technology High School (math 44% / reading 50%, grade D-, #1,007 of 1,100 statewide, top 93%, 1,233 students, 91% FRL).
- Market conditions: 32 active listings in the ZIP; 40 comparable units currently listed for rent nearby; rentals at typical pace (median 23d on market — plan ~3-4 weeks tenant-placement turnaround); lower-income renter base — watch delinquency; 1,169 units permitted in Monroe County in 2024 (591 in 5+ unit buildings).
- At $1,930/mo this rent would consume 109% of the median local household income ($21k/yr) (locally 1108% of renters already pay >50% of income on rent) — very limited rent-growth headroom before tenants either downsize or default.
Forward outlook
- In year one you build about $2k of equity ($864 loan paydown + $1k appreciation (0.8% local appreciation)).
- Monroe County population projected to shrink 6% by 2050 — rents likely to lag national; underwrite the cash flow, not the appreciation.
- At projected returns (0.8% appreciation + 3.0% rent growth), your $35k cash investment doubles in ~4 years — after that, you're playing with house money.
Negotiation context
- Only 9 days on market — expect competitive offers; lowballing is unlikely to land.
- 3 sale attempts since 16y ago with the ask held roughly flat each time — persistent listings suggest the price (not the market) is what's stuck; bring a comps-based counter.
- Current owner paid $60k; list at $125k implies a 109% gain — meaningful room to come down on a strong offer.
Questions for the listing agent
- Is there a deadline driving the sale (1031 exchange, divorce, estate, relocation)? That informs how much negotiation room exists.
- Schools are D-rated, which usually means shorter tenancies and higher turnover. Who's the typical renter profile here, and what's been the actual vacancy rate?
- Crime grade is F in this area — have there been break-ins, vandalism, or insurance claims at this property in the last 3 years? What carrier currently insures it and at what premium?
- What's the average days-on-market for RENTAL listings here right now (not sales)? A rising rental-DOM trend means longer vacancies and softer asking-rent achievability than the comps imply.
- What's the recent tenant-quality profile in this submarket — average credit score on applications, eviction rate, late-payment / NSF rate, and stable-employment percentage? A property-management company in the area should have these aggregated.
- How much new for-sale + rental construction is in the pipeline within 1–3 miles? Heavy new supply typically softens prices + rents 12–24 months out; constrained supply supports both.
Investment metrics
- 1% rule
- 1.55% ✓
- Cap rate
- 13.30%
- Cash-on-cash
- 25.03%
- DSCR
- 2.11
- GRM
- 5.4
CMA / ARV
- ARV (on-the-fly)
- $107,568
- Comps found
- 12
Show comp detail 12 sales within ~0.75 mi
| Address | Dist | Beds/Ba | Sqft | Sold | Price | $/sf | Match |
|---|---|---|---|---|---|---|---|
| 24 Peters Pl | 0.07mi | 3/1.5 | 1,380 (+4%) | 5mo | $210,000 | $152 | 86 |
| 144 Peck St | 0.28mi | 3/1.5 | 1,264 (-5%) | 0mo | $173,000 | $137 | 79 |
| 155 3rd St | 0.31mi | 4/1.0 (+1) | 1,392 (+5%) | 2mo | $67,500 | $48 | 69 |
| 147 5th St | 0.40mi | 4/1.0 (+1) | 1,289 (-3%) | 3mo | $150,000 | $116 | 67 |
| 104 Peck St | 0.33mi | 3/1.5 | 1,200 (-10%) | 6mo | $175,000 | $146 | 63 |
| 947 Clifford Ave | 0.62mi | 3/1.0 | 1,275 (-4%) | 7mo | $85,000 | $67 | 56 |
| 865 N Goodman St | 0.62mi | 4/1.5 (+1) | 1,245 (-6%) | 2mo | $76,000 | $61 | 54 |
| 64 Carter St | 0.67mi | 4/1.0 (+1) | 1,363 (+3%) | 7mo | $111,000 | $81 | 52 |
| 67 Keller St | 0.73mi | 4/1.0 (+1) | 1,368 (+3%) | 5mo | $139,900 | $102 | 50 |
| 70 Ferndale Cres | 0.61mi | 4/2.0 (+1) | 1,478 (+11%) | 6mo | $50,000 | $34 | 40 |
| 94 Carter St | 0.71mi | 3/1.0 | 1,150 (-13%) | 5mo | $72,000 | $63 | 38 |
| 984 Clifford Ave | 0.62mi | 4/1.0 (+1) | 1,136 (-14%) | 5mo | $33,000 | $29 | 35 |
Match score weights: distance 35% · size 25% · config 20% · recency 20%. Top-matched comps best support the ARV.
Projected returns pro-forma
0.83% appreciation · 3.0% rent growth · sell at horizon
- IRR
- 26.9%
- Equity multiple
- 2.36×
- Total profit
- $47,732
- Equity at exit
- $41,511
- IRR
- 29.7%
- Equity multiple
- 4.53×
- Total profit
- $123,509
- Equity at exit
- $54,304
Cash invested: $34,972 (down + closing). Projections, not guarantees.
Landlord ↔ Tenant lean methodology
- Overall (STATE)
- 15 Strongly Tenant-Friendly
- State New York
- 15 Strongly Tenant-Friendly · D+10
- County
- — inherits STATE
- City
- — inherits STATE
ZIP-level market 14605
- Home prices YoY
- 0.4%
- Active inventory
- 32
- Price-to-rent
- 5.4×
Monthly cashflow live
- Estimated rent
- $1,930 high interval (Pro) →
- Mortgage (P&I)
- −$655
- Tax from tax record
- −$88 /mo · $1,060/yr
- Insurance
- −$52
- HOA
- −$0
- Vacancy / Maint / Mgmt
- −$405
- Net cashflow
- $730
Break-even live
Sensitivity live
| Price | -10% $800 | -5% $765 | +0% $730 | +5% $694 | +10% $659 |
|---|---|---|---|---|---|
| Rent | -10% $577 | -5% $653 | +0% $730 | +5% $806 | +10% $882 |
| Rate | -1.0pp $793 | -0.5pp $761 | base $730 | +0.5pp $697 | +1.0pp $664 |
UW: 25.0% down · 7.5% · 30yr · 1.5% tax · 5.0% vac · 8.0% maint · 8.0% mgmt
Financing live
Cash to close
- Down payment
- $31,225
- Closing costs
- $3,747
- Reserves months
- —
- Total cash needed
- —
Loan-product check · same deal, 3 products live
Conventional
25% down · 7.5% · 30yr
- Down + closing
- —
- Monthly P&I
- —
- Monthly cashflow
- —
- DSCR
- —
- Eligible?
- —
Personal DTI + credit; lowest rate.
DSCR
20% down · 8.5% · 30yr
- Down + closing
- —
- Monthly P&I
- —
- Monthly cashflow
- —
- DSCR
- —
- Eligible?
- —
No personal income docs; deal must DSCR.
Hard money
10% down · 12.0% · 12mo
- Down + closing
- —
- Monthly P&I
- —
- Monthly cashflow
- —
- DSCR
- —
- Eligible?
- —
Short-term bridge; refi at stabilization.
Rent comps 40 comps
| Address | Beds | Baths | Sqft | Rent | $/sqft | DOM | Units | Dist |
|---|---|---|---|---|---|---|---|---|
| 147 5th St Rochester, NY | 4.0 | 1.0 | 1289 | $1,950 | $1.51 | 23d | 1 | 0.40mi |
| 395 Alexander St Unit UN12 Rochester, NY | 2.0 | 1.5 | 1226 | $2,200 | $1.79 | 16d | 1 | 0.59mi |
| 25 Trust St Rochester, NY | 3.0 | 1.5 | 1003 | $1,600 | $1.60 | 4d | 1 | 0.65mi |
| 52 Frances St Rochester, NY | 4.0 | 1.0 | 1256 | $1,595 | $1.27 | 45d | 1 | 0.67mi |
| 152 Gibbs St Rochester, NY | 1.0–2.0 | 1.0 | 950 | $1,875 | $1.97 | 15d | 3 | 0.70mi |
| 128 Gibbs St Unit 130 Rochester, NY | 2.0 | 1.0 | 1000 | $1,875 | $1.88 | 12d | 1 | 0.73mi |
| 128 Gibbs St Unit 136 Rochester, NY | 2.0 | 1.0 | 900 | $1,795 | $1.99 | 12d | 1 | 0.73mi |
| 47 Priscilla St Rochester, NY | 4.0 | 1.5 | 1250 | $1,900 | $1.52 | 23d | 1 | 0.77mi |
| 126 Parsells Ave Rochester, NY | 3.0 | 1.0 | 1574 | $1,800 | $1.14 | 23d | 1 | 0.77mi |
| 126 Parsells Ave Rochester, NY | 3.0 | 1.0 | 1574 | $1,800 | $1.14 | 45d | 1 | 0.77mi |
| 127 Carter St #125 Rochester, NY | 2.0 | 1.0 | 1320 | $1,400 | $1.06 | 45d | 1 | 0.78mi |
| 200 East Ave Rochester, NY | 1.0–2.0 | 1.0–2.5 | 936 | $2,481 | $2.65 | 45d | 1 | 0.79mi |
| 474 East Ave Rochester, NY | 1.0–2.0 | 1.0–2.0 | 1125 | $2,800 | $2.49 | 25d | 1 | 0.85mi |
| 195 Parsells Ave Rochester, NY | 4.0 | 1.0 | 1413 | $1,265 | $0.90 | 4d | 1 | 0.88mi |
| 21 Rundel Park Unit 2 Rochester, NY | 2.0 | 1.0 | 1250 | $2,099 | $1.68 | 20d | 1 | 0.88mi |
| 86-88 Baycliff Dr Unit 86 Rochester, NY | 2.0 | 1.0 | 900 | $1,030 | $1.14 | 23d | 1 | 0.89mi |
| 111 East Ave Rochester, NY | 2.0 | 1.0–2.0 | 614 | $1,900 | $3.09 | 45d | 1 | 0.90mi |
| 733 University Ave #3 Rochester, NY | 3.0 | 1.5 | 1400 | $1,850 | $1.32 | 45d | 1 | 0.91mi |
| 49 East Ave Apt 212 Rochester, NY | 2.0 | 2.0 | 961 | $2,572 | $2.68 | 4d | 1 | 0.91mi |
| 14 Franklin St Rochester, NY | 2.0 | 1.0–2.0 | 1345 | $3,477 | $2.59 | 4d | 8 | 0.92mi |
| 260 E Main St Rochester, NY | 3.0 | 1.0–2.0 | 1144 | $2,999 | $2.62 | 4d | 14 | 0.97mi |
| 811 Portland Ave Rochester, NY | 2.0 | 1.0 | 1616 | $1,300 | $0.80 | 16d | 1 | 0.97mi |
| 222 Ellison St Rochester, NY | 2.0 | 1.0 | 971 | $1,000 | $1.03 | 15d | 1 | 1.00mi |
| 207 Lux St Rochester, NY | 4.0 | 1.5 | 1728 | $2,150 | $1.24 | 12d | 1 | 1.02mi |
| 47 Savannah St Rochester, NY | 2.0 | 1.0–2.0 | 775 | $2,025 | $2.61 | 23d | 6 | 1.03mi |
| 176 Roycroft Dr Rochester, NY | 3.0 | 1.0 | 1169 | $950 | $0.81 | 12d | 1 | 1.03mi |
| 194 E Main St Rochester, NY | 1.0–2.0 | 1.0–2.0 | 875 | $2,095 | $2.39 | 16d | 1 | 1.06mi |
| 21 Arnold Park Rochester, NY | 2.0 | 1.0 | 750 | $1,425 | $1.90 | 4d | 15 | 1.09mi |
| 183 E Main St Rochester, NY | 1.0–2.0 | 1.0 | 1142 | $2,870 | $2.51 | 12d | 28 | 1.10mi |
| 80 St Paul St Rochester, NY | 1.0–2.0 | 1.5–2.5 | 1024 | $1,935 | $1.89 | 4d | 3 | 1.10mi |
| 933 University Ave Rochester, NY | 1.0–2.0 | 1.0–2.0 | 1295 | $3,815 | $2.94 | 4d | 12 | 1.13mi |
| 100 Fairbanks St Rochester, NY | 2.0 | 1.0 | 1456 | $1,100 | $0.76 | 46d | 1 | 1.16mi |
| 9 Rowley St Unit 3 Rochester, NY | 2.0 | 1.0 | 966 | $1,550 | $1.60 | 25d | 1 | 1.17mi |
| 15 Vick Park B Unit A Rochester, NY | 2.0 | 1.5 | 1616 | $2,350 | $1.45 | 25d | 1 | 1.18mi |
| 1890 Clifford Ave Rochester, NY | 3.0 | 1.0 | 936 | $1,800 | $1.92 | 25d | 1 | 1.19mi |
| 260 Oxford St Unit UP Rochester, NY | 2.0 | 1.0 | 1850 | $2,600 | $1.41 | 45d | 1 | 1.19mi |
| 171 Mohawk St Rochester, NY | 3.0 | 2.0 | 1054 | $1,775 | $1.68 | 45d | 1 | 1.20mi |
| 209 S Goodman St Rochester, NY | 2.0 | 2.0 | 1500 | $1,700 | $1.13 | 45d | 1 | 1.21mi |
| 239 Weyl St Rochester, NY | 3.0 | 1.0 | 1208 | $1,600 | $1.32 | 20d | 1 | 1.23mi |
| 459-461 Parsells Ave Rochester, NY | 2.0 | 1.0 | 1053 | $1,450 | $1.38 | 25d | 1 | 1.25mi |
Listing history 8 events
-
2026-04-15status Pending
-
2026-04-06$124,900 Active
-
2010-03-22soldstatus $59,900
-
2010-03-05soldstatus $59,900 226-char remark
Show marketing remark (226 chars)
Quaint 6 Unit Townhome Development with NO HOA FEES * Great curb appeal * Built 1995 * Excellent condition * New Central Air 2008 * Very dry 12 course basement used as recreation room * Sliding glass patio doors lead to yard *
-
2010-01-13$59,900 226-char remark
Show marketing remark (226 chars)
Quaint 6 Unit Townhome Development with NO HOA FEES * Great curb appeal * Built 1995 * Excellent condition * New Central Air 2008 * Very dry 12 course basement used as recreation room * Sliding glass patio doors lead to yard *
-
2010-01-13$59,900 226-char remark
Show marketing remark (226 chars)
Quaint 6 Unit Townhome Development with NO HOA FEES * Great curb appeal * Built 1995 * Excellent condition * New Central Air 2008 * Very dry 12 course basement used as recreation room * Sliding glass patio doors lead to yard *
-
1997-05-13soldstatus $86,100
ⓘ Source: listings_history table (triggers on properties + properties_extension) + one-shot
backfill from property_details.listing_events for pre-trigger history.
Tax reassessment forecast NY · Partial reset (capped growth)
- Current annual tax
- $1,060 · $88/mo
- Projected year-2 tax
- $1,585 · $132/mo
- Expected delta
- +$525/yr (+$44/mo · 49.6%)
ⓘ Screening estimate from a state-policy table — verify with the county assessor before closing.
Climate risk First Street
- Flood 1/10 Low FEMA zone X (unshaded) · 0% chance over 30 yrs
- Wildfire 1/10 Low
- Heat 2/10 Low 7 d/yr ≥95°F today · 15 d/yr by 30 yrs out
- Wind 1/10 Low
- Air quality 2/10 Low 1 unhealthy d/yr today · 2 by 30 yrs out
Nearby sold comps map
Loading sold comps map…
Walkable amenities ~0.75 mi
Loading nearby amenities…
Taxation est. · year 1
- Rental income
- $23,164
- − Mortgage interest
- −$6,996
- − Property taxes
- −$1,060
- − Insurance
- −$624
- − Repairs & maintenance
- −$1,853
- − Management
- −$1,853
- − Depreciation
- −$3,633
- Taxable income
- $7,143
- Est. tax owed @ 24.0%
- −$1,714
- After-tax cash flow
- $7,041/yr
For passive investors: Depreciation is non-cash, so a rental often shows a tax loss while cash-flowing — sheltering income. Rental losses are passive: they offset passive income freely, and up to $25,000/yr can offset ordinary (W-2) income if you actively participate and your MAGI is under $100k (phasing out to $0 by $150k); unused losses carry forward. On sale, claimed depreciation is recaptured at up to 25%, and gains may owe capital-gains tax (a 1031 exchange can defer both). Figures are a year-1 estimate at your 24.0% rate — not tax advice; consult a CPA.
Schools (NCES district)
- District
- Rochester City School District
- NCES district ID
- 3624750
- Math proficiency
- 21% ▬ 0.00%
- Reading proficiency
- 26% ▲ 4.00%
- Median HH income
- $30,923
- Composite
- 18.98/100
- National rank
- #8850
- State rank
- #589 of 590 in NY
Livability — Rochester
- Score
- 76/100
- State rank
- #222
- US rank
- #3482
Category grades
Schools grade is shown separately in the Schools card above.
Census & demographics
- Census place
- Rochester, NY
- County
- Monroe County · 674,131 people
- City population
- 432,803
- Metro
- Rochester, NY
- Population (ZIP)
- 11,783
- Household income
- $21,201
- Rent vs Own
- Severe rent burden
- 1108.0
Population outlook (Monroe County) Hauer SSP2
- Today (2025)
- 759,460 people
- By 2030
- 757,154 · -0.3%
- By 2040
- 740,644 · -2.5%
- By 2050
- 714,443 · -5.9%
- By 2075
- 645,883 · -15.0%
- By 2100
- 547,084 · -28.0%
Race, ethnicity, and origin ACS 2023
- Neighborhood character
- Diverse neighborhood (Simpson 0.64)
- Race & ethnicity
- Black 46% Hispanic / Latino 36% Two or more races 11% White 10% Asian 5%
- Hispanic origin (detail)
- Mexican 1% Puerto Rican 29% Cuban 2% Dominican 2%
- Common ancestry
- Hispanic 1% Romanian 1%
- Foreign-born
- 11% · Canada, China, India
- Languages at home
- 64% English-only · Spanish 27% Other Indo-European 4% French/Haitian/Cajun 2%
Political lean MEDSL · Monroe
- 2024 margin
- D (+19.1) · D 59.5% · R 40.5%
- 2008→2024 swing
- +1.4pp toward D · 2008: 17.7pp · 2024: 19.1pp
- All cycles
- 2024: D+19.1 2020: D+21.0 2016: D+14.1 2012: D+17.4 2008: D+17.7
Not yet ingested
- Civics
- —
Market trends
- HPI YoY
- ▲ 0.83%
- Current HPI
- 207.359
- Rent YoY
- —
- Metro
- Rochester, NY
- State GDP YoY
- ▲ 2.60%
- F500 in state
- 92
Industry mix (Fortune 500 HQ in NY)
| Industry | F500 HQs | Revenue |
|---|---|---|
| Financial Services | 10 | $950B |
|
||
| Consumer Goods | 9 | $162B |
|
||
| Insurance | 4 | $225B |
|
||
| Telecommunications | 2 | $144B |
|
||
| Pharmaceuticals | 2 | $112B |
|
||
| Media / Entertainment | 2 | $69B |
|
||
Price history
+45.1% since first listed8 events — show timeline
- 2026-04-15 Pending — UNYREIS
- 2026-04-06 Listed $124,900 UNYREIS
- 2010-03-22 Sold (Public Records) $59,900 Public Records
- 2010-03-05 Sold (MLS) $59,900 UNYREIS
- 2010-03-05 Sold (MLS) $59,900 UNYREIS
- 2010-01-13 Listed $59,900 UNYREIS
- 2010-01-13 Listed $59,900 UNYREIS
- 1997-05-13 Sold (Public Records) $86,100 Public Records
Property tax history
+2.5%/yrLatest (2025): $1,060 · +0.0% YoY. Source: county tax records.
Cash-flow waterfall
monthlySold comps — $/sqft
last 12 mo · ≤1 miLoading sold comps…