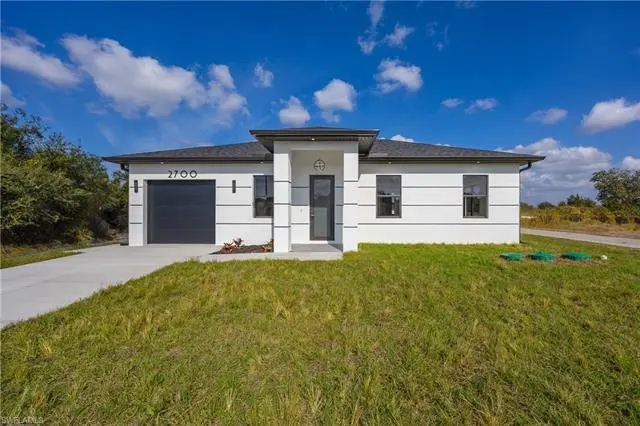
2700 49th St SW · Lehigh Acres, FL
Flood risk No data
- FEMA flood zone
- —
- Chance of flooding over 30 yrs
- —
- Est. flood insurance / yr
- —
Fire risk No data
- Est. fire insurance / yr
- —
Heat risk No data
- Hot days now (above threshold)
- —
- Hot days in 30 yrs
- —
Wind risk No data
- Chance of severe wind over 30 yrs
- —
Air-quality risk No data
- Unhealthy air days now
- —
- Unhealthy air days in 30 yrs
- —
Risk factors via First Street. Map © Google.
Why this score? — see what drove the D- grade
The composite is a weighted blend of 9 inputs, each scored 0–100. Each bar is that input's sub-score; the figure is the points it added to the 100-point composite (weight × sub-score).
- Appreciation +10.0/10.0
- ARV discount +7.5/15.0
- Cash flow +7.0/30.0
- Schools +4.1/10.0
- Livability +3.0/5.0
- Condition / age +2.5/5.0
- Rent growth +2.1/5.0
- 1% rule +1.9/10.0
- DSCR +1.2/10.0
$284,900
🖨 Deal sheet 📄 Offer letter ✓ Due diligence
Listing remarks MLS
Excellent opportunity with a corner lot in an area with new construction homes being built. Close to golf courses, shopping and restaurants as well as just a short drive to Fort Myers and Punta Gorda airports, two spring training facilities and beaches!
Key facts
- Open floor plan
- Large corner lot
- New construction
Tags
Property features AI
Finance
- Other: Corner lot; Lot acreage 0.25 acres; Lot dimensions approx. 100 x 140; Zoning RS-1; Well irrigation; View: Wooded area; Property type: Residential, Lehigh Acres development
- HOA & community: No HOA maintenance; Community amenities and type: see remarks
Exterior
- Parking: Attached 1-car garage; Detached 2-space carport
- Security: Smoke detector
- Utilities: Water with softener; Septic sewer
- Home design: Single family residence; 1 story (ranch); West rear exposure
- Construction: Concrete block construction; Stucco exterior; Shingle roof; Built in 2025
- Exterior features: Patio; Room for pool; Automatic sprinkler system; Impact resistant windows and doors
Interior
- Kitchen: Dishwasher; Microwave; Range; Refrigerator/Icemaker; Self-cleaning oven
- Bedrooms: 3 bedrooms
- Flooring: Tile
- Bathrooms: 2 full bathrooms; Master bathroom with shower only
- Heating & cooling: Central electric heat; Central electric cooling
- Interior features: Walk-in closet; Breakfast bar; Open porch/lanai; Split bedroom floor plan; Unfurnished
- Laundry & utility: Washer/dryer hookup
Neighborhood map
What this means for you Summary
Snapshot
- This is a 3-bed/2.0-bath land listed at $285k.
Deal economics
- At list price, monthly cash flow is $-415 ($-5k/yr) — negative.
- To cash-flow at today's rent, offer at most $225k (21.1% below list).
- To meet the 1% rule (rent ≥ 1% of price), the offer needs to be $197k (31.0% below list).
- Recommended offer: $197k (31.0% below list) — sets the bar for 1% rule.
Location & tenants
- Location reads 59/100 on livability (#826 in FL) — a working-class tenant base; expect higher turnover. Strengths: cost of living A+, housing A+; Watch: crime C-, employment D+, schools D-.
- Lee (suburban): math 47% / reading 50% proficiency, ranked #42 of 73 in FL (top 58%) — families likely to look elsewhere, expect single-tenant / working-renter base with shorter leases.
- Market conditions: Rents soft (-1.5%/yr); 786 active listings in the ZIP; 33 comparable units currently listed for rent nearby; rentals at typical pace (median 20d on market — plan ~3-4 weeks tenant-placement turnaround); 15,411 units permitted in Lee County in 2024 (4,686 in 5+ unit buildings).
- This rent runs 32% of the median local income ($73k/yr) — at the standard rent-burdened threshold; future hikes will face affordability resistance.
Forward outlook
- In year one you build about $30k of equity ($2k loan paydown + $28k appreciation (10.0% local appreciation)).
- Lee County population projected at +44% by 2050 — long-run rental-demand tailwind backs the buy-and-hold thesis.
- By year 2, paydown + projected appreciation supports a ~$49k cash-out refi (75% LTV) — recoverable capital for the next deal without selling this one.
Negotiation context
- It's been on market 89 days — a 6% lower offer ($268k) is reasonable based on typical stale-listing flexibility.
- 5 sale attempts since 2y ago with the ask held roughly flat each time — persistent listings suggest the price (not the market) is what's stuck; bring a comps-based counter.
- Current owner paid $28k; list at $285k implies a 929% gain — meaningful room to come down on a strong offer.
Questions for the listing agent
- What do current leases actually rent for vs. the listed asking? Can we see a recent rent roll and the last 12 months of T-12 income?
- It's been on market 89 days. Have you received any prior offers? Is the seller open to a 31% concession, seller financing, or rate buy-down credit?
- Why hasn't it sold? Are there any deal-killer items the seller is aware of (foundation, flood, title, zoning, code violations)?
- Is there a deadline driving the sale (1031 exchange, divorce, estate, relocation)? That informs how much negotiation room exists.
- Schools are D-rated, which usually means shorter tenancies and higher turnover. Who's the typical renter profile here, and what's been the actual vacancy rate?
- The area grade is low — what's the realistic commute time and amenity access for the typical tenant pool here? Any planned neighborhood developments (good or bad) we should know about?
- What's the average days-on-market for RENTAL listings here right now (not sales)? A rising rental-DOM trend means longer vacancies and softer asking-rent achievability than the comps imply.
- What's the recent tenant-quality profile in this submarket — average credit score on applications, eviction rate, late-payment / NSF rate, and stable-employment percentage? A property-management company in the area should have these aggregated.
- How much new for-sale + rental construction is in the pipeline within 1–3 miles? Heavy new supply typically softens prices + rents 12–24 months out; constrained supply supports both.
Investment metrics
- 1% rule
- 0.69% ✗
- Cap rate
- 4.54%
- Cash-on-cash
- -6.25%
- DSCR
- 0.72
- GRM
- 12.1
CMA / ARV
No comps found within radius.
Projected returns pro-forma
10.0% appreciation · 0.0% rent growth · sell at horizon
- IRR
- 19.1%
- Equity multiple
- 2.54×
- Total profit
- $122,971
- Equity at exit
- $256,660
- IRR
- 17.1%
- Equity multiple
- 5.67×
- Total profit
- $372,678
- Equity at exit
- $553,498
Cash invested: $79,772 (down + closing). Projections, not guarantees.
Landlord ↔ Tenant lean methodology
- Overall (STATE)
- 87 Strongly Landlord-Friendly
- State Florida
- 87 Strongly Landlord-Friendly · R+3
- County
- — inherits STATE
- City
- — inherits STATE
ZIP-level market 33976
- Home prices YoY
- 6.8%
- Rents YoY
- -1.5%
- Active inventory
- 786
- Price-to-rent
- 12.1×
Monthly cashflow live
- Estimated rent
- $1,966 high interval (Pro) →
- Mortgage (P&I)
- −$1,494
- Tax est. 1.5%
- −$356 /mo · $4,274/yr
- Insurance
- −$119
- HOA
- −$0
- Vacancy / Maint / Mgmt
- −$413
- Net cashflow
- $-415
Break-even live
UW: 25.0% down · 7.5% · 30yr · 1.5% tax · 5.0% vac · 8.0% maint · 8.0% mgmt
Financing live
Cash to close
- Down payment
- $71,225
- Closing costs
- $8,547
- Reserves months
- —
- Total cash needed
- —
Loan-product check · same deal, 3 products live
Conventional
25% down · 7.5% · 30yr
- Down + closing
- —
- Monthly P&I
- —
- Monthly cashflow
- —
- DSCR
- —
- Eligible?
- —
Personal DTI + credit; lowest rate.
DSCR
20% down · 8.5% · 30yr
- Down + closing
- —
- Monthly P&I
- —
- Monthly cashflow
- —
- DSCR
- —
- Eligible?
- —
No personal income docs; deal must DSCR.
Hard money
10% down · 12.0% · 12mo
- Down + closing
- —
- Monthly P&I
- —
- Monthly cashflow
- —
- DSCR
- —
- Eligible?
- —
Short-term bridge; refi at stabilization.
Rent comps 33 comps
| Address | Beds | Baths | Sqft | Rent | $/sqft | DOM | Units | Dist |
|---|---|---|---|---|---|---|---|---|
| 2513 48th St SW Lehigh Acres, FL | 3.0 | 2.0 | 1423 | $1,750 | $1.23 | 16d | 1 | 0.21mi |
| 4701 Connie Ave S Lehigh Acres, FL | 3.0 | 2.0 | 1314 | $1,900 | $1.45 | 14d | 1 | 0.21mi |
| 2819 51st St SW Lehigh Acres, FL | 4.0 | 2.0 | 1472 | $2,250 | $1.53 | 23d | 1 | 0.36mi |
| 2908 51st St SW Lehigh Acres, FL | 3.0 | 2.0 | 1401 | $1,796 | $1.28 | 3d | 1 | 0.42mi |
| 2517 56th St SW Lehigh Acres, FL | 3.0 | 2.0 | 1104 | $1,499 | $1.36 | 3d | 1 | 0.52mi |
| 2916 42nd St SW Lehigh Acres, FL | 3.0 | 2.0 | 1399 | $1,960 | $1.40 | 3d | 1 | 0.63mi |
| 2916 42nd St SW Lehigh Acres, FL | 3.0 | 2.0 | 1399 | $1,930 | $1.38 | 2d | 1 | 0.63mi |
| 4702 Loraine Ave S Lehigh Acres, FL | 3.0 | 2.0 | 1354 | $2,000 | $1.48 | 14d | 1 | 0.64mi |
| 813 Alabama Rd S Lehigh Acres, FL | 3.0 | 2.0 | 1200 | $1,495 | $1.25 | 23d | 1 | 0.71mi |
| 577 Pierre Cir Lehigh Acres, FL | 3.0 | 2.0 | 1223 | $1,540 | $1.26 | 10d | 1 | 0.75mi |
| 507 Peerless Cir Lehigh Acres, FL | 3.0 | 2.0 | 1408 | $2,100 | $1.49 | 23d | 1 | 0.75mi |
| 507 Peerless Cir Lehigh Acres, FL | 3.0 | 2.0 | 1408 | $2,000 | $1.42 | 3d | 1 | 0.75mi |
| 3012 40th St SW Lehigh Acres, FL | 3.0 | 2.0 | 1427 | $1,950 | $1.37 | 23d | 1 | 0.82mi |
| 3001 37th St SW Lehigh Acres, FL | 3.0 | 2.5 | 1235 | $1,705 | $1.38 | 23d | 1 | 0.82mi |
| 749 Alabama Rd S Unit 749 Lehigh Acres, FL | 3.0 | 2.0 | 1275 | $1,800 | $1.41 | 2d | 1 | 0.94mi |
| 177 Pennfield St Lehigh Acres, FL | 3.0 | 2.0 | 1250 | $1,850 | $1.48 | 23d | 1 | 0.95mi |
| 3102 39th St SW Lehigh Acres, FL | 3.0 | 2.0 | 1097 | $1,630 | $1.49 | 21d | 1 | 0.95mi |
| 3114 39th St SW Lehigh Acres, FL | 3.0 | 2.0 | 1493 | $2,100 | $1.41 | 3d | 1 | 1.03mi |
| 3114 39th St SW Lehigh Acres, FL | 3.0 | 2.0 | 1493 | $2,100 | $1.41 | 16d | 1 | 1.03mi |
| 2612 31st St Lehigh Acres, FL | 4.0 | 2.0 | 1389 | $1,799 | $1.30 | 16d | 1 | 1.15mi |
| 2612 31st St Lehigh Acres, FL | 4.0 | 2.0 | 1365 | $1,799 | $1.32 | 14d | 1 | 1.15mi |
| 664 Alabama Rd S Lehigh Acres, FL | 3.0 | 2.0 | 1181 | $1,200 | $1.02 | 23d | 1 | 1.23mi |
| 662 Alabama Rd S Lehigh Acres, FL | 3.0 | 2.0 | 1181 | $1,200 | $1.02 | 23d | 1 | 1.23mi |
| 234 Pullman St Lehigh Acres, FL | 3.0 | 2.0 | 1392 | $1,800 | $1.29 | 23d | 1 | 1.27mi |
| 98 Milwaukee Blvd Lehigh Acres, FL | 2.0 | 2.0 | 1221 | $1,325 | $1.09 | 23d | 1 | 1.33mi |
| 98 Milwaukee Blvd Lehigh Acres, FL | 2.0 | 2.0 | 1221 | $1,325 | $1.09 | 3d | 1 | 1.33mi |
| 137 Milwaukee Blvd Lehigh Acres, FL | 3.0 | 2.0 | 1170 | $1,600 | $1.37 | 23d | 1 | 1.36mi |
| 115 Milwaukee Blvd Lehigh Acres, FL | 3.0 | 2.0 | 1209 | $1,600 | $1.32 | 23d | 1 | 1.36mi |
| 430 Petite Ave Lehigh Acres, FL | 3.0 | 2.0 | 1189 | $1,850 | $1.56 | 14d | 1 | 1.40mi |
| 19542 Fairhill Ct Lehigh Acres, FL | 3.0 | 2.0 | 1429 | $1,700 | $1.19 | 23d | 1 | 1.42mi |
| 320 Poplar St Lehigh Acres, FL | 3.0 | 2.0 | 1223 | $1,900 | $1.55 | 19d | 1 | 1.47mi |
| 322 Poplar St Lehigh Acres, FL | 3.0 | 2.0 | 1199 | $2,000 | $1.67 | 23d | 1 | 1.48mi |
| 2811 25th St SW Unit NA Lehigh Acres, FL | 3.0 | 2.0 | 1430 | $1,990 | $1.39 | 23d | 1 | 1.50mi |
Listing history 23 events
-
2026-06-17days on market $284,900 Active 89 DOM
-
2026-06-16days on market $284,900 Active 88 DOM
-
2026-06-15days on market $284,900 Active 87 DOM
-
2026-06-13days on market $284,900 Active 85 DOM
-
2026-06-10days on market $284,900 Active 82 DOM
-
2026-06-09days on market $284,900 Active 81 DOM
-
2026-06-07days on market $284,900 Active 79 DOM
-
2026-06-03days on market $284,900 Active 75 DOM
-
2026-06-02days on market $284,900 Active 74 DOM
-
2026-06-01days on market $284,900 Active 73 DOM
-
2026-06-01days on market $284,900 Active 72 DOM
-
2026-05-12historical $1,800
-
2026-04-01price $1,800
-
2026-03-20$284,900 Active
-
2026-03-11$2,000
-
2026-03-10historical $2,000
-
2026-02-24historical
-
2026-02-06$2,000
-
2025-12-29$289,900 Active
-
2024-09-11soldstatus $27,700
-
2024-08-30soldstatus $27,650 Closed 253-char remark
Show marketing remark (253 chars)
Excellent opportunity with a corner lot in an area with new construction homes being built. Close to golf courses, shopping and restaurants as well as just a short drive to Fort Myers and Punta Gorda airports, two spring training facilities and beaches!
-
2024-08-03status Pending 253-char remark
Show marketing remark (253 chars)
Excellent opportunity with a corner lot in an area with new construction homes being built. Close to golf courses, shopping and restaurants as well as just a short drive to Fort Myers and Punta Gorda airports, two spring training facilities and beaches!
-
2024-07-26$29,900 Active 253-char remark
Show marketing remark (253 chars)
Excellent opportunity with a corner lot in an area with new construction homes being built. Close to golf courses, shopping and restaurants as well as just a short drive to Fort Myers and Punta Gorda airports, two spring training facilities and beaches!
ⓘ Source: listings_history table (triggers on properties + properties_extension) + one-shot
backfill from property_details.listing_events for pre-trigger history.
Nearby sold comps map
Loading sold comps map…
Walkable amenities ~0.75 mi
Loading nearby amenities…
Taxation est. · year 1
- Rental income
- $23,596
- − Mortgage interest
- −$15,959
- − Property taxes
- −$4,274
- − Insurance
- −$1,424
- − Repairs & maintenance
- −$1,888
- − Management
- −$1,888
- − Depreciation
- −$8,288
- Taxable loss
- −$10,124
- Est. tax savings @ 24.0%
- +$2,430
- After-tax cash flow
- $-2,556/yr
For passive investors: Depreciation is non-cash, so a rental often shows a tax loss while cash-flowing — sheltering income. Rental losses are passive: they offset passive income freely, and up to $25,000/yr can offset ordinary (W-2) income if you actively participate and your MAGI is under $100k (phasing out to $0 by $150k); unused losses carry forward. On sale, claimed depreciation is recaptured at up to 25%, and gains may owe capital-gains tax (a 1031 exchange can defer both). Figures are a year-1 estimate at your 24.0% rate — not tax advice; consult a CPA.
Schools (NCES district)
- District
- Lee
- NCES district ID
- 1201080
- Math proficiency
- 47% ▼ -11.00%
- Reading proficiency
- 50% ▼ -4.00%
- Median HH income
- $49,518
- Composite
- 41.49/100
- National rank
- #3458
- State rank
- #42 of 73 in FL
Livability — Lehigh Acres
- Score
- 59/100
- State rank
- #826
- US rank
- #20055
Category grades
Schools grade is shown separately in the Schools card above.
Census & demographics
- Census place
- Lehigh Acres, FL
- County
- Lee County · 788,662 people
- City population
- 130,638
- Metro
- Cape Coral-Fort Myers, FL
- Population (ZIP)
- 20,277
- Household income
- $72,679
- Rent vs Own
- Severe rent burden
- 574.0
Population outlook (Lee County) Hauer SSP2
- Today (2025)
- 871,946 people
- By 2030
- 955,468 · +9.6%
- By 2040
- 1,113,587 · +27.7%
- By 2050
- 1,256,891 · +44.1%
- By 2075
- 1,560,270 · +78.9%
- By 2100
- 1,726,848 · +98.0%
Race, ethnicity, and origin ACS 2023
- Neighborhood character
- Diverse neighborhood (Simpson 0.65)
- Race & ethnicity
- Hispanic / Latino 50% Two or more races 30% White 24% Black 20% Asian 3%
- Hispanic origin (detail)
- Mexican 8% Puerto Rican 8% Cuban 18% Dominican 4%
- Common ancestry
- Hispanic 8% Slovak 1% Lithuanian 1%
- Foreign-born
- 35% · Canada, Jamaica, Vietnam
- Languages at home
- 46% English-only · Spanish 43% French/Haitian/Cajun 8% Vietnamese 1%
Political lean MEDSL · Lee
- 2024 margin
- Strong R (+28.4) · D 35.5% · R 63.9%
- 2008→2024 swing
- -18.0pp toward R · 2008: -10.4pp · 2024: -28.4pp
- All cycles
- 2024: R+28.4 2020: R+19.2 2016: R+20.4 2012: R+16.6 2008: R+10.4
Not yet ingested
- Civics
- —
Market trends
- HPI YoY
- ▲ 21.77%
- Current HPI
- 340.4255
- Rent YoY
- ▼ -1.54%
- Metro
- Cape Coral-Fort Myers, FL
- State GDP YoY
- ▲ 3.28%
- F500 in state
- 36
Industry mix (Fortune 500 HQ in FL)
| Industry | F500 HQs | Revenue |
|---|---|---|
| Industrial Technology | 2 | $29B |
|
||
| Insurance | 2 | $17B |
|
||
| Retail | 1 | $60B |
|
||
| Technology Distribution | 1 | $58B |
|
||
| Homebuilding | 1 | $35B |
|
||
| Technology Manufacturing | 1 | $35B |
|
||
Price history
-94.0% since first listed12 events — show timeline
- 2026-05-12 Rental Removed $1,800 RENTSPREE
- 2026-04-01 Price Changed $1,800 RENTSPREE
- 2026-03-20 Listed $284,900 NAPLESMLS
- 2026-03-11 Listed for Rent $2,000 RENTSPREE
- 2026-03-10 Rental Removed $2,000 FGCMLS
- 2026-02-24 Listing Removed — NAPLESMLS
- 2026-02-06 Listed for Rent $2,000 FGCMLS
- 2025-12-29 Listed $289,900 NAPLESMLS
- 2024-09-11 Sold (Public Records) $27,700 Public Records
- 2024-08-30 Sold (MLS) $27,650 FORTMLS
- 2024-08-03 Pending — FORTMLS
- 2024-07-26 Listed $29,900 FORTMLS
Property tax history
+19.8%/yrLatest (2025): $520 · +32.4% YoY. Source: county tax records.
Cash-flow waterfall
monthlySold comps — $/sqft
last 12 mo · ≤1 miLoading sold comps…