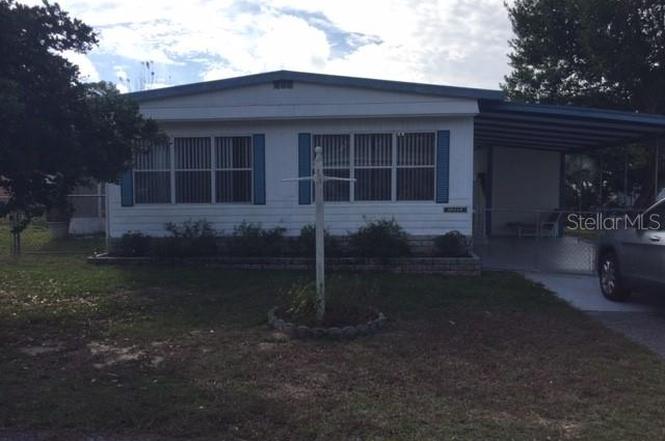
29218 Heckleman St · Hill 'n Dale, FL
Flood risk 1/10 · Minimal
- FEMA flood zone
- X (unshaded)
- Chance of flooding over 30 yrs
- 0.0%
- Est. flood insurance / yr
- $507 – $1,088
Fire risk 6/10 · Moderate
- Est. fire insurance / yr
- $947 – $1,759
Heat risk 9/10 · Severe
- Hot days now (above 108°F)
- 7 days/yr
- Hot days in 30 yrs
- 23 days/yr
Wind risk 9/10 · Severe
- Chance of severe wind over 30 yrs
- 99.0%
Air-quality risk 1/10 · Minimal
- Unhealthy air days now
- 0 days/yr
- Unhealthy air days in 30 yrs
- 0 days/yr
Risk factors via First Street. Map © Google.
Why this score? — see what drove the B- grade
The composite is a weighted blend of 9 inputs, each scored 0–100. Each bar is that input's sub-score; the figure is the points it added to the 100-point composite (weight × sub-score).
- Cash flow +30.0/30.0
- DSCR +10.0/10.0
- 1% rule +8.5/10.0
- ARV discount +8.1/15.0
- Schools +4.2/10.0
- Rent growth +2.5/5.0
- Livability +2.5/5.0
- Condition / age +2.5/5.0
- Appreciation +0.0/10.0
$135,000
🖨 Deal sheet 📄 Offer letter ✓ Due diligence
Listing remarks MLS
SEE THIS ONE!!! The yard is completely fenced with a back portion that has a vinyl privacy fence enclosure flowing to the screened in Florida room.
Key facts
- New floors
- French door entry
- Updated bathrooms
Tags
Property features AI
Finance
- Other: Partially furnished; Homestead exemption applied; Total living area listed as 1,104 (public records); Building area listed as 1,956 (public records)
- HOA & community: No HOA/association; Community street lights
Exterior
- Parking: Covered parking; Driveway; Off-street parking; 2-car carport
- Utilities: Public water; Public sewer; Electricity available and connected; Cable available; Water and sewer available and connected
- Home design: Residential mobile home (double wide); One story; Faces north
- Construction: Metal frame with metal siding; Membrane and metal roof; Slab foundation; Built as a double-wide mobile home
- Exterior features: Storage; Vinyl fencing; Paved public-maintained road access; Lot dimensions approximately 75 x 75
Interior
- Kitchen: Dishwasher; Microwave; Refrigerator; Freezer; Exhaust fan; Electric water heater
- Bedrooms: 2 bedrooms
- Flooring: Carpet; Laminate
- Bathrooms: 2 full bathrooms
- Heating & cooling: Heat pump; Central air; Humidity control; Wall/window unit(s)
- Interior features: Ceiling fans; Blinds and drapes
- Laundry & utility: Washer hookup; Dryer hookup (electric); Laundry room; Washer and dryer included (appliances listed)
Neighborhood map
What this means for you Summary
Snapshot
- This is a 3-bed/2.0-bath manufactured listed at $135k.
Deal economics
- At list price, monthly cash flow is $607 ($7k/yr) — positive.
- The deal already cash-flows at list — no discount required.
- Meets the 1% rule at list price ($2k rent vs $135k).
- Recommended offer: $119k (12.0% below list) — sets the bar for market timing.
- Cap rate 11.7% vs local median 5.4% in Hill 'n Dale — top-decile yield for the area; either an underpriced asset or a hidden risk that comps aren't pricing in. Stress-test before assuming the spread holds.
Location & tenants
- Location reads: area grade B — affects rentability + tenant quality, not the cash-flow math above.
- Hernando (suburban): math 50% / reading 50% proficiency, ranked #38 of 73 in FL (top 52%) — acceptable for families but not a draw, mixed tenant base, ~2y average lease.
- Zoned schools: Eastside Elementary School (math 37% / reading 32%, grade F, #1,709 of 2,144 statewide, top 81%, 737 students, 73% FRL); Hernando High School (math 42% / reading 42%, grade F, #275 of 667 statewide, top 42%, 1,299 students, 58% FRL).
- Market conditions: 185 active listings in the ZIP; 2 comparable units currently listed for rent nearby; 2,505 units permitted in Hernando County in 2024 (318 in 5+ unit buildings).
Forward outlook
- Local home prices are declining (-3.0%/yr); year-one equity from $933 of loan paydown is wiped out by about $4k of value loss. Plan a longer hold.
- Hernando County population projected at +11% by 2050 — modest demand growth; plan on rents tracking national, not racing it.
- At projected returns (-3.0% appreciation + 3.0% rent growth), your $38k cash investment doubles in ~7 years — after that, you're playing with house money.
Negotiation context
- It's been on market 330 days — a 12% lower offer ($119k) is reasonable based on typical stale-listing flexibility.
- 7 sale attempts since 21y ago; this cycle's ask has dropped $10k (7%) from the opening price — seller is motivated, your offer sets the floor, not the list.
- Current owner paid $46k; list at $135k implies a 190% gain — meaningful room to come down on a strong offer.
Risks & watch-outs
- Climate carrying-cost: severe wind risk, 99% chance of damaging wind over 30y; major wildfire risk; extreme-heat days projected 7→23/yr by 2055 (HVAC capex compounding) — expect insurance premiums to compound above CPI over the hold.
Questions for the listing agent
- It's been on market 330 days. Have you received any prior offers? Is the seller open to a 12% concession, seller financing, or rate buy-down credit?
- Built in 1971 — when were the roof, HVAC, electrical panel, plumbing, and water heater last replaced?
- Why hasn't it sold? Are there any deal-killer items the seller is aware of (foundation, flood, title, zoning, code violations)?
- Is there a deadline driving the sale (1031 exchange, divorce, estate, relocation)? That informs how much negotiation room exists.
- What's the average days-on-market for RENTAL listings here right now (not sales)? A rising rental-DOM trend means longer vacancies and softer asking-rent achievability than the comps imply.
- What's the recent tenant-quality profile in this submarket — average credit score on applications, eviction rate, late-payment / NSF rate, and stable-employment percentage? A property-management company in the area should have these aggregated.
- How much new for-sale + rental construction is in the pipeline within 1–3 miles? Heavy new supply typically softens prices + rents 12–24 months out; constrained supply supports both.
Investment metrics
- 1% rule
- 1.35% ✓
- Cap rate
- 11.69%
- Cash-on-cash
- 19.28%
- DSCR
- 1.86
- GRM
- 6.2
CMA / ARV
- ARV (on-the-fly)
- $136,896
- Comps found
- 1
Show comp detail 1 sale within ~0.75 mi
| Address | Dist | Beds/Ba | Sqft | Sold | Price | $/sf | Match |
|---|---|---|---|---|---|---|---|
| 29226 Heckleman St | 0.01mi | 3/2.0 | 1,248 (+13%) | 12mo | $155,000 | $124 | 68 |
Match score weights: distance 35% · size 25% · config 20% · recency 20%. Top-matched comps best support the ARV.
Projected returns pro-forma
-3.0% appreciation · 3.0% rent growth · sell at horizon
- IRR
- 11.2%
- Equity multiple
- 1.44×
- Total profit
- $16,768
- Equity at exit
- $20,129
- IRR
- 20.2%
- Equity multiple
- 2.70×
- Total profit
- $64,269
- Equity at exit
- $11,672
Cash invested: $37,800 (down + closing). Projections, not guarantees.
Landlord ↔ Tenant lean methodology
- Overall (STATE)
- 87 Strongly Landlord-Friendly
- State Florida
- 87 Strongly Landlord-Friendly · R+3
- County
- — inherits STATE
- City
- — inherits STATE
ZIP-level market 34602
- Home prices YoY
- -21.1%
- Active inventory
- 185
- Price-to-rent
- 6.2×
Monthly cashflow live
- Estimated rent
- $1,824 medium interval (Pro) →
- Mortgage (P&I)
- −$708
- Tax from tax record
- −$69 /mo · $830/yr
- Insurance
- −$56
- HOA
- −$0
- Vacancy / Maint / Mgmt
- −$383
- Net cashflow
- $607
Break-even live
UW: 25.0% down · 7.5% · 30yr · 1.5% tax · 5.0% vac · 8.0% maint · 8.0% mgmt
Financing live
Cash to close
- Down payment
- $33,750
- Closing costs
- $4,050
- Reserves months
- —
- Total cash needed
- —
Loan-product check · same deal, 3 products live
Conventional
25% down · 7.5% · 30yr
- Down + closing
- —
- Monthly P&I
- —
- Monthly cashflow
- —
- DSCR
- —
- Eligible?
- —
Personal DTI + credit; lowest rate.
DSCR
20% down · 8.5% · 30yr
- Down + closing
- —
- Monthly P&I
- —
- Monthly cashflow
- —
- DSCR
- —
- Eligible?
- —
No personal income docs; deal must DSCR.
Hard money
10% down · 12.0% · 12mo
- Down + closing
- —
- Monthly P&I
- —
- Monthly cashflow
- —
- DSCR
- —
- Eligible?
- —
Short-term bridge; refi at stabilization.
Rent comps 2 comps
| Address | Beds | Baths | Sqft | Rent | $/sqft | DOM | Units | Dist |
|---|---|---|---|---|---|---|---|---|
| 29238 Heckleman St Brooksville, FL | 3.0 | 2.0 | 1488 | $1,790 | $1.20 | 24d | 1 | 0.05mi |
| 5194 Sailor Rd Brooksville, FL | 3.0 | 2.0 | 1459 | $2,200 | $1.51 | 24d | 1 | 1.14mi |
Listing history 31 events
-
2026-06-18days on market $135,000 Active 330 DOM
-
2026-06-17days on market $135,000 Active 329 DOM
-
2026-06-16days on market $135,000 Active 328 DOM
-
2026-06-15days on market $135,000 Active 327 DOM
-
2026-06-13days on market $135,000 Active 325 DOM
-
2026-06-13days on market $135,000 Active 324 DOM
-
2026-06-09days on market $135,000 Active 321 DOM
-
2026-06-08days on market $135,000 Active 320 DOM
-
2026-06-07days on market $135,000 Active 319 DOM
-
2026-06-04days on market $135,000 Active 316 DOM
-
2026-06-03days on market $135,000 Active 315 DOM
-
2026-06-02days on market $135,000 Active 314 DOM
-
2026-06-01days on market $135,000 Active 313 DOM
-
2026-05-31days on market $135,000 Active 312 DOM
-
2026-01-06price $135,000
-
2025-08-04price $140,000
-
2025-07-23$145,000 Active
-
2019-04-26soldstatus $46,500 148-char remark
Show marketing remark (146 chars)
SEE THIS ONE!!!The yard is completely fenced with a back portion that has a vinyl privacy fence enclosure flowing to the screened in Florida room.
-
2019-04-26soldstatus $46,500 146-char remark
Show marketing remark (146 chars)
SEE THIS ONE!!!The yard is completely fenced with a back portion that has a vinyl privacy fence enclosure flowing to the screened in Florida room.
-
2019-04-26soldstatus $46,500
Show marketing remark (146 chars)
SEE THIS ONE!!!The yard is completely fenced with a back portion that has a vinyl privacy fence enclosure flowing to the screened in Florida room.
-
2019-01-04$52,500 148-char remark
Show marketing remark (146 chars)
SEE THIS ONE!!!The yard is completely fenced with a back portion that has a vinyl privacy fence enclosure flowing to the screened in Florida room.
-
2019-01-04$52,500 146-char remark
Show marketing remark (146 chars)
SEE THIS ONE!!!The yard is completely fenced with a back portion that has a vinyl privacy fence enclosure flowing to the screened in Florida room.
-
2007-04-11soldstatus $49,000
-
2007-04-11soldstatus $49,000
-
2007-01-10$51,000
-
2007-01-10$51,000
-
2005-03-25soldstatus $42,500
-
2005-03-25soldstatus $42,500
-
2005-02-28$45,000
-
2005-02-28$45,000
-
1982-01-01soldstatus $20,000
ⓘ Source: listings_history table (triggers on properties + properties_extension) + one-shot
backfill from property_details.listing_events for pre-trigger history.
Tax reassessment forecast FL · Resets to sale price
- Current annual tax
- $830 · $69/mo
- Projected year-2 tax
- $1,120 · $93/mo
- Expected delta
- +$290/yr (+$24/mo · 34.9%)
ⓘ Screening estimate from a state-policy table — verify with the county assessor before closing.
Climate risk First Street
- Flood 1/10 Low FEMA zone X (unshaded) · 0% chance over 30 yrs
- Wildfire 6/10 Major
- Heat 9/10 Extreme 7 d/yr ≥108°F today · 23 d/yr by 30 yrs out
- Wind 9/10 Extreme 99% chance of damaging wind over 30 yrs
- Air quality 1/10 Low 0 unhealthy d/yr today · 0 by 30 yrs out
Nearby sold comps map
Loading sold comps map…
Walkable amenities ~0.75 mi
Loading nearby amenities…
Taxation est. · year 1
- Rental income
- $21,884
- − Mortgage interest
- −$7,562
- − Property taxes
- −$830
- − Insurance
- −$675
- − Repairs & maintenance
- −$1,751
- − Management
- −$1,751
- − Depreciation
- −$3,927
- Taxable income
- $5,388
- Est. tax owed @ 24.0%
- −$1,293
- After-tax cash flow
- $5,994/yr
For passive investors: Depreciation is non-cash, so a rental often shows a tax loss while cash-flowing — sheltering income. Rental losses are passive: they offset passive income freely, and up to $25,000/yr can offset ordinary (W-2) income if you actively participate and your MAGI is under $100k (phasing out to $0 by $150k); unused losses carry forward. On sale, claimed depreciation is recaptured at up to 25%, and gains may owe capital-gains tax (a 1031 exchange can defer both). Figures are a year-1 estimate at your 24.0% rate — not tax advice; consult a CPA.
Schools (NCES district)
- District
- Hernando
- NCES district ID
- 1200810
- Math proficiency
- 50% ▼ -8.00%
- Reading proficiency
- 50% ▼ -4.00%
- Median HH income
- $41,985
- Composite
- 42.03/100
- National rank
- #3329
- State rank
- #38 of 73 in FL
Livability — Hill 'n Dale
No livability data for this city. (Only ~50 U.S. cities are tracked.)
Census & demographics
- Population (ZIP)
- 10,391
Population outlook (Hernando County) Hauer SSP2
- Today (2025)
- 189,218 people
- By 2030
- 194,367 · +2.7%
- By 2040
- 203,398 · +7.5%
- By 2050
- 209,589 · +10.8%
- By 2075
- 218,452 · +15.4%
- By 2100
- 205,923 · +8.8%
Race, ethnicity, and origin ACS 2023
- Neighborhood character
- Predominantly White (71%)
- Race & ethnicity
- White 71% Hispanic / Latino 14% Black 11% Two or more races 7%
- Hispanic origin (detail)
- Mexican 5% Puerto Rican 4% Cuban 2%
- Common ancestry
- Romanian 3% Lithuanian 2% Slovak 1%
- Foreign-born
- 5% · Canada, Dominican Republic, China
- Languages at home
- 90% English-only · Spanish 8%
Political lean MEDSL · Hernando
- 2024 margin
- Solid R (+37.0) · D 31.1% · R 68.2%
- 2008→2024 swing
- -33.5pp toward R · 2008: -3.6pp · 2024: -37.0pp
- All cycles
- 2024: R+37.0 2020: R+30.2 2016: R+29.0 2012: R+8.5 2008: R+3.6
Not yet ingested
- Civics
- —
Market trends
- HPI YoY
- ▼ -75.28%
- Current HPI
- 282.3728
- Rent YoY
- —
- Metro
- —
- State GDP YoY
- ▲ 3.28%
- F500 in state
- 36
Industry mix (Fortune 500 HQ in FL)
| Industry | F500 HQs | Revenue |
|---|---|---|
| Industrial Technology | 2 | $29B |
|
||
| Insurance | 2 | $17B |
|
||
| Retail | 1 | $60B |
|
||
| Technology Distribution | 1 | $58B |
|
||
| Homebuilding | 1 | $35B |
|
||
| Technology Manufacturing | 1 | $35B |
|
||
Price history
+575.0% since first listed17 events — show timeline
- 2026-01-06 Price Changed $135,000 Stellar MLS as Distributed by MLS Grid
- 2025-08-04 Price Changed $140,000 Stellar MLS as Distributed by MLS Grid
- 2025-07-23 Listed $145,000 Stellar MLS as Distributed by MLS Grid
- 2019-04-26 Sold (Public Records) $46,500 Public Records
- 2019-04-26 Sold (MLS) $46,500 St. Augustine and St. Johns County Board of REALTORS®
- 2019-04-26 Sold (MLS) $46,500 HCAR
- 2019-01-04 Listed $52,500 St. Augustine and St. Johns County Board of REALTORS®
- 2019-01-04 Listed $52,500 HCAR
- 2007-04-11 Sold (MLS) $49,000 HCAR
- 2007-04-11 Sold (MLS) $49,000 Stellar MLS as Distributed by MLS Grid
- 2007-01-10 Listed $51,000 HCAR
- 2007-01-10 Listed $51,000 Stellar MLS as Distributed by MLS Grid
- 2005-03-25 Sold (MLS) $42,500 Stellar MLS as Distributed by MLS Grid
- 2005-03-25 Sold (MLS) $42,500 HCAR
- 2005-02-28 Listed $45,000 Stellar MLS as Distributed by MLS Grid
- 2005-02-28 Listed $45,000 HCAR
- 1982-01-01 Sold (Public Records) $20,000 Public Records
Property tax history
+1.5%/yrLatest (2025): $830 · +0.4% YoY. Source: county tax records.
Cash-flow waterfall
monthlySold comps — $/sqft
last 12 mo · ≤1 miLoading sold comps…