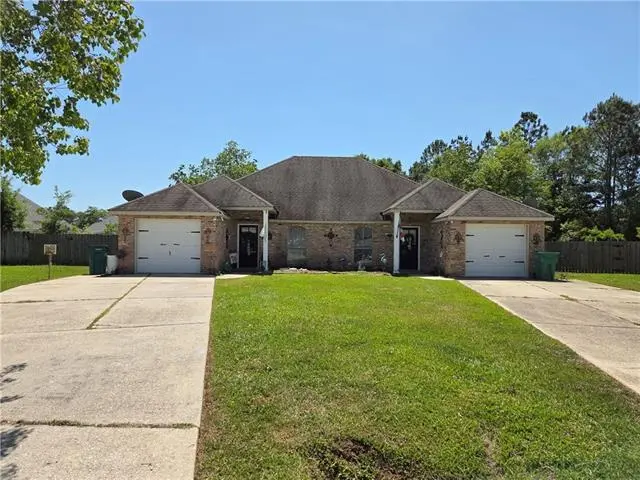
 Fourplex
197-203 Remmy Ct · Mandeville, LA
Flood risk 1/10 · Minimal
- FEMA flood zone
- X
- Chance of flooding over 30 yrs
- 0.0%
- Est. flood insurance / yr
- $507 – $1,088
Fire risk 4/10 · Minor
- Est. fire insurance / yr
- $1,269 – $2,357
Heat risk 10/10 · Severe
- Hot days now (above 108°F)
- 7 days/yr
- Hot days in 30 yrs
- 23 days/yr
Wind risk 9/10 · Severe
- Chance of severe wind over 30 yrs
- 99.0%
Air-quality risk 2/10 · Minimal
- Unhealthy air days now
- 1 days/yr
- Unhealthy air days in 30 yrs
- 2 days/yr
Risk factors via First Street. Map © Google.
Why this score? — see what drove the C+ grade
The composite is a weighted blend of 9 inputs, each scored 0–100. Each bar is that input's sub-score; the figure is the points it added to the 100-point composite (weight × sub-score).
- Cash flow +30.0/30.0
- DSCR +10.0/10.0
- 1% rule +9.4/10.0
- Schools +4.3/10.0
- Livability +3.9/5.0
- Rent growth +2.8/5.0
- Condition / age +2.8/5.0
- ARV discount +0.0/15.0
- Appreciation +0.0/10.0
$384,000
🖨 Deal sheet 📄 Offer letter ✓ Due diligence
Multi-family units
County records classify this as Multi-Family (2-4 Unit). Listing-text estimate: 4 units. confirmed
Listing remarks MLS
All-brick investment double currently rented to a long-time month-to-month tenant on both sides, rents are below market at $850/unit; PLEASE do not disturb tenants as there's no sign on the property, offers can be made subject to entry and inspections of the property, drive by only - no appointments will be made to see the interior until there's an accepted offer in place, all interior finishes are original from 2002 but could be updated as units become vacant to maximize rents; the garage fronts are for additional storage only and not true garages; units in this area rent quickly
Key facts
- 0.27 acre lot
- Parking
- Built 2002
Neighborhood map
What this means for you Summary
Snapshot
- This is a 4 × 2-bed/1-bath units multifamily listed at $384k. Condition is rated average.
Deal economics
- At list price, monthly cash flow is $2k ($21k/yr) — positive. Per door: $432/mo.
- The deal already cash-flows at list — no discount required.
- Meets the 1% rule at list price ($6k rent vs $384k).
- Recommended offer: $361k (6.0% below list) — sets the bar for market timing.
- Cap rate 11.7% vs local median 3.5% in Mandeville — top-decile yield for the area; either an underpriced asset or a hidden risk that comps aren't pricing in. Stress-test before assuming the spread holds.
Location & tenants
- Location reads 77/100 on livability (#13 in LA, #3,224 nationally) — a middle-class / working-renter tenant base. Strengths: schools A+, employment A+, housing A+; Watch: amenities F, commute F.
- St. Tammany Parish (suburban): math 43% / reading 55% proficiency, ranked #11 of 98 in LA (top 11%) — families likely to look elsewhere, expect single-tenant / working-renter base with shorter leases.
- Market conditions: Rents rising (+1.1%/yr); 260 active listings in the ZIP; solid renter incomes; 1,064 units permitted in St. Tammany Parish in 2024 (0 in 5+ unit buildings).
- At $5,545/mo this rent would consume 70% of the median local household income ($96k/yr) (locally 320% of renters already pay >50% of income on rent) — very limited rent-growth headroom before tenants either downsize or default.
Forward outlook
- Local home prices are declining (-3.0%/yr); year-one equity from $3k of loan paydown is wiped out by about $12k of value loss. Plan a longer hold.
- St. Tammany County population projected at +27% by 2050 — long-run rental-demand tailwind backs the buy-and-hold thesis.
- At projected returns (-3.0% appreciation + 1.1% rent growth), your $108k cash investment doubles in ~8 years — after that, you're playing with house money.
Negotiation context
- It's been on market 66 days — a 6% lower offer ($361k) is reasonable based on typical stale-listing flexibility.
- 2 sale attempts with the ask held roughly flat each time — persistent listings suggest the price (not the market) is what's stuck; bring a comps-based counter.
Risks & watch-outs
- Climate carrying-cost: severe wind risk, 99% chance of damaging wind over 30y; extreme-heat days projected 7→23/yr by 2055 (HVAC capex compounding) — expect insurance premiums to compound above CPI over the hold.
Questions for the listing agent
- It's been on market 66 days. Have you received any prior offers? Is the seller open to a 6% concession, seller financing, or rate buy-down credit?
- Can we see the unit-by-unit rent roll, current vacancy, and any below-market leases? What's the average tenancy length?
- What capital expenditures (roof, boiler, parking lot, exteriors) have been made in the last 5 years, and what's planned in the next 2?
- Why hasn't it sold? Are there any deal-killer items the seller is aware of (foundation, flood, title, zoning, code violations)?
- Is there a deadline driving the sale (1031 exchange, divorce, estate, relocation)? That informs how much negotiation room exists.
- Schools are A-rated — typically a magnet for longer-tenancy family renters. What's the average tenant stay here, and is there a school-zone premium baked into asking?
- What's the average days-on-market for RENTAL listings here right now (not sales)? A rising rental-DOM trend means longer vacancies and softer asking-rent achievability than the comps imply.
- What's the recent tenant-quality profile in this submarket — average credit score on applications, eviction rate, late-payment / NSF rate, and stable-employment percentage? A property-management company in the area should have these aggregated.
- How much new apartment / multifamily construction is in the pipeline within 1–3 miles? Heavy new supply (>2% of stock underway) typically softens rents 12–24 months out; light construction supports rent growth.
Investment metrics
- 1% rule
- 1.44% ✓
- Cap rate
- 11.69%
- Cash-on-cash
- 19.27%
- DSCR
- 1.86
- GRM
- 5.8
CMA / ARV
- ARV (median comp)
- $301,159
- List price
- $384,000
- Delta
- 27.51%
- Verdict
- OVERPRICED
- Comps
- 19 within 2.0 mi
Projected returns pro-forma
-3.0% appreciation · 1.06% rent growth · sell at horizon
- IRR
- 9.0%
- Equity multiple
- 1.35×
- Total profit
- $37,222
- Equity at exit
- $57,256
- IRR
- 16.5%
- Equity multiple
- 2.23×
- Total profit
- $132,463
- Equity at exit
- $33,201
Cash invested: $107,520 (down + closing). Projections, not guarantees.
Landlord ↔ Tenant lean methodology
- Overall (STATE)
- 90 Strongly Landlord-Friendly
- State Louisiana
- 90 Strongly Landlord-Friendly · R+12
- County
- — inherits STATE
- City
- — inherits STATE
ZIP-level market 70448
- Rents YoY
- 1.1%
- Active inventory
- 260
- Price-to-rent
- 23.1×
Monthly cashflow live
- Estimated rent
- $5,545 medium interval (Pro) →
- Mortgage (P&I)
- −$2,014
- Tax est. 1.5%
- −$480 /mo · $5,760/yr
- Insurance
- −$160
- HOA
- −$0
- Vacancy / Maint / Mgmt
- −$1,164
- Net cashflow
- $1,727
Break-even live
4-unit breakdown (identical units grouped — click to expand)
| Units | Beds | Baths | Est. rent |
|---|---|---|---|
| 4× units | 2 | 1 | $5,544 |
| #1 | 2 | 1 | $1,386 |
| #2 | 2 | 1 | $1,386 |
| #3 | 2 | 1 | $1,386 |
| #4 | 2 | 1 | $1,386 |
| Total (4 units) | $5,545 | ||
UW: 25.0% down · 7.5% · 30yr · 1.5% tax · 5.0% vac · 8.0% maint · 8.0% mgmt
Financing live
Cash to close
- Down payment
- $96,000
- Closing costs
- $11,520
- Reserves months
- —
- Total cash needed
- —
Loan-product check · same deal, 3 products live
Conventional
25% down · 7.5% · 30yr
- Down + closing
- —
- Monthly P&I
- —
- Monthly cashflow
- —
- DSCR
- —
- Eligible?
- —
Personal DTI + credit; lowest rate.
DSCR
20% down · 8.5% · 30yr
- Down + closing
- —
- Monthly P&I
- —
- Monthly cashflow
- —
- DSCR
- —
- Eligible?
- —
No personal income docs; deal must DSCR.
Hard money
10% down · 12.0% · 12mo
- Down + closing
- —
- Monthly P&I
- —
- Monthly cashflow
- —
- DSCR
- —
- Eligible?
- —
Short-term bridge; refi at stabilization.
Listing history 15 events
-
2026-06-18days on market $384,000 Active 66 DOM
-
2026-06-17days on market $384,000 Active 65 DOM
-
2026-06-16days on market $384,000 Active 64 DOM
-
2026-06-15days on market $384,000 Active 63 DOM
-
2026-06-13days on market $384,000 Active 61 DOM
-
2026-06-10days on market $384,000 Active 58 DOM
-
2026-06-09days on market $384,000 Active 57 DOM
-
2026-06-08days on market $384,000 Active 56 DOM
-
2026-06-07days on market $384,000 Active 55 DOM
-
2026-06-03days on market $384,000 Active 51 DOM
-
2026-06-02days on market $384,000 Active 50 DOM
-
2026-06-01days on market $384,000 Active 49 DOM
-
2026-05-31days on market $384,000 Active 48 DOM
-
2026-04-13$384,000 Active 587-char remark
Show marketing remark (587 chars)
All-brick investment double currently rented to a long-time month-to-month tenant on both sides, rents are below market at $850/unit; PLEASE do not disturb tenants as there's no sign on the property, offers can be made subject to entry and inspections of the property, drive by only - no appointments will be made to see the interior until there's an accepted offer in place, all interior finishes are original from 2002 but could be updated as units become vacant to maximize rents; the garage fronts are for additional storage only and not true garages; units in this area rent quickly
ⓘ Source: listings_history table (triggers on properties + properties_extension) + one-shot
backfill from property_details.listing_events for pre-trigger history.
Climate risk First Street
- Flood 1/10 Low FEMA zone X · 0% chance over 30 yrs
- Wildfire 4/10 Moderate
- Heat 10/10 Extreme 7 d/yr ≥108°F today · 23 d/yr by 30 yrs out
- Wind 9/10 Extreme 99% chance of damaging wind over 30 yrs
- Air quality 2/10 Low 1 unhealthy d/yr today · 2 by 30 yrs out
Nearby sold comps map
Loading sold comps map…
Walkable amenities ~0.75 mi
Loading nearby amenities…
Taxation est. · year 1
- Rental income
- $66,540
- − Mortgage interest
- −$21,510
- − Property taxes
- −$5,760
- − Insurance
- −$1,920
- − Repairs & maintenance
- −$5,323
- − Management
- −$5,323
- − Depreciation
- −$11,171
- Taxable income
- $15,533
- Est. tax owed @ 24.0%
- −$3,728
- After-tax cash flow
- $16,994/yr
For passive investors: Depreciation is non-cash, so a rental often shows a tax loss while cash-flowing — sheltering income. Rental losses are passive: they offset passive income freely, and up to $25,000/yr can offset ordinary (W-2) income if you actively participate and your MAGI is under $100k (phasing out to $0 by $150k); unused losses carry forward. On sale, claimed depreciation is recaptured at up to 25%, and gains may owe capital-gains tax (a 1031 exchange can defer both). Figures are a year-1 estimate at your 24.0% rate — not tax advice; consult a CPA.
Condition & rehab AI · 10 photos
The property is in average condition with original finishes from 2002. Moderate updates are needed to bring it up to current standards, focusing on paint, kitchen appliances, and bathroom fixtures.
Repairs flagged
- Minor kitchen cabinets — original cabinets from 2002
- Minor bathroom fixtures — original fixtures from 2002
- Minor paint — original paint from 2002
Value-add opportunities
- Both paint — Fresh paint can enhance curb appeal and interior aesthetics
- Rental kitchen appliances — Upgrading to modern appliances can attract higher rent
- Both bathroom fixtures — Modern fixtures can improve both resale and rental value
Renovation cost estimate screening
| Repair item | Severity | Est. cost |
|---|---|---|
| kitchen cabinets · original cabinets from 2002 | Minor | $500–3,000 |
| bathroom fixtures · original fixtures from 2002 | Minor | $500–3,000 |
| paint · original paint from 2002 | Minor | $500–3,000 |
| Total estimated repair cost · 3 items | $1,500–9,000 |
Value-add ROI direction
- Both paint — Fresh paint can enhance curb appeal and interior aesthetics ↑
- Rental kitchen appliances — Upgrading to modern appliances can attract higher rent ↑
- Both bathroom fixtures — Modern fixtures can improve both resale and rental value ↑
ⓘ Cost ranges are severity-bucket heuristics (US national rule-of-thumb). Get contractor quotes + a written scope before underwriting a rehab budget.
Schools (NCES district)
- District
- St. Tammany Parish
- NCES district ID
- 2201650
- Math proficiency
- 43% ▼ -32.00%
- Reading proficiency
- 55% ▼ -26.00%
- Median HH income
- $61,752
- Composite
- 43.04/100
- National rank
- #3098
- State rank
- #11 of 98 in LA
Livability — Mandeville
- Score
- 77/100
- State rank
- #13
- US rank
- #3224
Category grades
Schools grade is shown separately in the Schools card above.
Census & demographics
- County
- Saint Tammany Parish · 228,296 people
- City population
- 50,537
- Metro
- New Orleans-Metairie, LA
- Population (ZIP)
- 26,338
- Household income
- $95,682
- Rent vs Own
- Severe rent burden
- 320.0
Population outlook (St. Tammany County) Hauer SSP2
- Today (2025)
- 286,725 people
- By 2030
- 304,175 · +6.1%
- By 2040
- 336,203 · +17.3%
- By 2050
- 364,590 · +27.2%
- By 2075
- 433,362 · +51.1%
- By 2100
- 470,333 · +64.0%
Race, ethnicity, and origin ACS 2023
- Neighborhood character
- Predominantly White (82%)
- Race & ethnicity
- White 82% Two or more races 10% Hispanic / Latino 9% Black 5% Asian 1%
- Hispanic origin (detail)
- Mexican 3%
- Common ancestry
- Lithuanian 16% Italian 2% Slovak 2%
- Foreign-born
- 5% · Canada, Vietnam, Jamaica
- Languages at home
- 92% English-only · Spanish 4% Russian/Polish/Slavic 1% German/W. Germanic 1%
Political lean MEDSL · St. Tammany
- 2024 margin
- Solid R (+43.8) · D 27.3% · R 71.1% · Other 1.6%
- 2008→2024 swing
- +9.6pp toward D · 2008: -53.4pp · 2024: -43.8pp
- All cycles
- 2024: R+43.8 2020: R+44.2 2016: R+50.8 2012: R+52.2 2008: R+53.4
Not yet ingested
- Civics
- —
Market trends
- HPI YoY
- ▼ -113.97%
- Current HPI
- 179.9084
- Rent YoY
- ▲ 1.06%
- Metro
- New Orleans-Metairie, LA
- State GDP YoY
- ▲ 3.29%
- F500 in state
- 10
Industry mix (Fortune 500 HQ in LA)
| Industry | F500 HQs | Revenue |
|---|---|---|
| Telecommunications | 2 | $23B |
|
||
| Utilities | 1 | $12B |
|
||
| Wholesale / Distribution | 1 | $5B |
|
||
| Advertising | 1 | $2B |
|
||
Price history
+0.0% since first listed2 events — show timeline
- 2026-04-13 Listed $384,000 AcadianaMLS
- 2026-04-13 Listed $384,000 GSREIN
Cash-flow waterfall
monthlySold comps — $/sqft
last 12 mo · ≤1 miLoading sold comps…