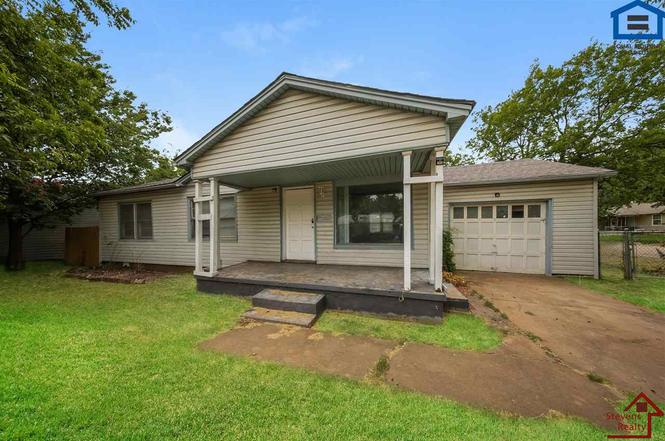
2208 NW 19th St · Lawton, OK
Flood risk 1/10 · Minimal
- FEMA flood zone
- X (unshaded)
- Chance of flooding over 30 yrs
- 0.0%
- Est. flood insurance / yr
- $507 – $1,088
Fire risk 6/10 · Moderate
- Est. fire insurance / yr
- $2,463 – $4,575
Heat risk 6/10 · Moderate
- Hot days now (above 108°F)
- 7 days/yr
- Hot days in 30 yrs
- 19 days/yr
Wind risk 2/10 · Minimal
- Chance of severe wind over 30 yrs
- 4.0%
Air-quality risk 1/10 · Minimal
- Unhealthy air days now
- 0 days/yr
- Unhealthy air days in 30 yrs
- 0 days/yr
Risk factors via First Street. Map © Google.
Why this score? — see what drove the B- grade
The composite is a weighted blend of 9 inputs, each scored 0–100. Each bar is that input's sub-score; the figure is the points it added to the 100-point composite (weight × sub-score).
- Cash flow +30.0/30.0
- 1% rule +10.0/10.0
- DSCR +10.0/10.0
- Rent growth +3.8/5.0
- ARV discount +3.6/15.0
- Livability +3.2/5.0
- Condition / age +2.5/5.0
- Schools +2.0/10.0
- Appreciation +0.0/10.0
$70,000
🖨 Deal sheet (PDF) 📄 Offer letter ✓ Due diligence
Listing remarks MLS
Sold when listed.
Key facts
- Fresh paint
- Lights
- New flooring
Tags
Property features AI
Exterior
- Parking: Detached or attached garage with 1 covered parking space (1 garage space total); Total of 1 parking space
- Security: Carbon monoxide detector(s); Smoke detector(s)
- Utilities: Public water; Public sewer; Natural gas available; Electric service
- Home design: Single-family residence; One story; Residential property; Updated/remodeled
- Construction: Composition roof; Crawl space foundation; Built (year not specified)
- Exterior features: Covered porch; Covered patio; Chain link fencing; Corner lot; Public maintained road frontage on a city street
Interior
- Kitchen: Cooktop; Dishwasher; Refrigerator; Range hood
- Flooring: Hardwood; Vinyl
- Bathrooms: 1 full bathroom
- Heating & cooling: Central heating (natural gas); Central air; Ceiling fan(s); Electric cooling
- Interior features: Cooktop; Dishwasher; Refrigerator; Range hood; Electric water heater; Updated/remodeled condition; Carbon monoxide and smoke detectors
- Laundry & utility: Washer hookup in garage; Laundry located in garage
Neighborhood map
What this means for you Summary
Snapshot
- This is a 3-bed/1.0-bath single-family listed at $70k.
Deal economics
- At list price, monthly cash flow is $535 ($6k/yr) — positive.
- The deal already cash-flows at list — no discount required.
- Meets the 1% rule at list price ($1k rent vs $70k).
- Recommended offer: $62k (12.0% below list) — sets the bar for market timing.
- Cap rate 15.5% vs local median 6.0% in Lawton — top-decile yield for the area; either an underpriced asset or a hidden risk that comps aren't pricing in. Stress-test before assuming the spread holds.
Location & tenants
- Location reads 63/100 on livability (#206 in OK) — a middle-class / working-renter tenant base. Strengths: cost of living A+, housing A+; Watch: employment D, crime F, commute F.
- Lawton (urban): math 20% / reading 26% proficiency, ranked #137 of 270 in OK (top 51%) — low school quality limits family demand, transient renter base, plan for 1-2y turnover.
- Zoned schools: Pat Henry Es (math 12% / reading 17%, grade F, #604 of 845 statewide, top 76%, 508 students, 0% FRL); Central Ms (math 17% / reading 24%, grade F, #153 of 345 statewide, top 45%, 994 students, 0% FRL); Lawton Hs (math 16% / reading 21%, grade F, #302 of 447 statewide, top 68%, 1,417 students, 0% FRL) — zoned schools average 0% FRL vs 54% district-wide (54 pts lower); this property's tenant base skews higher-income than the district average.
- Market conditions: Rents rising fast (+5.1%/yr); 404 active listings in the ZIP; 133 units permitted in Comanche County in 2024 (0 in 5+ unit buildings).
Forward outlook
- Local home prices are declining (-3.0%/yr); year-one equity from $484 of loan paydown is wiped out by about $2k of value loss. Plan a longer hold.
- Comanche County population projected to shrink 3% by 2050 — rents likely to lag national; underwrite the cash flow, not the appreciation.
- At projected returns (-3.0% appreciation + 5.1% rent growth), your $20k cash investment doubles in ~4 years — after that, you're playing with house money.
Negotiation context
- It's been on market 185 days — a 12% lower offer ($62k) is reasonable based on typical stale-listing flexibility.
- 5 sale attempts since 17y ago; this cycle's ask has dropped $5k (7%) from the opening price — seller is motivated, your offer sets the floor, not the list.
- Current owner paid $58k; 21% above their basis — modest negotiation headroom, anchor on the comps not their cost.
Risks & watch-outs
- Watch-outs: built in 1951 — expect roof / HVAC / electrical / plumbing capex.
- Climate carrying-cost: major wildfire risk; extreme-heat days projected 7→19/yr by 2055 (HVAC capex compounding) — expect insurance premiums to compound above CPI over the hold.
Questions for the listing agent
- It's been on market 185 days. Have you received any prior offers? Is the seller open to a 12% concession, seller financing, or rate buy-down credit?
- Built in 1951 — when were the roof, HVAC, electrical panel, plumbing, and water heater last replaced?
- Why hasn't it sold? Are there any deal-killer items the seller is aware of (foundation, flood, title, zoning, code violations)?
- Is there a deadline driving the sale (1031 exchange, divorce, estate, relocation)? That informs how much negotiation room exists.
- Schools are D-rated, which usually means shorter tenancies and higher turnover. Who's the typical renter profile here, and what's been the actual vacancy rate?
- Crime grade is F in this area — have there been break-ins, vandalism, or insurance claims at this property in the last 3 years? What carrier currently insures it and at what premium?
- What's the average days-on-market for RENTAL listings here right now (not sales)? A rising rental-DOM trend means longer vacancies and softer asking-rent achievability than the comps imply.
- What's the recent tenant-quality profile in this submarket — average credit score on applications, eviction rate, late-payment / NSF rate, and stable-employment percentage? A property-management company in the area should have these aggregated.
- How much new for-sale + rental construction is in the pipeline within 1–3 miles? Heavy new supply typically softens prices + rents 12–24 months out; constrained supply supports both.
Investment metrics
- 1% rule
- 1.78% ✓
- Cap rate
- 15.47%
- Cash-on-cash
- 32.78%
- DSCR
- 2.46
- GRM
- 4.7
CMA / ARV
- ARV (on-the-fly)
- $64,428
- Comps found
- 12
Show comp detail 12 sales within ~0.75 mi
| Address | Dist | Beds/Ba | Sqft | Sold | Price | $/sf | Match |
|---|---|---|---|---|---|---|---|
| 2523 NW 17th St | 0.34mi | 3/1.5 | 1,100 (+1%) | 3mo | $103,000 | $94 | 78 |
| 1317 NW Bessie Ave | 0.54mi | 3/1.0 | 1,100 (+1%) | 1mo | $30,000 | $27 | 73 |
| 1809 NW Kingsbury | 0.36mi | 2/1.0 (-1) | 1,146 (+5%) | 3mo | $35,000 | $31 | 67 |
| 2204 NW Williams Ave | 0.31mi | 3/2.0 | 1,200 (+10%) | 0mo | $80,000 | $67 | 65 |
| 1708 NW Floyd | 0.21mi | 3/2.0 | 1,200 (+10%) | 6mo | $45,000 | $38 | 64 |
| 2112 NW Bessie Ave | 0.29mi | 3/1.0 | 940 (-14%) | 0mo | $62,500 | $66 | 63 |
| 1704 NW Oak Ave | 0.69mi | 3/2.0 | 1,092 (0%) | 1mo | $141,500 | $130 | 63 |
| 1419 NW 23rd St | 0.57mi | 3/1.0 | 1,000 (-8%) | 4mo | $19,900 | $20 | 56 |
| 2136 NW Carroll Ave | 0.52mi | 3/1.5 | 1,200 (+10%) | 2mo | $114,000 | $95 | 55 |
| 2205 NW Lindy Ave | 0.54mi | 2/1.0 (-1) | 1,000 (-8%) | 5mo | $49,500 | $50 | 51 |
| 1216 NW Carroll Dr | 0.70mi | 3/2.0 | 1,200 (+10%) | 8mo | $71,000 | $59 | 41 |
| 1204 NW Taft | 0.70mi | 2/1.0 (-1) | 950 (-13%) | 5mo | $35,000 | $37 | 36 |
Match score weights: distance 35% · size 25% · config 20% · recency 20%. Top-matched comps best support the ARV.
Projected returns pro-forma
-3.0% appreciation · 5.14% rent growth · sell at horizon
- IRR
- 30.2%
- Equity multiple
- 2.30×
- Total profit
- $25,493
- Equity at exit
- $10,437
- IRR
- 38.6%
- Equity multiple
- 4.97×
- Total profit
- $77,825
- Equity at exit
- $6,052
Cash invested: $19,600 (down + closing). Projections, not guarantees.
Landlord ↔ Tenant lean methodology
- Overall (STATE)
- 83 Strongly Landlord-Friendly
- State Oklahoma
- 83 Strongly Landlord-Friendly · R+20
- County
- — inherits STATE
- City
- — inherits STATE
ZIP-level market 73505
- Rents YoY
- 5.1%
- Active inventory
- 404
- Price-to-rent
- 4.7×
Monthly cashflow live
- Estimated rent
- $1,244 medium interval (Pro) →
- Mortgage (P&I)
- −$367
- Tax from tax record
- −$51 /mo · $610/yr
- Insurance
- −$29
- HOA
- −$0
- Vacancy / Maint / Mgmt
- −$261
- Net cashflow
- $535
Break-even live
Sensitivity live
| Price | -10% $575 | -5% $555 | +0% $535 | +5% $516 | +10% $496 |
|---|---|---|---|---|---|
| Rent | -10% $437 | -5% $486 | +0% $535 | +5% $585 | +10% $634 |
| Rate | -1.0pp $571 | -0.5pp $553 | base $535 | +0.5pp $517 | +1.0pp $499 |
UW: 25.0% down · 7.5% · 30yr · 1.5% tax · 5.0% vac · 8.0% maint · 8.0% mgmt
Financing live
Cash to close
- Down payment
- $17,500
- Closing costs
- $2,100
- Reserves months
- —
- Total cash needed
- —
Loan-product check · same deal, 3 products live
Conventional
25% down · 7.5% · 30yr
- Down + closing
- —
- Monthly P&I
- —
- Monthly cashflow
- —
- DSCR
- —
- Eligible?
- —
Personal DTI + credit; lowest rate.
DSCR
20% down · 8.5% · 30yr
- Down + closing
- —
- Monthly P&I
- —
- Monthly cashflow
- —
- DSCR
- —
- Eligible?
- —
No personal income docs; deal must DSCR.
Hard money
10% down · 12.0% · 12mo
- Down + closing
- —
- Monthly P&I
- —
- Monthly cashflow
- —
- DSCR
- —
- Eligible?
- —
Short-term bridge; refi at stabilization.
Listing history 34 events
-
2026-06-21days on market $70,000 Active 185 DOM
-
2026-06-19days on market $70,000 Active 183 DOM
-
2026-06-18days on market $70,000 Active 182 DOM
-
2026-06-17days on market $70,000 Active 181 DOM
-
2026-06-16days on market $70,000 Active 180 DOM
-
2026-06-15days on market $70,000 Active 179 DOM
-
2026-06-14days on market $70,000 Active 177 DOM
-
2026-06-13days on market $70,000 Active 176 DOM
-
2026-06-10days on market $70,000 Active 174 DOM
-
2026-06-09days on market $70,000 Active 173 DOM
-
2026-06-08days on market $70,000 Active 172 DOM
-
2026-06-07days on market $70,000 Active 171 DOM
-
2026-06-05days on market $70,000 Active 168 DOM
-
2026-06-03days on market $70,000 Active 167 DOM
-
2026-06-02days on market $70,000 Active 166 DOM
-
2026-06-01days on market $70,000 Active 165 DOM
-
2026-05-31days on market $70,000 Active 164 DOM
-
2026-05-30days on market $70,000 Active 163 DOM
-
2026-03-26price $70,000
-
2025-11-25$75,000 Active
-
2025-08-14historical $825
-
2025-08-10price $825
-
2025-06-24price $849
-
2025-06-13$899
-
2023-06-23historical $850
-
2022-03-31price $850
-
2022-01-20soldstatus $58,000
-
2022-01-14soldstatus $58,000 17-char remark
Show marketing remark (17 chars)
Sold when listed.
-
2021-11-30$58,000 17-char remark
Show marketing remark (17 chars)
Sold when listed.
-
2012-10-05soldstatus $36,025 105-char remark
Show marketing remark (105 chars)
Comfortable 3 bedroom, 1 bath, ranch style home, attached 1 car garage all sitting on a large corner lot.
-
2012-05-31$36,000 105-char remark
Show marketing remark (105 chars)
Comfortable 3 bedroom, 1 bath, ranch style home, attached 1 car garage all sitting on a large corner lot.
-
2009-07-23soldstatus $65,000
-
2009-07-23soldstatus $65,000
-
2009-01-09$67,500
ⓘ Source: listings_history table (triggers on properties + properties_extension) + one-shot
backfill from property_details.listing_events for pre-trigger history.
Tax reassessment forecast OK · Resets to sale price
- Current annual tax
- $610 · $51/mo
- Projected year-2 tax
- $630 · $52/mo
- Expected delta
- +$20/yr (+$2/mo · 3.3%)
ⓘ Screening estimate from a state-policy table — verify with the county assessor before closing.
Climate risk First Street
- Flood 1/10 Low FEMA zone X (unshaded) · 0% chance over 30 yrs
- Wildfire 6/10 Major
- Heat 6/10 Major 7 d/yr ≥108°F today · 19 d/yr by 30 yrs out
- Wind 2/10 Low 4% chance of damaging wind over 30 yrs
- Air quality 1/10 Low 0 unhealthy d/yr today · 0 by 30 yrs out
Nearby sold comps map
Loading sold comps map…
Walkable amenities ~0.75 mi
Loading nearby amenities…
Taxation est. · year 1
- Rental income
- $14,925
- − Mortgage interest
- −$3,921
- − Property taxes
- −$610
- − Insurance
- −$350
- − Repairs & maintenance
- −$1,194
- − Management
- −$1,194
- − Depreciation
- −$2,036
- Taxable income
- $5,620
- Est. tax owed @ 24.0%
- −$1,349
- After-tax cash flow
- $5,077/yr
For passive investors: Depreciation is non-cash, so a rental often shows a tax loss while cash-flowing — sheltering income. Rental losses are passive: they offset passive income freely, and up to $25,000/yr can offset ordinary (W-2) income if you actively participate and your MAGI is under $100k (phasing out to $0 by $150k); unused losses carry forward. On sale, claimed depreciation is recaptured at up to 25%, and gains may owe capital-gains tax (a 1031 exchange can defer both). Figures are a year-1 estimate at your 24.0% rate — not tax advice; consult a CPA.
Schools (NCES district)
- District
- Lawton
- NCES district ID
- 4017250
- Math proficiency
- 20% ▼ -12.00%
- Reading proficiency
- 26% ▼ -9.00%
- Median HH income
- $42,618
- Composite
- 19.68/100
- National rank
- #8732
- State rank
- #137 of 270 in OK
Livability — Lawton
- Score
- 63/100
- State rank
- #206
- US rank
- #15131
Category grades
Schools grade is shown separately in the Schools card above.
Census & demographics
- Census place
- Lawton, OK
- County
- Comanche County · 96,361 people
- City population
- 89,233
- Metro
- Lawton, OK
- Population (ZIP)
- 47,790
- Household income
- $58,272
- Rent vs Own
- Severe rent burden
- 1986.0
Population outlook (Comanche County) Hauer SSP2
- Today (2025)
- 124,518 people
- By 2030
- 124,231 · -0.2%
- By 2040
- 122,193 · -1.9%
- By 2050
- 120,368 · -3.3%
- By 2075
- 120,492 · -3.2%
- By 2100
- 123,113 · -1.1%
Race, ethnicity, and origin ACS 2023
- Neighborhood character
- Diverse neighborhood (Simpson 0.70)
- Race & ethnicity
- White 50% Black 17% Two or more races 16% Hispanic / Latino 16% Native American 4% Asian 3%
- Hispanic origin (detail)
- Mexican 11% Puerto Rican 2%
- Common ancestry
- Lithuanian 2% Slovak 2% Romanian 1%
- Foreign-born
- 6% · Canada, South Korea
- Languages at home
- 88% English-only · Spanish 6% German/W. Germanic 2% Korean 1%
Political lean MEDSL · Comanche
- 2024 margin
- Strong R (+23.3) · D 37.4% · R 60.7% · Other 1.9%
- 2008→2024 swing
- -5.8pp toward R · 2008: -17.5pp · 2024: -23.3pp
- All cycles
- 2024: R+23.3 2020: R+20.1 2016: R+23.7 2012: R+17.0 2008: R+17.5
Not yet ingested
- Civics
- —
Market trends
- HPI YoY
- ▼ -134.88%
- Current HPI
- 169.4524
- Rent YoY
- ▲ 5.14%
- Metro
- Lawton, OK
- State GDP YoY
- ▲ 1.55%
- F500 in state
- 6
Industry mix (Fortune 500 HQ in OK)
| Industry | F500 HQs | Revenue |
|---|---|---|
| Energy | 3 | $48B |
|
||
Price history
+3.7% since first listed16 events — show timeline
- 2026-03-26 Price Changed $70,000 LBRMLS
- 2025-11-25 Listed $75,000 LBRMLS
- 2025-08-14 Rental Removed $825 SHOWMOJO
- 2025-08-10 Price Changed $825 SHOWMOJO
- 2025-06-24 Price Changed $849 SHOWMOJO
- 2025-06-13 Listed for Rent $899 SHOWMOJO
- 2023-06-23 Rental Removed $850 WALKSCORE
- 2022-03-31 Price Changed $850 RENT.
- 2022-01-20 Sold (Public Records) $58,000 Public Records
- 2022-01-14 Sold (MLS) $58,000 LBRMLS
- 2021-11-30 Listed $58,000 LBRMLS
- 2012-10-05 Sold (MLS) $36,025 LBRMLS
- 2012-05-31 Listed $36,000 LBRMLS
- 2009-07-23 Sold (Public Records) $65,000 Public Records
- 2009-07-23 Sold (MLS) $65,000 LBRMLS
- 2009-01-09 Listed $67,500 LBRMLS
Property tax history
-0.9%/yrLatest (2025): $610 · +0.3% YoY. Source: county tax records.
Cash-flow waterfall
monthlySold comps — $/sqft
last 12 mo · ≤1 miLoading sold comps…