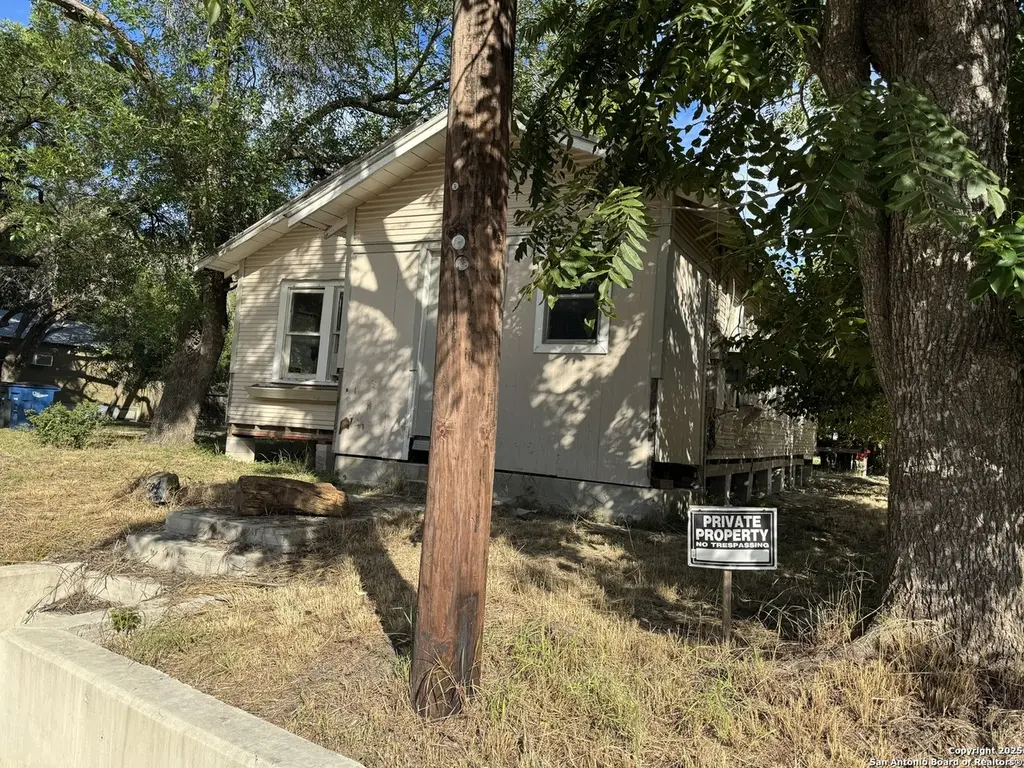
1604 Katy St · New Braunfels, TX
Flood risk 8/10 · Major
- FEMA flood zone
- X (shaded)
- Chance of flooding over 30 yrs
- 0.99%
- Est. flood insurance / yr
- $507 – $1,088
Fire risk 3/10 · Minor
- Est. fire insurance / yr
- $1,222 – $2,270
Heat risk 8/10 · Major
- Hot days now (above 108°F)
- 7 days/yr
- Hot days in 30 yrs
- 21 days/yr
Wind risk 8/10 · Major
- Chance of severe wind over 30 yrs
- 80.0%
Air-quality risk 1/10 · Minimal
- Unhealthy air days now
- 0 days/yr
- Unhealthy air days in 30 yrs
- 0 days/yr
Risk factors via First Street. Map © Google.
Why this score? — see what drove the D grade
The composite is a weighted blend of 9 inputs, each scored 0–100. Each bar is that input's sub-score; the figure is the points it added to the 100-point composite (weight × sub-score).
- ARV discount +15.0/15.0
- Cash flow +9.7/30.0
- Schools +4.4/10.0
- Livability +4.2/5.0
- 1% rule +3.7/10.0
- DSCR +2.7/10.0
- Condition / age +2.5/5.0
- Rent growth +2.0/5.0
- Appreciation +0.0/10.0
$150,000
🖨 Deal sheet 📄 Offer letter ✓ Due diligence
Listing remarks MLS
Near Downtown! Rare opportunity in a prime location! Double lot Zoned R-2 remodels the existing 1947 home, which features two bedrooms, one bath, and 888 sq ft, and is set on a pier and beam foundation - a solid base for renovation or expansion. Double lot, build a second home on lot 9, and remodel the home on lot 10. Two homes on one property. Located just 1.2 miles from Downtown Social, you're a short walk or quick drive from restaurants, shopping, and entertainment, making this a fantastic location for homeowners, developers, and investors. Whether you're looking to restore charm, generate rental income, or build new, this property is full of potential and ready for your vision!
Key facts
- R2 zoning
- Double lot
- Prime location
Tags
Neighborhood map
What this means for you Summary
Snapshot
- This is a 2-bed/1.0-bath single-family listed at $150k.
Deal economics
- At list price, monthly cash flow is $-166 ($-2k/yr) — negative.
- To cash-flow at today's rent, offer at most $121k (19.5% below list).
- To meet the 1% rule (rent ≥ 1% of price), the offer needs to be $130k (13.2% below list).
- Recommended offer: $121k (19.5% below list) — sets the bar for cash-flow.
- Cap rate 5.5% vs local median 3.4% in New Braunfels — top-decile yield for the area; either an underpriced asset or a hidden risk that comps aren't pricing in. Stress-test before assuming the spread holds.
Location & tenants
- Location reads 83/100 on livability (#9 in TX, #925 nationally) — a professional / high-income tenant draw. Strengths: amenities A+, housing A+, health & safety A+; Watch: commute F.
- New Braunfels ISD (urban): math 47% / reading 53% proficiency, ranked #157 of 826 in TX (top 19%) — acceptable for families but not a draw, mixed tenant base, ~2y average lease.
- Market conditions: Rents soft (-2.0%/yr); 1896 active listings in the ZIP; 22 comparable units currently listed for rent nearby; rentals at typical pace (median 20d on market — plan ~3-4 weeks tenant-placement turnaround); solid renter incomes; 3,420 units permitted in Comal County in 2024 (1,164 in 5+ unit buildings).
Forward outlook
- Local home prices are declining (-3.0%/yr); year-one equity from $1k of loan paydown is wiped out by about $4k of value loss. Plan a longer hold.
- Comal County population projected at +70% by 2050 — long-run rental-demand tailwind backs the buy-and-hold thesis.
Negotiation context
- It's been on market 325 days — a 12% lower offer ($132k) is reasonable based on typical stale-listing flexibility.
- 2 sale attempts; this cycle's ask has dropped $10k (6%) from the opening price — seller is motivated, your offer sets the floor, not the list.
Risks & watch-outs
- Watch-outs: flood insurance adds $66/mo; built in 1947 — expect roof / HVAC / electrical / plumbing capex.
- Climate carrying-cost: severe flood risk; severe wind risk, 80% chance of damaging wind over 30y; extreme-heat days projected 7→21/yr by 2055 (HVAC capex compounding) — expect insurance premiums to compound above CPI over the hold.
Questions for the listing agent
- What do current leases actually rent for vs. the listed asking? Can we see a recent rent roll and the last 12 months of T-12 income?
- It's been on market 325 days. Have you received any prior offers? Is the seller open to a 20% concession, seller financing, or rate buy-down credit?
- Built in 1947 — when were the roof, HVAC, electrical panel, plumbing, and water heater last replaced?
- What's the actual annual flood-insurance premium (NFIP or private), and is the property in a SFHA with mandatory coverage?
- Why hasn't it sold? Are there any deal-killer items the seller is aware of (foundation, flood, title, zoning, code violations)?
- Is there a deadline driving the sale (1031 exchange, divorce, estate, relocation)? That informs how much negotiation room exists.
- Schools are B-rated — typically a magnet for longer-tenancy family renters. What's the average tenant stay here, and is there a school-zone premium baked into asking?
- The area grade is low — what's the realistic commute time and amenity access for the typical tenant pool here? Any planned neighborhood developments (good or bad) we should know about?
- What's the average days-on-market for RENTAL listings here right now (not sales)? A rising rental-DOM trend means longer vacancies and softer asking-rent achievability than the comps imply.
- What's the recent tenant-quality profile in this submarket — average credit score on applications, eviction rate, late-payment / NSF rate, and stable-employment percentage? A property-management company in the area should have these aggregated.
- How much new for-sale + rental construction is in the pipeline within 1–3 miles? Heavy new supply typically softens prices + rents 12–24 months out; constrained supply supports both.
Investment metrics
- 1% rule
- 0.87% ✗
- Cap rate
- 5.50%
- Cash-on-cash
- -2.84%
- DSCR
- 0.87
- GRM
- 9.6
CMA / ARV
- ARV (median comp)
- $240,604
- List price
- $150,000
- Delta
- -37.66%
- Verdict
- UNDERPRICED
- Comps
- 20 within 1.0 mi
Show comp detail 11 sales within ~0.75 mi
| Address | Dist | Beds/Ba | Sqft | Sold | Price | $/sf | Match |
|---|---|---|---|---|---|---|---|
| 1440 Mill | 0.19mi | 2/1.0 | 801 (-2%) | 7mo | $245,000 | $306 | 82 |
| 1722 Lee | 0.38mi | 2/1.0 | 748 (-8%) | 3mo | $250,000 | $334 | 66 |
| 239 School Ave | 0.54mi | 2/1.0 | 816 (0%) | 11mo | $150,000 | $184 | 66 |
| 1409 Katy St | 0.16mi | 2/1.0 | 899 (+10%) | 14mo | $359,000 | $399 | 64 |
| 149 N Peach Ave | 0.25mi | 2/1.0 | 787 (-4%) | 23mo | $279,999 | $356 | 63 |
| 461 Rothe Loop | 0.74mi | 2/1.0 | 840 (+3%) | 4mo | $185,000 | $220 | 57 |
| 1149 W Bridge | 0.39mi | 1/1.0 (-1) | 760 (-7%) | 10mo | $225,000 | $296 | 57 |
| 155 Concepcion Ave | 0.41mi | 2/1.0 | 770 (-6%) | 20mo | $139,000 | $181 | 55 |
| 2043 Spur St | 0.37mi | 2/1.0 | 911 (+12%) | 11mo | $200,000 | $220 | 54 |
| 1850 Lee St | 0.37mi | 3/2.0 (+1) | 912 (+12%) | 15mo | $219,000 | $240 | 41 |
| 771 W Bridge St | 0.70mi | 1/1.0 (-1) | 880 (+8%) | 24mo | $275,000 | $313 | 30 |
Match score weights: distance 35% · size 25% · config 20% · recency 20%. Top-matched comps best support the ARV.
Projected returns pro-forma
-3.0% appreciation · 0.0% rent growth · sell at horizon
- IRR
- -28.3%
- Equity multiple
- 0.08×
- Total profit
- $-38,560
- Equity at exit
- $22,365
- IRR
- -48.6%
- Equity multiple
- -0.46×
- Total profit
- $-61,445
- Equity at exit
- $12,969
Cash invested: $42,000 (down + closing). Projections, not guarantees.
Landlord ↔ Tenant lean methodology
- Overall (STATE)
- 87 Strongly Landlord-Friendly
- State Texas
- 87 Strongly Landlord-Friendly · R+5
- County
- — inherits STATE
- City
- — inherits STATE
ZIP-level market 78130
- Rents YoY
- -2.0%
- Active inventory
- 1896
- Price-to-rent
- 9.6×
Monthly cashflow live
- Estimated rent
- $1,303 high interval (Pro) →
- Mortgage (P&I)
- −$787
- Tax from tax record
- −$279 /mo · $3,350/yr
- Insurance
- −$62
- Flood insurance flood zone
- −$66 /mo · $798/yr
- HOA
- −$0
- Vacancy / Maint / Mgmt
- −$274
- Net cashflow
- $-166
Break-even live
UW: 25.0% down · 7.5% · 30yr · 1.5% tax · 5.0% vac · 8.0% maint · 8.0% mgmt
Financing live
Cash to close
- Down payment
- $37,500
- Closing costs
- $4,500
- Reserves months
- —
- Total cash needed
- —
Loan-product check · same deal, 3 products live
Conventional
25% down · 7.5% · 30yr
- Down + closing
- —
- Monthly P&I
- —
- Monthly cashflow
- —
- DSCR
- —
- Eligible?
- —
Personal DTI + credit; lowest rate.
DSCR
20% down · 8.5% · 30yr
- Down + closing
- —
- Monthly P&I
- —
- Monthly cashflow
- —
- DSCR
- —
- Eligible?
- —
No personal income docs; deal must DSCR.
Hard money
10% down · 12.0% · 12mo
- Down + closing
- —
- Monthly P&I
- —
- Monthly cashflow
- —
- DSCR
- —
- Eligible?
- —
Short-term bridge; refi at stabilization.
Rent comps 22 comps
| Address | Beds | Baths | Sqft | Rent | $/sqft | DOM | Units | Dist |
|---|---|---|---|---|---|---|---|---|
| 1185 W Mill St New Braunfels, TX | 2.0 | 2.0 | 876 | $1,595 | $1.82 | 23d | 1 | 0.39mi |
| 921 Eikel St New Braunfels, TX | 2.0 | 1.5 | 962 | $1,295 | $1.35 | 23d | 1 | 0.56mi |
| 1440 Jackson St Unit B New Braunfels, TX | 2.0 | 1.0 | 750 | $1,150 | $1.53 | 43d | 1 | 0.58mi |
| 2515 W San Antonio St Unit 710 New Braunfels, TX | 2.0 | 2.0 | 1052 | $1,182 | $1.12 | 3d | 1 | 0.64mi |
| 2515 W San Antonio St Unit 610 New Braunfels, TX | 1.0 | 1.0 | 722 | $981 | $1.36 | 3d | 1 | 0.64mi |
| 365 S Sycamore Ave New Braunfels, TX | 1.0 | 1.0 | 550 | $875 | $1.59 | 23d | 1 | 0.68mi |
| 145 Rosedale Ave New Braunfels, TX | 3.0 | 2.0 | 1100 | $1,445 | $1.31 | 43d | 1 | 0.75mi |
| 200 Primrose Cir New Braunfels, TX | 1.0 | 1.0 | 682 | $1,088 | $1.59 | 12d | 2 | 0.79mi |
| 483 Laurel Ln New Braunfels, TX | 1.0–2.0 | 1.0 | 682 | $995 | $1.46 | 1d | 3 | 0.80mi |
| 200 Primrose Cir Apt 14 New Braunfels, TX | 1.0 | 1.0 | 682 | $1,225 | $1.80 | 20d | 1 | 0.80mi |
| 200 Primrose Cir Apt 21 New Braunfels, TX | 2.0 | 1.0 | 882 | $1,100 | $1.25 | 23d | 1 | 0.80mi |
| 1022 Clover Cir New Braunfels, TX | 2.0 | 1.0 | 800 | $1,395 | $1.74 | 10d | 1 | 0.97mi |
| 554 Lee St New Braunfels, TX | 2.0 | 1.0 | 953 | $1,625 | $1.71 | 3d | 1 | 0.97mi |
| 1237 Huisache Ave New Braunfels, TX | 1.0 | 1.0 | 680 | $974 | $1.43 | 43d | 1 | 0.98mi |
| 730 Howard St Unit 29 New Braunfels, TX | 2.0 | 1.5 | 982 | $1,150 | $1.17 | 4d | 1 | 1.09mi |
| 144 Landa St New Braunfels, TX | 1.0–2.0 | 1.0–2.0 | 1085 | $3,995 | $3.68 | 43d | 17 | 1.10mi |
| 144 Landa St New Braunfels, TX | 2.0 | 1.0–2.0 | 1080 | $3,995 | $3.70 | 2d | 36 | 1.10mi |
| 264 Loma Vista St New Braunfels, TX | 1.0 | 1.0 | 576 | $1,150 | $2.00 | 3d | 3 | 1.10mi |
| 1231 Huisache Ave New Braunfels, TX | 1.0–2.0 | 1.0–2.0 | 866 | $1,588 | $1.83 | 1d | 8 | 1.11mi |
| 935 Linde Ave Unit H New Braunfels, TX | 2.0 | 2.0 | 972 | $975 | $1.00 | 43d | 1 | 1.15mi |
| 337 S Water Ln New Braunfels, TX | 2.0 | 2.0 | 1079 | $1,295 | $1.20 | 23d | 1 | 1.21mi |
| 3040 Pine Valley Dr New Braunfels, TX | 2.0 | 2.0 | 956 | $1,325 | $1.39 | 2d | 1 | 1.28mi |
Listing history 20 events
-
2026-06-18days on market $150,000 Active 325 DOM
-
2026-06-17days on market $150,000 Active 324 DOM
-
2026-06-16days on market $150,000 Active 323 DOM
-
2026-06-15days on market $150,000 Active 322 DOM
-
2026-06-13days on market $150,000 Active 320 DOM
-
2026-06-09days on market $150,000 Active 316 DOM
-
2026-06-08days on market $150,000 Active 315 DOM
-
2026-06-07days on market $150,000 Active 314 DOM
-
2026-06-04days on market $150,000 Active 311 DOM
-
2026-06-03days on market $150,000 Active 310 DOM
-
2026-06-02days on market $150,000 Active 309 DOM
-
2026-06-02days on market $150,000 Active 308 DOM
-
2026-05-31days on market $150,000 Active 307 DOM
-
2026-01-14status Back on Market 691-char remark
Show marketing remark (691 chars)
Near Downtown! Rare opportunity in a prime location! Double lot Zoned R-2 remodels the existing 1947 home, which features two bedrooms, one bath, and 888 sq ft, and is set on a pier and beam foundation - a solid base for renovation or expansion. Double lot, build a second home on lot 9, and remodel the home on lot 10. Two homes on one property. Located just 1.2 miles from Downtown Social, you're a short walk or quick drive from restaurants, shopping, and entertainment, making this a fantastic location for homeowners, developers, and investors. Whether you're looking to restore charm, generate rental income, or build new, this property is full of potential and ready for your vision!
-
2026-01-09historical Active Option 691-char remark
Show marketing remark (691 chars)
Near Downtown! Rare opportunity in a prime location! Double lot Zoned R-2 remodels the existing 1947 home, which features two bedrooms, one bath, and 888 sq ft, and is set on a pier and beam foundation - a solid base for renovation or expansion. Double lot, build a second home on lot 9, and remodel the home on lot 10. Two homes on one property. Located just 1.2 miles from Downtown Social, you're a short walk or quick drive from restaurants, shopping, and entertainment, making this a fantastic location for homeowners, developers, and investors. Whether you're looking to restore charm, generate rental income, or build new, this property is full of potential and ready for your vision!
-
2025-11-06price $150,000 691-char remark
Show marketing remark (691 chars)
Near Downtown! Rare opportunity in a prime location! Double lot Zoned R-2 remodels the existing 1947 home, which features two bedrooms, one bath, and 888 sq ft, and is set on a pier and beam foundation - a solid base for renovation or expansion. Double lot, build a second home on lot 9, and remodel the home on lot 10. Two homes on one property. Located just 1.2 miles from Downtown Social, you're a short walk or quick drive from restaurants, shopping, and entertainment, making this a fantastic location for homeowners, developers, and investors. Whether you're looking to restore charm, generate rental income, or build new, this property is full of potential and ready for your vision!
-
2025-08-21price $135,000 691-char remark
Show marketing remark (691 chars)
Near Downtown! Rare opportunity in a prime location! Double lot Zoned R-2 remodels the existing 1947 home, which features two bedrooms, one bath, and 888 sq ft, and is set on a pier and beam foundation - a solid base for renovation or expansion. Double lot, build a second home on lot 9, and remodel the home on lot 10. Two homes on one property. Located just 1.2 miles from Downtown Social, you're a short walk or quick drive from restaurants, shopping, and entertainment, making this a fantastic location for homeowners, developers, and investors. Whether you're looking to restore charm, generate rental income, or build new, this property is full of potential and ready for your vision!
-
2025-07-28$160,000 New 691-char remark
Show marketing remark (691 chars)
Near Downtown! Rare opportunity in a prime location! Double lot Zoned R-2 remodels the existing 1947 home, which features two bedrooms, one bath, and 888 sq ft, and is set on a pier and beam foundation - a solid base for renovation or expansion. Double lot, build a second home on lot 9, and remodel the home on lot 10. Two homes on one property. Located just 1.2 miles from Downtown Social, you're a short walk or quick drive from restaurants, shopping, and entertainment, making this a fantastic location for homeowners, developers, and investors. Whether you're looking to restore charm, generate rental income, or build new, this property is full of potential and ready for your vision!
-
2025-07-09soldstatus
-
1967-11-13soldstatus
ⓘ Source: listings_history table (triggers on properties + properties_extension) + one-shot
backfill from property_details.listing_events for pre-trigger history.
Tax reassessment forecast TX · Resets to sale price
- Current annual tax
- $3,350 · $279/mo
- Projected year-2 tax
- $3,350 · $279/mo
- Expected delta
- $0/yr ($0/mo · 0.0%)
ⓘ Screening estimate from a state-policy table — verify with the county assessor before closing.
Climate risk First Street
- Flood 8/10 Severe FEMA zone X (shaded) · 99% chance over 30 yrs
- Wildfire 3/10 Moderate
- Heat 8/10 Severe 7 d/yr ≥108°F today · 21 d/yr by 30 yrs out
- Wind 8/10 Severe 80% chance of damaging wind over 30 yrs
- Air quality 1/10 Low 0 unhealthy d/yr today · 0 by 30 yrs out
Nearby sold comps map
Loading sold comps map…
Walkable amenities ~0.75 mi
Loading nearby amenities…
Taxation est. · year 1
- Rental income
- $15,630
- − Mortgage interest
- −$8,402
- − Property taxes
- −$3,350
- − Insurance
- −$1,547
- − Repairs & maintenance
- −$1,250
- − Management
- −$1,250
- − Depreciation
- −$4,364
- Taxable loss
- −$4,533
- Est. tax savings @ 24.0%
- +$1,088
- After-tax cash flow
- $-900/yr
For passive investors: Depreciation is non-cash, so a rental often shows a tax loss while cash-flowing — sheltering income. Rental losses are passive: they offset passive income freely, and up to $25,000/yr can offset ordinary (W-2) income if you actively participate and your MAGI is under $100k (phasing out to $0 by $150k); unused losses carry forward. On sale, claimed depreciation is recaptured at up to 25%, and gains may owe capital-gains tax (a 1031 exchange can defer both). Figures are a year-1 estimate at your 24.0% rate — not tax advice; consult a CPA.
Schools (NCES district)
- District
- New Braunfels ISD
- NCES district ID
- 4832370
- Math proficiency
- 47% ▼ -10.00%
- Reading proficiency
- 53% ▼ -2.00%
- Median HH income
- $60,945
- Composite
- 43.81/100
- National rank
- #2931
- State rank
- #157 of 826 in TX
Livability — New Braunfels
- Score
- 83/100
- State rank
- #9
- US rank
- #925
Category grades
Schools grade is shown separately in the Schools card above.
Census & demographics
- Census place
- New Braunfels, TX
- County
- Comal County · 206,262 people
- City population
- 144,962
- Metro
- San Antonio-New Braunfels, TX
- Population (ZIP)
- 104,009
- Household income
- $83,064
- Rent vs Own
- Severe rent burden
- 2912.0
Population outlook (Comal County) Hauer SSP2
- Today (2025)
- 175,637 people
- By 2030
- 199,911 · +13.8%
- By 2040
- 249,436 · +42.0%
- By 2050
- 299,430 · +70.5%
- By 2075
- 423,857 · +141.3%
- By 2100
- 512,048 · +191.5%
Race, ethnicity, and origin ACS 2023
- Neighborhood character
- Majority White (58%)
- Race & ethnicity
- White 58% Hispanic / Latino 37% Two or more races 19% Black 2%
- Hispanic origin (detail)
- Mexican 32%
- Common ancestry
- Romanian 2% Lithuanian 2% Slovak 2%
- Foreign-born
- 7% · Canada
- Languages at home
- 78% English-only · Spanish 20% German/W. Germanic 1%
Political lean MEDSL · Comal
- 2024 margin
- Solid R (+45.5) · D 26.8% · R 72.2%
- 2008→2024 swing
- +1.9pp toward D · 2008: -47.4pp · 2024: -45.5pp
- All cycles
- 2024: R+45.5 2020: R+42.7 2016: R+50.1 2012: R+54.1 2008: R+47.4
Not yet ingested
- Civics
- —
Market trends
- HPI YoY
- ▼ -190.61%
- Current HPI
- 173.7128
- Rent YoY
- ▼ -1.97%
- Metro
- San Antonio-New Braunfels, TX
- State GDP YoY
- ▲ 3.95%
- F500 in state
- 110
Industry mix (Fortune 500 HQ in TX)
| Industry | F500 HQs | Revenue |
|---|---|---|
| Energy | 16 | $1,198B |
|
||
| Technology | 5 | $198B |
|
||
| Engineering / Construction | 4 | $72B |
|
||
| Energy Services | 3 | $60B |
|
||
| Utilities | 3 | $41B |
|
||
| Healthcare | 2 | $330B |
|
||
Price history
-6.2% since first listed7 events — show timeline
- 2026-01-14 Relisted — LERA
- 2026-01-09 Contingent — LERA
- 2025-11-06 Price Changed $150,000 LERA
- 2025-08-21 Price Changed $135,000 LERA
- 2025-07-28 Listed $160,000 LERA
- 2025-07-09 Sold (Public Records) — Public Records
- 1967-11-13 Sold (Public Records) — Public Records
Property tax history
+6.1%/yrLatest (2026): $3,350 · +6.8% YoY. Source: county tax records.
Cash-flow waterfall
monthlySold comps — $/sqft
last 12 mo · ≤1 miLoading sold comps…