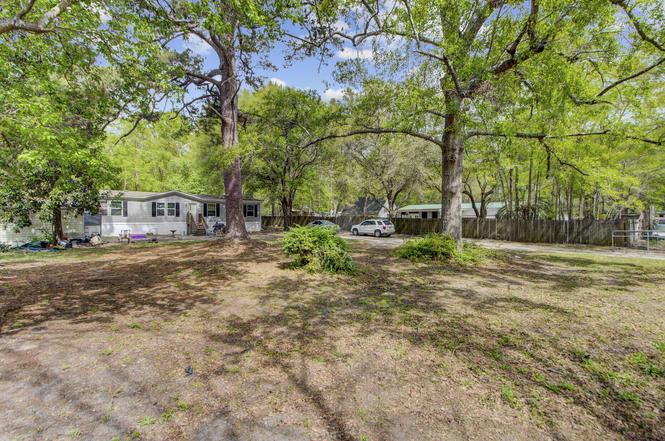
2659 Sidneys Rd · Walterboro, SC
Flood risk No data
- FEMA flood zone
- —
- Chance of flooding over 30 yrs
- —
- Est. flood insurance / yr
- —
Fire risk No data
- Est. fire insurance / yr
- —
Heat risk No data
- Hot days now (above threshold)
- —
- Hot days in 30 yrs
- —
Wind risk No data
- Chance of severe wind over 30 yrs
- —
Air-quality risk No data
- Unhealthy air days now
- —
- Unhealthy air days in 30 yrs
- —
Risk factors via First Street. Map © Google.
Why this score? — see what drove the B- grade
The composite is a weighted blend of 9 inputs, each scored 0–100. Each bar is that input's sub-score; the figure is the points it added to the 100-point composite (weight × sub-score).
- Cash flow +30.0/30.0
- 1% rule +10.0/10.0
- DSCR +10.0/10.0
- ARV discount +7.5/15.0
- Livability +2.9/5.0
- Rent growth +2.5/5.0
- Condition / age +2.5/5.0
- Schools +1.7/10.0
- Appreciation +0.0/10.0
$149,000
🖨 Deal sheet (PDF) 📄 Offer letter ✓ Due diligence
Listing remarks
Built in 2023, this beautiful 4-bedroom, 2-bathroom home offers the perfect blend of modern style and peaceful country charm. With its open floor plan and on-trend finishes, the space feels fresh, functional, and ready for both relaxing nights in and lively gatherings with family and friends. Set on a spacious and level 0.5-acre lot, there's plenty of room to enjoy the outdoors--whether you're starting a garden, letting the dogs run free, or hosting weekend barbecues. The home's thoughtful layout offers easy living, and the rear lot provides added privacy and space to spread out. Ideally located just a short drive from shopping, dining, and schools, this property also offers excellent acces
Key facts
- 0.5 acre lot
- Built 2023
- Listed 237 days
Property features AI
Finance
- Other: Fee simple ownership; No additional structures
Exterior
- Parking: Off-street parking
- Utilities: Septic tank
- Home design: Manufactured/mobile home (double wide); One story
- Construction: Asphalt roof; Aluminum skirting
- Exterior features: Level, interior lot; Lot between 0.5 and 1 acre
Interior
- Bedrooms: 4 bedrooms; Primary bedroom on lower level
- Flooring: Vinyl flooring
- Bathrooms: 2 bathrooms
- Heating & cooling: Central heating; Central air conditioning
- Interior features: Cathedral/vaulted ceilings; Living and dining room combined
- Laundry & utility: Washer hookup; Electric dryer hookup
Neighborhood map
What this means for you Summary
Snapshot
- This is a 4-bed/2.0-bath manufactured listed at $149k.
Deal economics
- At list price, monthly cash flow is $1k ($13k/yr) — positive.
- The deal already cash-flows at list — no discount required.
- Meets the 1% rule at list price ($3k rent vs $149k).
- Recommended offer: $131k (12.0% below list) — sets the bar for market timing.
Location & tenants
- Location reads 57/100 on livability (#269 in SC) — a working-class tenant base; expect higher turnover. Strengths: cost of living A+, health & safety A+, housing A-; Watch: crime F, amenities F, commute F.
- Colleton 01 (rural): math 13% / reading 28% proficiency, ranked #69 of 80 in SC (top 86%) — low school quality limits family demand, transient renter base, plan for 1-2y turnover; 69% free/reduced lunch — lower-income household profile, screen leases tightly.
- Zoned schools: Northside Elementary (math 14% / reading 22%, grade F, #508 of 597 statewide, top 86%, 452 students, 100% FRL); Colleton County Middle (math 8% / reading 18%, grade F, #210 of 229 statewide, top 93%, 1,121 students, 100% FRL); Colleton County High (math 28% / reading 80%, grade C-, #137 of 196 statewide, top 70%, 1,497 students, 100% FRL) — zoned schools average 100% FRL vs 69% district-wide (31 pts higher); higher-poverty schools than district average — tighter screening recommended.
- Market conditions: 223 active listings in the ZIP; 50 units permitted in Colleton County in 2024 (0 in 5+ unit buildings).
Forward outlook
- Local home prices are declining (-3.0%/yr); year-one equity from $1k of loan paydown is wiped out by about $4k of value loss. Plan a longer hold.
- Colleton County population projected at -28% by 2050 — secular population decline; favor cash flow + early exit over multi-decade hold.
- At projected returns (-3.0% appreciation + 3.0% rent growth), your $42k cash investment doubles in ~4 years — after that, you're playing with house money.
Negotiation context
- It's been on market 238 days — a 12% lower offer ($131k) is reasonable based on typical stale-listing flexibility.
- 8 sale attempts since 2y ago with the ask held roughly flat each time — persistent listings suggest the price (not the market) is what's stuck; bring a comps-based counter.
Questions for the listing agent
- It's been on market 238 days. Have you received any prior offers? Is the seller open to a 12% concession, seller financing, or rate buy-down credit?
- Why hasn't it sold? Are there any deal-killer items the seller is aware of (foundation, flood, title, zoning, code violations)?
- Is there a deadline driving the sale (1031 exchange, divorce, estate, relocation)? That informs how much negotiation room exists.
- Schools are F-rated, which usually means shorter tenancies and higher turnover. Who's the typical renter profile here, and what's been the actual vacancy rate?
- Crime grade is F in this area — have there been break-ins, vandalism, or insurance claims at this property in the last 3 years? What carrier currently insures it and at what premium?
- What's the average days-on-market for RENTAL listings here right now (not sales)? A rising rental-DOM trend means longer vacancies and softer asking-rent achievability than the comps imply.
- What's the recent tenant-quality profile in this submarket — average credit score on applications, eviction rate, late-payment / NSF rate, and stable-employment percentage? A property-management company in the area should have these aggregated.
- How much new for-sale + rental construction is in the pipeline within 1–3 miles? Heavy new supply typically softens prices + rents 12–24 months out; constrained supply supports both.
Investment metrics
- 1% rule
- 1.80% ✓
- Cap rate
- 15.15%
- Cash-on-cash
- 31.62%
- DSCR
- 2.41
- GRM
- 4.6
CMA / ARV
No comps found within radius.
Projected returns pro-forma
-3.0% appreciation · 3.0% rent growth · sell at horizon
- IRR
- 26.5%
- Equity multiple
- 2.10×
- Total profit
- $45,905
- Equity at exit
- $22,216
- IRR
- 34.2%
- Equity multiple
- 4.12×
- Total profit
- $130,260
- Equity at exit
- $12,883
Cash invested: $41,720 (down + closing). Projections, not guarantees.
Landlord ↔ Tenant lean methodology
- Overall (STATE)
- 90 Strongly Landlord-Friendly
- State South Carolina
- 90 Strongly Landlord-Friendly · R+6
- County
- — inherits STATE
- City
- — inherits STATE
ZIP-level market 29488
- Home prices YoY
- -33.6%
- Active inventory
- 223
- Price-to-rent
- 4.6×
Monthly cashflow live
- Estimated rent
- $2,676 medium interval (Pro) →
- Mortgage (P&I)
- −$781
- Tax from tax record
- −$171 /mo · $2,053/yr
- Insurance
- −$62
- HOA
- −$0
- Vacancy / Maint / Mgmt
- −$562
- Net cashflow
- $1,099
Break-even live
Sensitivity live
| Price | -10% $1,184 | -5% $1,142 | +0% $1,099 | +5% $1,057 | +10% $1,015 |
|---|---|---|---|---|---|
| Rent | -10% $888 | -5% $994 | +0% $1,099 | +5% $1,205 | +10% $1,311 |
| Rate | -1.0pp $1,174 | -0.5pp $1,137 | base $1,099 | +0.5pp $1,061 | +1.0pp $1,021 |
UW: 25.0% down · 7.5% · 30yr · 1.5% tax · 5.0% vac · 8.0% maint · 8.0% mgmt
Financing live
Cash to close
- Down payment
- $37,250
- Closing costs
- $4,470
- Reserves months
- —
- Total cash needed
- —
Loan-product check · same deal, 3 products live
Conventional
25% down · 7.5% · 30yr
- Down + closing
- —
- Monthly P&I
- —
- Monthly cashflow
- —
- DSCR
- —
- Eligible?
- —
Personal DTI + credit; lowest rate.
DSCR
20% down · 8.5% · 30yr
- Down + closing
- —
- Monthly P&I
- —
- Monthly cashflow
- —
- DSCR
- —
- Eligible?
- —
No personal income docs; deal must DSCR.
Hard money
10% down · 12.0% · 12mo
- Down + closing
- —
- Monthly P&I
- —
- Monthly cashflow
- —
- DSCR
- —
- Eligible?
- —
Short-term bridge; refi at stabilization.
Listing history 35 events
-
2026-06-21days on market $149,000 Active 238 DOM
-
2026-06-21days on market $149,000 Active 237 DOM
-
2026-06-18days on market $149,000 Active 235 DOM
-
2026-06-17days on market $149,000 Active 234 DOM
-
2026-06-16days on market $149,000 Active 233 DOM
-
2026-06-15days on market $149,000 Active 232 DOM
-
2026-06-13days on market $149,000 Active 230 DOM
-
2026-06-12days on market $149,000 Active 229 DOM
-
2026-06-09days on market $149,000 Active 226 DOM
-
2026-06-08days on market $149,000 Active 225 DOM
-
2026-06-08days on market $149,000 Active 224 DOM
-
2026-06-04days on market $149,000 Active 220 DOM
-
2026-06-02days on market $149,000 Active 219 DOM
-
2026-06-01days on market $149,000 Active 218 DOM
-
2026-05-31days on market $149,000 Active 217 DOM
-
2026-02-20status Active
-
2026-02-20price $149,000
-
2025-09-29price $135,000
-
2025-09-15$150,000 Active
-
2025-08-28historical
-
2025-08-18price $140,000
-
2025-07-29status Active
-
2025-07-06historical Active Under Contract
-
2025-06-18status Active
-
2025-06-09historical Active Under Contract
-
2025-05-20price $150,000
-
2025-05-09price $160,000
-
2025-04-21$165,000 Active
-
2025-02-10historical
-
2025-01-02status Active
-
2024-10-14$165,000 Active
-
2024-10-04historical
-
2024-09-16price $155,000
-
2024-09-12price $165,000
-
2024-09-10$170,000 Active
ⓘ Source: listings_history table (triggers on properties + properties_extension) + one-shot
backfill from property_details.listing_events for pre-trigger history.
Tax reassessment forecast SC · Resets to sale price
- Current annual tax
- $2,053 · $171/mo
- Projected year-2 tax
- $2,053 · $171/mo
- Expected delta
- $0/yr ($0/mo · 0.0%)
ⓘ Screening estimate from a state-policy table — verify with the county assessor before closing.
Nearby sold comps map
Loading sold comps map…
Walkable amenities ~0.75 mi
Loading nearby amenities…
Taxation est. · year 1
- Rental income
- $32,110
- − Mortgage interest
- −$8,346
- − Property taxes
- −$2,053
- − Insurance
- −$745
- − Repairs & maintenance
- −$2,569
- − Management
- −$2,569
- − Depreciation
- −$4,335
- Taxable income
- $11,493
- Est. tax owed @ 24.0%
- −$2,758
- After-tax cash flow
- $10,434/yr
For passive investors: Depreciation is non-cash, so a rental often shows a tax loss while cash-flowing — sheltering income. Rental losses are passive: they offset passive income freely, and up to $25,000/yr can offset ordinary (W-2) income if you actively participate and your MAGI is under $100k (phasing out to $0 by $150k); unused losses carry forward. On sale, claimed depreciation is recaptured at up to 25%, and gains may owe capital-gains tax (a 1031 exchange can defer both). Figures are a year-1 estimate at your 24.0% rate — not tax advice; consult a CPA.
Schools (NCES district)
- District
- Colleton 01
- NCES district ID
- 4501830
- Math proficiency
- 13% ▼ -10.00%
- Reading proficiency
- 28% ▬ 0.00%
- Median HH income
- $33,128
- Composite
- 16.66/100
- National rank
- #9171
- State rank
- #69 of 80 in SC
Livability — Walterboro
- Score
- 57/100
- State rank
- #269
- US rank
- #21618
Category grades
Schools grade is shown separately in the Schools card above.
Census & demographics
- City population
- 22,367
- Population (ZIP)
- 22,367
Population outlook (Colleton County) Hauer SSP2
- Today (2025)
- 34,932 people
- By 2030
- 33,078 · -5.3%
- By 2040
- 29,017 · -16.9%
- By 2050
- 25,029 · -28.3%
- By 2075
- 16,894 · -51.6%
- By 2100
- 10,518 · -69.9%
Race, ethnicity, and origin ACS 2023
- Neighborhood character
- Diverse neighborhood (Simpson 0.56)
- Race & ethnicity
- White 54% Black 38% Hispanic / Latino 4% Two or more races 4%
- Common ancestry
- Italian 2% Lithuanian 1% Slovak 1%
- Foreign-born
- 2% · Canada
- Languages at home
- 97% English-only · Spanish 2%
Political lean MEDSL · Colleton
- 2024 margin
- R (+18.2) · D 40.4% · R 58.5% · Other 1.1%
- 2008→2024 swing
- -18.7pp toward R · 2008: 0.5pp · 2024: -18.2pp
- All cycles
- 2024: R+18.2 2020: R+9.5 2016: R+8.5 2012: D+0.2 2008: D+0.5
Not yet ingested
- Civics
- —
Market trends
- HPI YoY
- ▼ -119.20%
- Current HPI
- 235.1237
- Rent YoY
- —
- Metro
- —
- State GDP YoY
- ▲ 4.51%
- F500 in state
- 2
Industry mix (Fortune 500 HQ in SC)
| Industry | F500 HQs | Revenue |
|---|---|---|
| Packaging | 1 | $7B |
|
||
Price history
-12.4% since first listed20 events — show timeline
- 2026-02-20 Relisted — Charleston Trident MLS
- 2026-02-20 Price Changed $149,000 Charleston Trident MLS
- 2025-09-29 Price Changed $135,000 Charleston Trident MLS
- 2025-09-15 Listed $150,000 Charleston Trident MLS
- 2025-08-28 Listing Removed — Charleston Trident MLS
- 2025-08-18 Price Changed $140,000 Charleston Trident MLS
- 2025-07-29 Relisted — Charleston Trident MLS
- 2025-07-06 Contingent — Charleston Trident MLS
- 2025-06-18 Relisted — Charleston Trident MLS
- 2025-06-09 Contingent — Charleston Trident MLS
- 2025-05-20 Price Changed $150,000 Charleston Trident MLS
- 2025-05-09 Price Changed $160,000 Charleston Trident MLS
- 2025-04-21 Listed $165,000 Charleston Trident MLS
- 2025-02-10 Listing Removed — Charleston Trident MLS
- 2025-01-02 Relisted — Charleston Trident MLS
- 2024-10-14 Listed $165,000 Charleston Trident MLS
- 2024-10-04 Listing Removed — Charleston Trident MLS
- 2024-09-16 Price Changed $155,000 Charleston Trident MLS
- 2024-09-12 Price Changed $165,000 Charleston Trident MLS
- 2024-09-10 Listed $170,000 Charleston Trident MLS
Property tax history
+4.5%/yrLatest (2025): $2,053 · +4.5% YoY. Source: county tax records.
Cash-flow waterfall
monthlySold comps — $/sqft
last 12 mo · ≤1 miLoading sold comps…