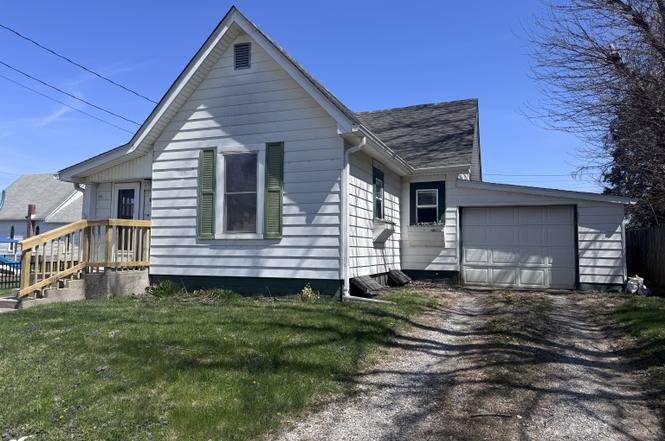
308 N Grant Ave · Crawfordsville, IN
Flood risk 1/10 · Minimal
- FEMA flood zone
- X (unshaded)
- Chance of flooding over 30 yrs
- 0.0%
- Est. flood insurance / yr
- $473 – $860
Fire risk 1/10 · Minimal
- Est. fire insurance / yr
- $717 – $1,331
Heat risk 3/10 · Minor
- Hot days now (above 101°F)
- 7 days/yr
- Hot days in 30 yrs
- 18 days/yr
Wind risk 2/10 · Minimal
- Chance of severe wind over 30 yrs
- 0.0%
Air-quality risk 2/10 · Minimal
- Unhealthy air days now
- 1 days/yr
- Unhealthy air days in 30 yrs
- 2 days/yr
Risk factors via First Street. Map © Google.
Why this score? — see what drove the F grade
The composite is a weighted blend of 9 inputs, each scored 0–100. Each bar is that input's sub-score; the figure is the points it added to the 100-point composite (weight × sub-score).
- ARV discount +10.5/15.0
- Cash flow +8.3/30.0
- Livability +3.6/5.0
- Rent growth +3.3/5.0
- Schools +2.5/10.0
- Condition / age +2.5/5.0
- DSCR +2.3/10.0
- 1% rule +1.3/10.0
- Appreciation +0.0/10.0
$149,900
🖨 Deal sheet 📄 Offer letter ✓ Due diligence
Listing remarks MLS
2 bedroom home on nice lot with fully fenced back yard. Vinyl exterior, 100 amp electric,new water heater.furnace and central air new in 2000. Attached garage with mud room, basement and wood deck.
Key facts
- 4,138 sq ft lot
- Garage
- Built 1900
Property features AI
Exterior
- Parking: Attached garage (1 car)
- Utilities: Public water; Municipal sewer connection; Solid waste service
- Home design: Single family residence; One level
- Construction: Brick and vinyl siding exterior; Brick/mortar foundation
- Exterior features: About 0.1 acre lot
Interior
- Kitchen: Gas oven; Refrigerator
- Bedrooms: 2 bedrooms on the main level
- Bathrooms: 1 full bathroom on the main level
- Heating & cooling: Forced air heating (natural gas); Central air conditioning
- Interior features: Attic access; High ceilings; Basement
- Laundry & utility: Washer; Dryer; Mud room (10 x 6.5)
Neighborhood map
What this means for you Summary
Snapshot
- This is a 2-bed/1.0-bath single-family listed at $150k.
Deal economics
- At list price, monthly cash flow is $-137 ($-2k/yr) — negative.
- To cash-flow at today's rent, offer at most $126k (16.2% below list).
- To meet the 1% rule (rent ≥ 1% of price), the offer needs to be $95k (36.7% below list).
- Recommended offer: $95k (36.7% below list) — sets the bar for 1% rule.
- Cap rate 5.2% vs local median 3.5% in Crawfordsville — top-decile yield for the area; either an underpriced asset or a hidden risk that comps aren't pricing in. Stress-test before assuming the spread holds.
Location & tenants
- Location reads 72/100 on livability (#118 in IN) — a middle-class / working-renter tenant base. Strengths: cost of living A+, housing A+, crime A; Watch: schools D+, commute D+, amenities F.
- Crawfordsville Community Schools (town): math 27% / reading 32% proficiency, ranked #247 of 301 in IN (top 82%) — low school quality limits family demand, transient renter base, plan for 1-2y turnover.
- Market conditions: Rents rising (+3.3%/yr); 203 active listings in the ZIP; 2 comparable units currently listed for rent nearby; 52 units permitted in Montgomery County in 2024 (0 in 5+ unit buildings).
- This rent is only 17% of the median local income ($68k/yr) — well below the 30% rent-burden line; pricing power to push rent on renewal without tenant pushback.
Forward outlook
- Local home prices are declining (-3.0%/yr); year-one equity from $1k of loan paydown is wiped out by about $4k of value loss. Plan a longer hold.
- Montgomery County population projected to shrink 9% by 2050 — rents likely to lag national; underwrite the cash flow, not the appreciation.
Negotiation context
- It's been on market 99 days — a 9% lower offer ($136k) is reasonable based on typical stale-listing flexibility.
- 4 sale attempts since 21y ago; this cycle's ask has dropped $24k (14%) from the opening price — seller is motivated, your offer sets the floor, not the list.
- Current owner paid $58k; list at $150k implies a 158% gain — meaningful room to come down on a strong offer.
Risks & watch-outs
- Watch-outs: built in 1900 — expect roof / HVAC / electrical / plumbing capex.
Questions for the listing agent
- What do current leases actually rent for vs. the listed asking? Can we see a recent rent roll and the last 12 months of T-12 income?
- It's been on market 99 days. Have you received any prior offers? Is the seller open to a 37% concession, seller financing, or rate buy-down credit?
- Built in 1900 — when were the roof, HVAC, electrical panel, plumbing, and water heater last replaced?
- Why hasn't it sold? Are there any deal-killer items the seller is aware of (foundation, flood, title, zoning, code violations)?
- Is there a deadline driving the sale (1031 exchange, divorce, estate, relocation)? That informs how much negotiation room exists.
- Schools are D-rated, which usually means shorter tenancies and higher turnover. Who's the typical renter profile here, and what's been the actual vacancy rate?
- The area grade is low — what's the realistic commute time and amenity access for the typical tenant pool here? Any planned neighborhood developments (good or bad) we should know about?
- What's the average days-on-market for RENTAL listings here right now (not sales)? A rising rental-DOM trend means longer vacancies and softer asking-rent achievability than the comps imply.
- What's the recent tenant-quality profile in this submarket — average credit score on applications, eviction rate, late-payment / NSF rate, and stable-employment percentage? A property-management company in the area should have these aggregated.
- How much new for-sale + rental construction is in the pipeline within 1–3 miles? Heavy new supply typically softens prices + rents 12–24 months out; constrained supply supports both.
Investment metrics
- 1% rule
- 0.63% ✗
- Cap rate
- 5.19%
- Cash-on-cash
- -3.93%
- DSCR
- 0.83
- GRM
- 13.2
CMA / ARV
- ARV (on-the-fly)
- $160,740
- Comps found
- 10
Show comp detail 10 sales within ~0.75 mi
| Address | Dist | Beds/Ba | Sqft | Sold | Price | $/sf | Match |
|---|---|---|---|---|---|---|---|
| 309 Covington St | 0.15mi | 2/1.0 | 896 (-5%) | 13mo | $153,500 | $171 | 74 |
| 210 Bluff St | 0.35mi | 2/1.0 | 960 (+2%) | 15mo | $130,000 | $135 | 68 |
| 110 S West St | 0.55mi | 2/1.0 | 972 (+3%) | 2mo | $167,500 | $172 | 67 |
| 311 Covington St | 0.16mi | 2/1.0 | 892 (-5%) | 22mo | $115,500 | $129 | 66 |
| 512 Whitlock Ave | 0.56mi | 2/1.0 | 920 (-2%) | 18mo | $58,293 | $63 | 56 |
| 1014 Westwood Dr | 0.59mi | 3/1.0 (+1) | 984 (+5%) | 4mo | $168,000 | $171 | 56 |
| 1002 Westwood Dr | 0.54mi | 3/1.0 (+1) | 930 (-1%) | 24mo | $110,000 | $118 | 48 |
| 312 List St | 0.73mi | 3/1.5 (+1) | 988 (+5%) | 4mo | $175,000 | $177 | 47 |
| 908 W Main St | 0.50mi | 2/1.0 | 1,070 (+14%) | 15mo | $180,000 | $168 | 41 |
| 152 W Old Oak Hill Rd | 0.68mi | 3/2.0 (+1) | 1,054 (+12%) | 4mo | $199,900 | $190 | 36 |
Match score weights: distance 35% · size 25% · config 20% · recency 20%. Top-matched comps best support the ARV.
Projected returns pro-forma
-3.0% appreciation · 3.28% rent growth · sell at horizon
- IRR
- -22.7%
- Equity multiple
- 0.22×
- Total profit
- $-32,854
- Equity at exit
- $22,351
- IRR
- -16.7%
- Equity multiple
- 0.07×
- Total profit
- $-39,089
- Equity at exit
- $12,961
Cash invested: $41,972 (down + closing). Projections, not guarantees.
Landlord ↔ Tenant lean methodology
- Overall (STATE)
- 90 Strongly Landlord-Friendly
- State Indiana
- 90 Strongly Landlord-Friendly · R+11
- County
- — inherits STATE
- City
- — inherits STATE
ZIP-level market 47933
- Home prices YoY
- -27.1%
- Rents YoY
- 3.3%
- Active inventory
- 203
- Price-to-rent
- 13.2×
Monthly cashflow live
- Estimated rent
- $948 medium interval (Pro) →
- Mortgage (P&I)
- −$786
- Tax from tax record
- −$38 /mo · $458/yr
- Insurance
- −$62
- HOA
- −$0
- Vacancy / Maint / Mgmt
- −$199
- Net cashflow
- $-137
Break-even live
UW: 25.0% down · 7.5% · 30yr · 1.5% tax · 5.0% vac · 8.0% maint · 8.0% mgmt
Financing live
Cash to close
- Down payment
- $37,475
- Closing costs
- $4,497
- Reserves months
- —
- Total cash needed
- —
Loan-product check · same deal, 3 products live
Conventional
25% down · 7.5% · 30yr
- Down + closing
- —
- Monthly P&I
- —
- Monthly cashflow
- —
- DSCR
- —
- Eligible?
- —
Personal DTI + credit; lowest rate.
DSCR
20% down · 8.5% · 30yr
- Down + closing
- —
- Monthly P&I
- —
- Monthly cashflow
- —
- DSCR
- —
- Eligible?
- —
No personal income docs; deal must DSCR.
Hard money
10% down · 12.0% · 12mo
- Down + closing
- —
- Monthly P&I
- —
- Monthly cashflow
- —
- DSCR
- —
- Eligible?
- —
Short-term bridge; refi at stabilization.
Rent comps 2 comps
| Address | Beds | Baths | Sqft | Rent | $/sqft | DOM | Units | Dist |
|---|---|---|---|---|---|---|---|---|
| 201 E Pike St Crawfordsville, IN | 1.0 | 1.0 | 375 | $675 | $1.80 | 20d | 3 | 0.40mi |
| 923 Indian Springs Rd Crawfordsville, IN | 2.0 | 1.5 | 1000 | $1,089 | $1.09 | 13d | 3 | 0.58mi |
Listing history 13 events
-
2026-05-08status Pending
-
2026-05-06price $149,900
-
2026-04-08price $157,900
-
2026-03-24price $159,900
-
2026-03-02price $162,500
-
2026-02-23price $167,500
-
2026-02-05price $169,999
-
2026-01-28$173,500 Active
-
2025-12-01$72,500
-
2006-06-28soldstatus $58,000 197-char remark
Show marketing remark (197 chars)
2 bedroom home on nice lot with fully fenced back yard. Vinyl exterior, 100 amp electric,new water heater.furnace and central air new in 2000. Attached garage with mud room, basement and wood deck.
-
2005-08-25$63,000 197-char remark
Show marketing remark (197 chars)
2 bedroom home on nice lot with fully fenced back yard. Vinyl exterior, 100 amp electric,new water heater.furnace and central air new in 2000. Attached garage with mud room, basement and wood deck.
-
2005-08-01historical
-
2005-02-03$64,900
ⓘ Source: listings_history table (triggers on properties + properties_extension) + one-shot
backfill from property_details.listing_events for pre-trigger history.
Tax reassessment forecast IN · Partial reset (capped growth)
- Current annual tax
- $458 · $38/mo
- Projected year-2 tax
- $866 · $72/mo
- Expected delta
- +$408/yr (+$34/mo · 89.1%)
ⓘ Screening estimate from a state-policy table — verify with the county assessor before closing.
Climate risk First Street
- Flood 1/10 Low FEMA zone X (unshaded) · 0% chance over 30 yrs
- Wildfire 1/10 Low
- Heat 3/10 Moderate 7 d/yr ≥101°F today · 18 d/yr by 30 yrs out
- Wind 2/10 Low 0% chance of damaging wind over 30 yrs
- Air quality 2/10 Low 1 unhealthy d/yr today · 2 by 30 yrs out
Nearby sold comps map
Loading sold comps map…
Walkable amenities ~0.75 mi
Loading nearby amenities…
Taxation est. · year 1
- Rental income
- $11,381
- − Mortgage interest
- −$8,397
- − Property taxes
- −$458
- − Insurance
- −$750
- − Repairs & maintenance
- −$911
- − Management
- −$911
- − Depreciation
- −$4,361
- Taxable loss
- −$4,405
- Est. tax savings @ 24.0%
- +$1,057
- After-tax cash flow
- $-592/yr
For passive investors: Depreciation is non-cash, so a rental often shows a tax loss while cash-flowing — sheltering income. Rental losses are passive: they offset passive income freely, and up to $25,000/yr can offset ordinary (W-2) income if you actively participate and your MAGI is under $100k (phasing out to $0 by $150k); unused losses carry forward. On sale, claimed depreciation is recaptured at up to 25%, and gains may owe capital-gains tax (a 1031 exchange can defer both). Figures are a year-1 estimate at your 24.0% rate — not tax advice; consult a CPA.
Schools (NCES district)
- District
- Crawfordsville Community Schools
- NCES district ID
- 1802460
- Math proficiency
- 27% ▼ -8.00%
- Reading proficiency
- 32% ▼ -6.00%
- Median HH income
- $39,087
- Composite
- 24.73/100
- National rank
- #7606
- State rank
- #247 of 301 in IN
Livability — Crawfordsville
- Score
- 72/100
- State rank
- #118
- US rank
- #6376
Category grades
Schools grade is shown separately in the Schools card above.
Census & demographics
- Census place
- Crawfordsville, IN
- County
- Montgomery County · 28,357 people
- City population
- 28,357
- Metro
- Crawfordsville, IN
- Population (ZIP)
- 28,357
- Household income
- $68,130
- Rent vs Own
- Severe rent burden
- 464.0
Population outlook (Montgomery County) Hauer SSP2
- Today (2025)
- 37,893 people
- By 2030
- 37,539 · -0.9%
- By 2040
- 36,536 · -3.6%
- By 2050
- 34,454 · -9.1%
- By 2075
- 28,852 · -23.9%
- By 2100
- 21,145 · -44.2%
Race, ethnicity, and origin ACS 2023
- Neighborhood character
- Predominantly White (88%)
- Race & ethnicity
- White 88% Hispanic / Latino 7% Two or more races 7%
- Hispanic origin (detail)
- Mexican 5% Puerto Rican 2%
- Common ancestry
- Slovak 2% Lithuanian 2% Romanian 2%
- Foreign-born
- 4% · Canada
- Languages at home
- 93% English-only · Spanish 6%
Political lean MEDSL · Montgomery
- 2024 margin
- Solid R (+48.2) · D 24.9% · R 73.2% · Other 1.9%
- 2008→2024 swing
- -28.3pp toward R · 2008: -19.9pp · 2024: -48.2pp
- All cycles
- 2024: R+48.2 2020: R+49.1 2016: R+50.9 2012: R+38.5 2008: R+19.9
Not yet ingested
- Civics
- —
Market trends
- HPI YoY
- ▼ -78.91%
- Current HPI
- 211.6864
- Rent YoY
- ▲ 3.28%
- Metro
- Crawfordsville, IN
- State GDP YoY
- ▲ 2.90%
- F500 in state
- 18
Industry mix (Fortune 500 HQ in IN)
| Industry | F500 HQs | Revenue |
|---|---|---|
| Industrial Machinery | 2 | $37B |
|
||
| Healthcare | 1 | $177B |
|
||
| Pharmaceuticals | 1 | $45B |
|
||
| Metals / Steel | 1 | $18B |
|
||
| Agriculture | 1 | $17B |
|
||
| Packaging | 1 | $12B |
|
||
Price history
+131.0% since first listed13 events — show timeline
- 2026-05-08 Pending — MIBOR as Distributed by MLS Grid
- 2026-05-06 Price Changed $149,900 MIBOR as Distributed by MLS Grid
- 2026-04-08 Price Changed $157,900 MIBOR as Distributed by MLS Grid
- 2026-03-24 Price Changed $159,900 MIBOR as Distributed by MLS Grid
- 2026-03-02 Price Changed $162,500 MIBOR as Distributed by MLS Grid
- 2026-02-23 Price Changed $167,500 MIBOR as Distributed by MLS Grid
- 2026-02-05 Price Changed $169,999 MIBOR as Distributed by MLS Grid
- 2026-01-28 Listed $173,500 MIBOR as Distributed by MLS Grid
- 2025-12-01 Listed $72,500 MIBOR as Distributed by MLS Grid
- 2006-06-28 Sold (MLS) $58,000 MIBOR as Distributed by MLS Grid
- 2005-08-25 Listed $63,000 MIBOR as Distributed by MLS Grid
- 2005-08-01 Listing Removed — MIBOR as Distributed by MLS Grid
- 2005-02-03 Listed $64,900 MIBOR as Distributed by MLS Grid
Property tax history
+103.4%/yrLatest (2025): $458 · +152.5% YoY. Source: county tax records.
Cash-flow waterfall
monthlySold comps — $/sqft
last 12 mo · ≤1 miLoading sold comps…