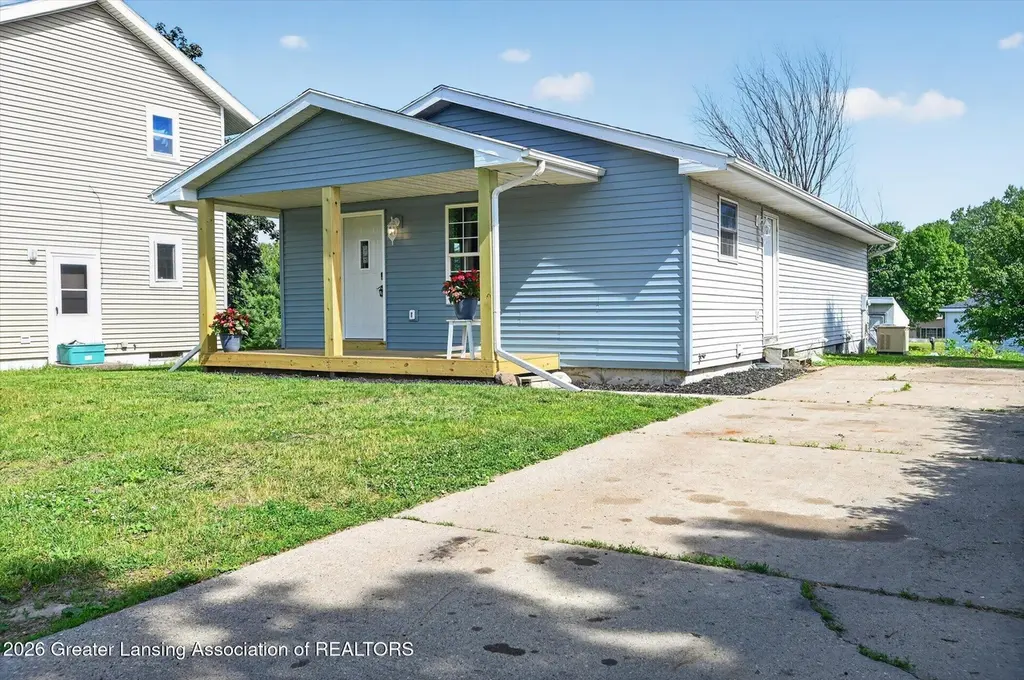
4240 Glenburne Blvd · Lansing, MI
Flood risk 1/10 · Minimal
- FEMA flood zone
- X (unshaded)
- Chance of flooding over 30 yrs
- 0.0%
- Est. flood insurance / yr
- $473 – $860
Fire risk 1/10 · Minimal
- Est. fire insurance / yr
- $784 – $1,456
Heat risk 2/10 · Minimal
- Hot days now (above 97°F)
- 7 days/yr
- Hot days in 30 yrs
- 16 days/yr
Wind risk 2/10 · Minimal
- Chance of severe wind over 30 yrs
- —
Air-quality risk 2/10 · Minimal
- Unhealthy air days now
- 1 days/yr
- Unhealthy air days in 30 yrs
- 2 days/yr
Risk factors via First Street. Map © Google.
Why this score? — see what drove the F grade
The composite is a weighted blend of 9 inputs, each scored 0–100. Each bar is that input's sub-score; the figure is the points it added to the 100-point composite (weight × sub-score).
- Cash flow +11.3/30.0
- Rent growth +5.0/5.0
- ARV discount +4.9/15.0
- Livability +4.0/5.0
- DSCR +3.3/10.0
- Condition / age +2.5/5.0
- 1% rule +2.0/10.0
- Schools +1.9/10.0
- Appreciation +0.0/10.0
$189,900
🖨 Deal sheet (PDF) 📄 Offer letter ✓ Due diligence
Listing remarks MLS
Welcome home to 4240 Glenburne Blvd. This move-in ready 4-bedroom, 1-bath ranch offers 1,104 square feet of updated first floor living space. Freshly painted throughout, the home features refinished kitchen cabinets, a new bathtub, first-floor laundry, and stainless steel appliances that are included. The full partially finished basement provides additional living space and includes a fourth bedroom with an egress window. Recent exterior updates include new front siding and a new layer of shingles installed in 2026. A storage shed is also included. With updates throughout and immediate occupancy available, this home is ready for its next owner.
Key facts
- New front siding
- First floor laundry
- New bathtub
Tags
Property features AI
Finance
- Other: Road frontage on a city street; Lot dimensions approximately 63 x 120.96 (0.16 acres); Views of the city; Subdivision: Glenburne; Directions: Please use GPS
Exterior
- Parking: Driveway and off-street parking (no garage)
- Utilities: 200+ amp electrical service with circuit breakers; Public sewer; Water, sewer, natural gas and electricity connected
- Home design: Ranch style; One story; Entry on first floor; Front of home faces south; City lot with front and back yard
- Construction: Vinyl siding; Shingle roof; Built in 2000; Other type of foundation
- Exterior features: Rain gutters; Deck; Front porch; Shed(s)
Interior
- Kitchen: Dishwasher; Gas range; Microwave; Refrigerator; Electric water heater
- Bedrooms: 4 bedrooms (all on the first floor/entry level)
- Flooring: Vinyl
- Bathrooms: 1 full bathroom
- Heating & cooling: Central air conditioning; Forced air heat (natural gas)
- Interior features: Ceiling fan(s); Daylight, egress windows, full and partially finished basement
- Laundry & utility: Washer hookup; Gas dryer hookup; Laundry in basement and main level
Neighborhood map
What this means for you Summary
Snapshot
- This is a 3-bed/1.0-bath single-family listed at $190k.
Deal economics
- At list price, monthly cash flow is $-70 ($-835/yr) — negative.
- To cash-flow at today's rent, offer at most $178k (6.5% below list).
- To meet the 1% rule (rent ≥ 1% of price), the offer needs to be $134k (29.7% below list).
- Recommended offer: $134k (29.7% below list) — sets the bar for 1% rule.
Location & tenants
- Location reads 79/100 on livability (#94 in MI, #2,182 nationally) — a middle-class / working-renter tenant base. Strengths: amenities A+, commute A+, cost of living A+; Watch: employment D, crime F.
- Lansing Public School District (urban): math 14% / reading 23% proficiency, ranked #650 of 760 in MI (top 86%) — low school quality limits family demand, transient renter base, plan for 1-2y turnover; 68% free/reduced lunch — lower-income household profile, screen leases tightly.
- Zoned schools: Cavanaugh School (315 students, 89% FRL); Attwood School (193 students, 88% FRL) — zoned schools average 88% FRL vs 68% district-wide (21 pts higher); higher-poverty schools than district average — tighter screening recommended.
- Market conditions: Rents rising fast (+9.9%/yr); 146 active listings in the ZIP; 8 comparable units currently listed for rent nearby; rentals at typical pace (median 23d on market — plan ~3-4 weeks tenant-placement turnaround); 98 units permitted in Eaton County in 2024 (0 in 5+ unit buildings).
Forward outlook
- Local home prices are declining (-3.0%/yr); year-one equity from $1k of loan paydown is wiped out by about $6k of value loss. Plan a longer hold.
- Eaton County population projected to shrink 5% by 2050 — rents likely to lag national; underwrite the cash flow, not the appreciation.
Negotiation context
- Only 13 days on market — expect competitive offers; lowballing is unlikely to land.
- 2 sale attempts; this cycle's ask has dropped $10k (5%) from the opening price — seller is motivated, your offer sets the floor, not the list.
Questions for the listing agent
- What do current leases actually rent for vs. the listed asking? Can we see a recent rent roll and the last 12 months of T-12 income?
- Is there a deadline driving the sale (1031 exchange, divorce, estate, relocation)? That informs how much negotiation room exists.
- Schools are F-rated, which usually means shorter tenancies and higher turnover. Who's the typical renter profile here, and what's been the actual vacancy rate?
- Crime grade is F in this area — have there been break-ins, vandalism, or insurance claims at this property in the last 3 years? What carrier currently insures it and at what premium?
- The area grade is low — what's the realistic commute time and amenity access for the typical tenant pool here? Any planned neighborhood developments (good or bad) we should know about?
- What's the average days-on-market for RENTAL listings here right now (not sales)? A rising rental-DOM trend means longer vacancies and softer asking-rent achievability than the comps imply.
- What's the recent tenant-quality profile in this submarket — average credit score on applications, eviction rate, late-payment / NSF rate, and stable-employment percentage? A property-management company in the area should have these aggregated.
- How much new for-sale + rental construction is in the pipeline within 1–3 miles? Heavy new supply typically softens prices + rents 12–24 months out; constrained supply supports both.
Investment metrics
- 1% rule
- 0.70% ✗
- Cap rate
- 5.85%
- Cash-on-cash
- -1.57%
- DSCR
- 0.93
- GRM
- 11.9
CMA / ARV
- ARV (on-the-fly)
- $179,400
- Comps found
- 12
Show comp detail 12 sales within ~0.75 mi
| Address | Dist | Beds/Ba | Sqft | Sold | Price | $/sf | Match |
|---|---|---|---|---|---|---|---|
| 4113 Heathgate Dr | 0.29mi | 3/1.0 | 1,323 (-4%) | 2mo | $165,000 | $125 | 78 |
| 4317 Seaway Dr | 0.16mi | 4/2.5 (+1) | 1,404 (+2%) | 5mo | $176,000 | $125 | 74 |
| 4130 Windward Dr | 0.33mi | 4/2.0 (+1) | 1,399 (+1%) | 2mo | $175,000 | $125 | 72 |
| 4123 Balmoral Dr | 0.08mi | 3/2.0 | 1,224 (-11%) | 5mo | $150,000 | $123 | 69 |
| 4340 Balmoral Dr | 0.16mi | 3/2.0 | 1,234 (-11%) | 8mo | $190,000 | $154 | 64 |
| 4131 Windward Dr | 0.30mi | 3/1.5 | 1,302 (-6%) | 16mo | $179,025 | $138 | 61 |
| 3725 Alpine Dr | 0.61mi | 3/1.5 | 1,480 (+7%) | 4mo | $144,000 | $97 | 54 |
| 3704 Maybel St | 0.65mi | 3/2.0 | 1,346 (-2%) | 10mo | $175,000 | $130 | 53 |
| 3921 Sheffield Blvd | 0.57mi | 3/1.5 | 1,302 (-6%) | 17mo | $183,000 | $141 | 48 |
| 3601 Sumpter St | 0.73mi | 3/1.5 | 1,504 (+9%) | 8mo | $170,000 | $113 | 43 |
| 4119 Thackin Dr | 0.58mi | 3/3.0 | 1,213 (-12%) | 10mo | $160,000 | $132 | 37 |
| 4001 Thackin Dr | 0.63mi | 3/1.5 | 1,213 (-12%) | 18mo | $170,000 | $140 | 33 |
Match score weights: distance 35% · size 25% · config 20% · recency 20%. Top-matched comps best support the ARV.
Projected returns pro-forma
-3.0% appreciation · 8.0% rent growth · sell at horizon
- IRR
- -14.3%
- Equity multiple
- 0.47×
- Total profit
- $-28,241
- Equity at exit
- $28,315
- IRR
- 0.3%
- Equity multiple
- 1.03×
- Total profit
- $1,433
- Equity at exit
- $16,419
Cash invested: $53,172 (down + closing). Projections, not guarantees.
Landlord ↔ Tenant lean methodology
- Overall (STATE)
- 62 Landlord-Friendly
- State Michigan
- 62 Landlord-Friendly · EVEN
- County
- — inherits STATE
- City
- — inherits STATE
ZIP-level market 48911
- Rents YoY
- 9.9%
- Active inventory
- 146
- Price-to-rent
- 11.9×
Monthly cashflow live
- Estimated rent
- $1,335 high interval (Pro) →
- Mortgage (P&I)
- −$996
- Tax from tax record
- −$49 /mo · $593/yr
- Insurance
- −$79
- HOA
- −$0
- Vacancy / Maint / Mgmt
- −$280
- Net cashflow
- $-70
Break-even live
Sensitivity live
| Price | -10% $38 | -5% $-16 | +0% $-70 | +5% $-123 | +10% $-177 |
|---|---|---|---|---|---|
| Rent | -10% $-175 | -5% $-122 | +0% $-70 | +5% $-17 | +10% $36 |
| Rate | -1.0pp $26 | -0.5pp $-21 | base $-70 | +0.5pp $-119 | +1.0pp $-169 |
UW: 25.0% down · 7.5% · 30yr · 1.5% tax · 5.0% vac · 8.0% maint · 8.0% mgmt
Financing live
Cash to close
- Down payment
- $47,475
- Closing costs
- $5,697
- Reserves months
- —
- Total cash needed
- —
Loan-product check · same deal, 3 products live
Conventional
25% down · 7.5% · 30yr
- Down + closing
- —
- Monthly P&I
- —
- Monthly cashflow
- —
- DSCR
- —
- Eligible?
- —
Personal DTI + credit; lowest rate.
DSCR
20% down · 8.5% · 30yr
- Down + closing
- —
- Monthly P&I
- —
- Monthly cashflow
- —
- DSCR
- —
- Eligible?
- —
No personal income docs; deal must DSCR.
Hard money
10% down · 12.0% · 12mo
- Down + closing
- —
- Monthly P&I
- —
- Monthly cashflow
- —
- DSCR
- —
- Eligible?
- —
Short-term bridge; refi at stabilization.
Rent comps 8 comps
| Address | Beds | Baths | Sqft | Rent | $/sqft | DOM | Units | Dist |
|---|---|---|---|---|---|---|---|---|
| 4245 W Jolly Rd Lansing, MI | 3.0 | 2.0 | 1216 | $1,199 | $0.99 | 15d | 1 | 0.69mi |
| 3530 W Jolly Rd Unit 6 Lansing, MI | 2.0 | 1.0 | 1049 | $1,100 | $1.05 | 23d | 1 | 0.84mi |
| 4106 Stillwell Ave Lansing, MI | 3.0 | 1.5 | 1127 | $2,100 | $1.86 | 23d | 1 | 0.85mi |
| 2920 Hillcrest St Lansing, MI | 3.0 | 1.0 | 1040 | $1,225 | $1.18 | 45d | 1 | 1.19mi |
| 2815 Mersey Ln Lansing, MI | 2.0–3.0 | 2.0 | 1050 | $1,325 | $1.26 | 15d | 2 | 1.19mi |
| 2823 Hillcrest St Lansing, MI | 3.0 | 1.0 | 925 | $1,245 | $1.35 | 23d | 1 | 1.24mi |
| 4125 Ingham St Lansing, MI | 3.0 | 1.0 | 933 | $1,300 | $1.39 | 45d | 1 | 1.30mi |
| 2612 Fielding Dr Lansing, MI | 2.0 | 1.0 | 1100 | $1,095 | $1.00 | 45d | 1 | 1.31mi |
Listing history 10 events
-
2026-06-21days on market $189,900 Active 13 DOM
-
2026-06-18days on market $189,900 Active 10 DOM
-
2026-06-17days on market $189,900 Active 9 DOM
-
2026-06-16days on market $189,900 Active 8 DOM
-
2026-06-15price $189,900 Active 7 DOM
-
2026-06-15days on market $199,900 Active 7 DOM
-
2026-06-14days on market $199,900 Active 5 DOM
-
2026-06-13days on market $199,900 Active 4 DOM
-
2026-06-10days on market $199,900 Active 2 DOM
-
2026-06-09$199,900 Active 1 DOM
ⓘ Source: listings_history table (triggers on properties + properties_extension) + one-shot
backfill from property_details.listing_events for pre-trigger history.
Tax reassessment forecast MI · Partial reset (capped growth)
- Current annual tax
- $593 · $49/mo
- Projected year-2 tax
- $1,759 · $147/mo
- Expected delta
- +$1,166/yr (+$97/mo · 196.6%)
ⓘ Screening estimate from a state-policy table — verify with the county assessor before closing.
Climate risk First Street
- Flood 1/10 Low FEMA zone X (unshaded) · 0% chance over 30 yrs
- Wildfire 1/10 Low
- Heat 2/10 Low 7 d/yr ≥97°F today · 16 d/yr by 30 yrs out
- Wind 2/10 Low
- Air quality 2/10 Low 1 unhealthy d/yr today · 2 by 30 yrs out
Nearby sold comps map
Loading sold comps map…
Walkable amenities ~0.75 mi
Loading nearby amenities…
Taxation est. · year 1
- Rental income
- $16,023
- − Mortgage interest
- −$10,637
- − Property taxes
- −$593
- − Insurance
- −$950
- − Repairs & maintenance
- −$1,282
- − Management
- −$1,282
- − Depreciation
- −$5,524
- Taxable loss
- −$4,245
- Est. tax savings @ 24.0%
- +$1,019
- After-tax cash flow
- $184/yr
For passive investors: Depreciation is non-cash, so a rental often shows a tax loss while cash-flowing — sheltering income. Rental losses are passive: they offset passive income freely, and up to $25,000/yr can offset ordinary (W-2) income if you actively participate and your MAGI is under $100k (phasing out to $0 by $150k); unused losses carry forward. On sale, claimed depreciation is recaptured at up to 25%, and gains may owe capital-gains tax (a 1031 exchange can defer both). Figures are a year-1 estimate at your 24.0% rate — not tax advice; consult a CPA.
Schools (NCES district)
- District
- Lansing Public School District
- NCES district ID
- 2621150
- Math proficiency
- 14% ▲ 1.00%
- Reading proficiency
- 23% ▲ 3.00%
- Median HH income
- $37,453
- Composite
- 18.76/100
- National rank
- #14002
- State rank
- #650 of 760 in MI
Livability — Lansing
- Score
- 79/100
- State rank
- #94
- US rank
- #2182
Category grades
Schools grade is shown separately in the Schools card above.
Census & demographics
- Census place
- Lansing, MI
- County
- Ingham County · 237,052 people
- City population
- 161,269
- Metro
- Lansing-East Lansing, MI
- Population (ZIP)
- 39,876
- Household income
- $56,631
- Rent vs Own
- Severe rent burden
- 2255.0
Population outlook (Eaton County) Hauer SSP2
- Today (2025)
- 110,811 people
- By 2030
- 110,598 · -0.2%
- By 2040
- 108,304 · -2.3%
- By 2050
- 104,961 · -5.3%
- By 2075
- 97,197 · -12.3%
- By 2100
- 85,150 · -23.2%
Race, ethnicity, and origin ACS 2023
- Neighborhood character
- Diverse neighborhood (Simpson 0.70)
- Race & ethnicity
- White 46% Black 26% Hispanic / Latino 14% Two or more races 10% Asian 8%
- Hispanic origin (detail)
- Mexican 10% Puerto Rican 1%
- Common ancestry
- Romanian 3% Slovak 2% Iranian 2%
- Foreign-born
- 12% · Canada, Vietnam, Philippines
- Languages at home
- 83% English-only · Spanish 5% Other Indo-European 3% Other Asian/Pacific 2%
Political lean MEDSL · Eaton
- 2024 margin
- Toss-up / Even · D 47.6% · R 50.8% · Other 1.6%
- 2008→2024 swing
- -11.6pp toward R · 2008: 8.4pp · 2024: -3.1pp
- All cycles
- 2024: R+3.1 2020: R+0.8 2016: R+5.5 2012: D+3.1 2008: D+8.4
Not yet ingested
- Civics
- —
Market trends
- HPI YoY
- ▼ -179.62%
- Current HPI
- 176.0632
- Rent YoY
- ▲ 9.90%
- Metro
- Lansing-East Lansing, MI
- State GDP YoY
- ▲ 1.37%
- F500 in state
- 28
Industry mix (Fortune 500 HQ in MI)
| Industry | F500 HQs | Revenue |
|---|---|---|
| Automotive Parts | 3 | $48B |
|
||
| Automotive | 2 | $372B |
|
||
| Chemicals | 1 | $45B |
|
||
| Automotive Retail | 1 | $29B |
|
||
| Healthcare / Medical Devices | 1 | $23B |
|
||
| Automotive Technology | 1 | $20B |
|
||
Price history
+0.0% since first listed2 events — show timeline
- 2026-06-08 Listed $199,900 REALCOMP
- 2026-06-08 Listed $199,900 Greater Lansing AoR
Property tax history
-9.5%/yrLatest (2025): $593 · -5.4% YoY. Source: county tax records.
Cash-flow waterfall
monthlySold comps — $/sqft
last 12 mo · ≤1 miLoading sold comps…