 🏷️ Likely Rental
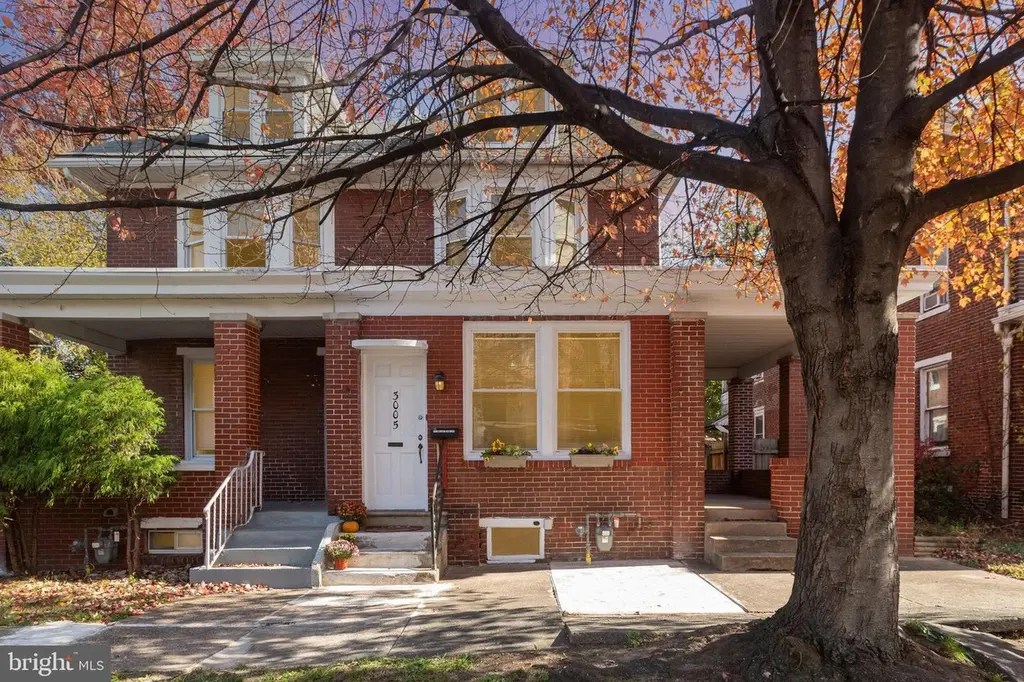
3005 N 3rd St · Harrisburg, PA
Flood risk 1/10 · Minimal
- FEMA flood zone
- X (unshaded)
- Chance of flooding over 30 yrs
- 0.0%
- Est. flood insurance / yr
- $473 – $860
Fire risk 1/10 · Minimal
- Est. fire insurance / yr
- $511 – $949
Heat risk 5/10 · Moderate
- Hot days now (above 101°F)
- 7 days/yr
- Hot days in 30 yrs
- 15 days/yr
Wind risk 3/10 · Minor
- Chance of severe wind over 30 yrs
- 5.0%
Air-quality risk 2/10 · Minimal
- Unhealthy air days now
- 1 days/yr
- Unhealthy air days in 30 yrs
- 3 days/yr
Risk factors via First Street. Map © Google.
Why this score? — see what drove the C- grade
The composite is a weighted blend of 9 inputs, each scored 0–100. Each bar is that input's sub-score; the figure is the points it added to the 100-point composite (weight × sub-score).
- Cash flow +16.9/30.0
- ARV discount +15.0/15.0
- DSCR +5.3/10.0
- 1% rule +4.7/10.0
- Livability +4.2/5.0
- Rent growth +2.9/5.0
- Condition / age +2.5/5.0
- Schools +0.8/10.0
- Appreciation +0.0/10.0
$184,900
🖨 Deal sheet 📄 Offer letter ✓ Due diligence
Listing remarks MLS
Two-unit property perfect for investor or owner occupant. Both one bedroom apartments have eat-in kitchens, large bedrooms, wood floors and are nice condition. First floor apartment vacant and ready for tenant or owner occupant. Upstairs apartment is occupied by long-term tenant, rent could be raised to $700. Replacement windows. Gas heat average just $137/month. Convenient Uptown location just 1 block to Italian Lake. Not in flood plain. Warranty. Let your tenant pay your mortgage.
Key facts
- Fenced in backyard
- Private back porch
- Natural light
Tags
Property features AI
Exterior
- Parking: On-street parking
- Utilities: Public water; Public sewer
- Home design: Semi-detached property; Fee simple ownership
- Construction: Brick construction; Permanent foundation; Above-grade finished area recorded by assessor
- Exterior features: Not in a federal flood zone; Above-grade and below-grade structures present
Interior
- Bedrooms: Two bedrooms on the first upper level
- Bathrooms: Two full bathrooms (all on upper levels)
- Heating & cooling: Steam heat; Natural gas heating fuel; Natural gas hot water
- Interior features: Two or more access exits
Neighborhood map
What this means for you Summary
Snapshot
- This is a 4-bed/2.0-bath single-family listed at $185k.
Deal economics
- At list price, monthly cash flow is $122 ($1k/yr) — positive.
- The deal already cash-flows at list — no discount required.
- To meet the 1% rule (rent ≥ 1% of price), the offer needs to be $179k (3.4% below list).
- Recommended offer: $179k (3.4% below list) — sets the bar for 1% rule.
Location & tenants
- Location reads 84/100 on livability (#107 in PA, #826 nationally) — a professional / high-income tenant draw. Strengths: amenities A+, commute A+, cost of living A+; Watch: schools C-, employment D, crime F.
- Harrisburg City SD (urban): math 6% / reading 13% proficiency, ranked #535 of 539 in PA (top 99%) — low school quality limits family demand, transient renter base, plan for 1-2y turnover; 82% free/reduced lunch — lower-income household profile, screen leases tightly.
- Market conditions: Rents rising (+1.6%/yr); 170 active listings in the ZIP; 20 comparable units currently listed for rent nearby; rentals lingering (median 44d on market — plan ~5-8 weeks vacancy on turnover, expect pricing pressure); 60% of comp listings sitting > 30 days — soft ceiling on asking rent; solid renter incomes; 540 units permitted in Dauphin County in 2024 (194 in 5+ unit buildings).
Forward outlook
- Local home prices are declining (-3.0%/yr); year-one equity from $1k of loan paydown is wiped out by about $6k of value loss. Plan a longer hold.
Negotiation context
- Only 5 days on market — expect competitive offers; lowballing is unlikely to land.
- 7 sale attempts since 16y ago with the ask held roughly flat each time — persistent listings suggest the price (not the market) is what's stuck; bring a comps-based counter.
- Current owner paid $94k; list at $185k implies a 96% gain — meaningful room to come down on a strong offer.
Risks & watch-outs
- Watch-outs: built in 1900 — expect roof / HVAC / electrical / plumbing capex.
- Climate carrying-cost: extreme-heat days projected 7→15/yr by 2055 (HVAC capex compounding) — expect insurance premiums to compound above CPI over the hold.
Questions for the listing agent
- Built in 1900 — when were the roof, HVAC, electrical panel, plumbing, and water heater last replaced?
- Is there a deadline driving the sale (1031 exchange, divorce, estate, relocation)? That informs how much negotiation room exists.
- Crime grade is F in this area — have there been break-ins, vandalism, or insurance claims at this property in the last 3 years? What carrier currently insures it and at what premium?
- What's the average days-on-market for RENTAL listings here right now (not sales)? A rising rental-DOM trend means longer vacancies and softer asking-rent achievability than the comps imply.
- What's the recent tenant-quality profile in this submarket — average credit score on applications, eviction rate, late-payment / NSF rate, and stable-employment percentage? A property-management company in the area should have these aggregated.
- How much new for-sale + rental construction is in the pipeline within 1–3 miles? Heavy new supply typically softens prices + rents 12–24 months out; constrained supply supports both.
Investment metrics
- 1% rule
- 0.97% ✗
- Cap rate
- 7.09%
- Cash-on-cash
- 2.84%
- DSCR
- 1.13
- GRM
- 8.6
CMA / ARV
- ARV (median comp)
- $238,506
- List price
- $184,900
- Delta
- -22.48%
- Verdict
- UNDERPRICED
- Comps
- 20 within 1.0 mi
Show comp detail 12 sales within ~0.75 mi
| Address | Dist | Beds/Ba | Sqft | Sold | Price | $/sf | Match |
|---|---|---|---|---|---|---|---|
| 2951 N 6th St | 0.28mi | 4/2.0 | 1,629 (+1%) | 7mo | $75,000 | $46 | 80 |
| 3122 N 5th St | 0.17mi | 3/1.0 (-1) | 1,527 (-5%) | 0mo | $205,000 | $134 | 74 |
| 3228 N 4th St | 0.26mi | 3/1.5 (-1) | 1,664 (+3%) | 6mo | $194,900 | $117 | 70 |
| 3135 N 5th St | 0.20mi | 3/2.0 (-1) | 1,733 (+8%) | 9mo | $275,000 | $159 | 66 |
| 2941 N 6th St | 0.30mi | 4/1.5 | 1,750 (+9%) | 5mo | $230,000 | $131 | 65 |
| 3205 N 5th St | 0.23mi | 3/2.0 (-1) | 1,500 (-7%) | 16mo | $252,000 | $168 | 60 |
| 2933 N 6th St | 0.32mi | 3/2.0 (-1) | 1,712 (+6%) | 17mo | $184,999 | $108 | 55 |
| 3116 Pennwood Rd | 0.27mi | 3/2.5 (-1) | 1,762 (+9%) | 14mo | $175,000 | $99 | 53 |
| 2430 N 5th St | 0.71mi | 3/1.0 (-1) | 1,600 (-1%) | 13mo | $95,000 | $59 | 46 |
| 3518 N 3rd St | 0.65mi | 4/1.5 | 1,823 (+13%) | 4mo | $266,000 | $146 | 43 |
| 3231 N 4th St | 0.26mi | 3/1.0 (-1) | 1,388 (-14%) | 18mo | $176,900 | $127 | 40 |
| 419 Schuylkill St | 0.69mi | 3/1.5 (-1) | 1,440 (-11%) | 16mo | $165,000 | $115 | 30 |
Match score weights: distance 35% · size 25% · config 20% · recency 20%. Top-matched comps best support the ARV.
Projected returns pro-forma
-3.0% appreciation · 1.55% rent growth · sell at horizon
- IRR
- -13.5%
- Equity multiple
- 0.52×
- Total profit
- $-24,698
- Equity at exit
- $27,569
- IRR
- -7.0%
- Equity multiple
- 0.58×
- Total profit
- $-21,568
- Equity at exit
- $15,987
Cash invested: $51,772 (down + closing). Projections, not guarantees.
Landlord ↔ Tenant lean methodology
- Overall (STATE)
- 62 Landlord-Friendly
- State Pennsylvania
- 62 Landlord-Friendly · EVEN
- County
- — inherits STATE
- City
- — inherits STATE
ZIP-level market 17110
- Rents YoY
- 1.6%
- Active inventory
- 170
- Price-to-rent
- 8.6×
Monthly cashflow live
- Estimated rent
- $1,787 high interval (Pro) →
- Mortgage (P&I)
- −$970
- Tax from tax record
- −$242 /mo · $2,910/yr
- Insurance
- −$77
- HOA
- −$0
- Vacancy / Maint / Mgmt
- −$375
- Net cashflow
- $122
Break-even live
UW: 25.0% down · 7.5% · 30yr · 1.5% tax · 5.0% vac · 8.0% maint · 8.0% mgmt
Financing live
Cash to close
- Down payment
- $46,225
- Closing costs
- $5,547
- Reserves months
- —
- Total cash needed
- —
Loan-product check · same deal, 3 products live
Conventional
25% down · 7.5% · 30yr
- Down + closing
- —
- Monthly P&I
- —
- Monthly cashflow
- —
- DSCR
- —
- Eligible?
- —
Personal DTI + credit; lowest rate.
DSCR
20% down · 8.5% · 30yr
- Down + closing
- —
- Monthly P&I
- —
- Monthly cashflow
- —
- DSCR
- —
- Eligible?
- —
No personal income docs; deal must DSCR.
Hard money
10% down · 12.0% · 12mo
- Down + closing
- —
- Monthly P&I
- —
- Monthly cashflow
- —
- DSCR
- —
- Eligible?
- —
Short-term bridge; refi at stabilization.
Rent comps 20 comps
| Address | Beds | Baths | Sqft | Rent | $/sqft | DOM | Units | Dist |
|---|---|---|---|---|---|---|---|---|
| 3216 Green St Harrisburg, PA | 4.0 | 2.0 | 1550 | $2,200 | $1.42 | 14d | 1 | 0.22mi |
| 2728 N 6th St Harrisburg, PA | 4.0 | 2.0 | 1786 | $1,750 | $0.98 | 14d | 1 | 0.43mi |
| 2801 N 2nd St Apt A2 Harrisburg, PA | 3.0 | 1.5 | 1200 | $1,495 | $1.25 | 43d | 1 | 0.46mi |
| 2715 N 6th St Harrisburg, PA | 4.0 | 1.0 | 1620 | $1,650 | $1.02 | 14d | 1 | 0.47mi |
| 514 Radnor St Harrisburg, PA | 4.0 | 1.0 | 1498 | $1,600 | $1.07 | 43d | 1 | 0.57mi |
| 2615 Waldo St Harrisburg, PA | 3.0 | 1.0 | 1400 | $1,095 | $0.78 | 43d | 1 | 0.61mi |
| 2406 Reel St Harrisburg, PA | 4.0 | 1.0 | 1500 | $1,395 | $0.93 | 43d | 1 | 0.81mi |
| 652 Emerald St Harrisburg, PA | 5.0 | 1.0 | 1550 | $1,740 | $1.12 | 43d | 1 | 0.95mi |
| 339 Emerald St Harrisburg, PA | 3.0 | 1.5 | 1420 | $1,650 | $1.16 | 14d | 1 | 0.96mi |
| 2235 Logan St Harrisburg, PA | 3.0 | 1.0 | 1406 | $1,495 | $1.06 | 43d | 1 | 1.00mi |
| 2153 Penn St Harrisburg, PA | 4.0 | 2.0 | 1620 | $1,995 | $1.23 | 43d | 1 | 1.13mi |
| 2118 N 4th St Harrisburg, PA | 4.0 | 1.0 | 1383 | $1,595 | $1.15 | 43d | 1 | 1.13mi |
| 320 Maclay St Harrisburg, PA | 3.0 | 2.5 | 2237 | $1,750 | $0.78 | 14d | 1 | 1.17mi |
| 2042 N 4th St Harrisburg, PA | 3.0 | 1.0 | 1090 | $1,400 | $1.28 | 43d | 1 | 1.21mi |
| 2032 Susquehanna St Harrisburg, PA | 4.0 | 1.5 | 1600 | $1,595 | $1.00 | 43d | 1 | 1.25mi |
| 1841 N 4th St Harrisburg, PA | 3.0 | 1.0 | 1376 | $1,399 | $1.02 | 23d | 1 | 1.37mi |
| 1841 N 3rd St Harrisburg, PA | 3.0 | 1.0 | 1376 | $1,399 | $1.02 | 14d | 1 | 1.40mi |
| 1834 Green St Harrisburg, PA | 4.0 | 1.0 | 1792 | $1,495 | $0.83 | 23d | 1 | 1.42mi |
| 640 Kelker St Harrisburg, PA | 3.0 | 1.0 | 1294 | $1,650 | $1.28 | 43d | 1 | 1.43mi |
| 644 Kelker St Harrisburg, PA | 3.0 | 1.0 | 1294 | $1,295 | $1.00 | 43d | 1 | 1.43mi |
Listing history 21 events
-
2026-05-05status Pending 980-char remark
-
2026-05-05status Pending 980-char remark
-
2026-04-30$184,900 Active 980-char remark
-
2026-04-15status Active 980-char remark
-
2026-03-31status Pending 980-char remark
-
2026-03-16status Active 980-char remark
-
2025-12-30status Pending 980-char remark
-
2025-11-13$184,900 Active 980-char remark
-
2016-09-27soldstatus $94,500
-
2016-09-16soldstatus $94,500
Show marketing remark (487 chars)
Two-unit property perfect for investor or owner occupant. Both one bedroom apartments have eat-in kitchens, large bedrooms, wood floors and are nice condition. First floor apartment vacant and ready for tenant or owner occupant. Upstairs apartment is occupied by long-term tenant, rent could be raised to $700. Replacement windows. Gas heat average just $137/month. Convenient Uptown location just 1 block to Italian Lake. Not in flood plain. Warranty. Let your tenant pay your mortgage.
-
2016-07-26historical
Show marketing remark (487 chars)
Two-unit property perfect for investor or owner occupant. Both one bedroom apartments have eat-in kitchens, large bedrooms, wood floors and are nice condition. First floor apartment vacant and ready for tenant or owner occupant. Upstairs apartment is occupied by long-term tenant, rent could be raised to $700. Replacement windows. Gas heat average just $137/month. Convenient Uptown location just 1 block to Italian Lake. Not in flood plain. Warranty. Let your tenant pay your mortgage.
-
2016-01-14$93,499
Show marketing remark (487 chars)
Two-unit property perfect for investor or owner occupant. Both one bedroom apartments have eat-in kitchens, large bedrooms, wood floors and are nice condition. First floor apartment vacant and ready for tenant or owner occupant. Upstairs apartment is occupied by long-term tenant, rent could be raised to $700. Replacement windows. Gas heat average just $137/month. Convenient Uptown location just 1 block to Italian Lake. Not in flood plain. Warranty. Let your tenant pay your mortgage.
-
2012-01-10soldstatus $80,000
-
2012-01-03soldstatus $80,000
-
2012-01-03soldstatus $80,000
-
2011-11-22historical
-
2011-11-22historical
-
2011-03-25$91,000
-
2010-12-06$91,000
-
1990-02-02soldstatus $47,000
-
1986-01-14soldstatus $32,500
ⓘ Source: listings_history table (triggers on properties + properties_extension) + one-shot
backfill from property_details.listing_events for pre-trigger history.
Tax reassessment forecast PA · Partial reset (capped growth)
- Current annual tax
- $2,910 · $242/mo
- Projected year-2 tax
- $2,916 · $243/mo
- Expected delta
- +$6/yr ($0/mo · 0.2%)
ⓘ Screening estimate from a state-policy table — verify with the county assessor before closing.
Climate risk First Street
- Flood 1/10 Low FEMA zone X (unshaded) · 0% chance over 30 yrs
- Wildfire 1/10 Low
- Heat 5/10 Major 7 d/yr ≥101°F today · 15 d/yr by 30 yrs out
- Wind 3/10 Moderate 5% chance of damaging wind over 30 yrs
- Air quality 2/10 Low 1 unhealthy d/yr today · 3 by 30 yrs out
Nearby sold comps map
Loading sold comps map…
Walkable amenities ~0.75 mi
Loading nearby amenities…
Taxation est. · year 1
- Rental income
- $21,442
- − Mortgage interest
- −$10,357
- − Property taxes
- −$2,910
- − Insurance
- −$924
- − Repairs & maintenance
- −$1,715
- − Management
- −$1,715
- − Depreciation
- −$5,379
- Taxable loss
- −$1,559
- Est. tax savings @ 24.0%
- +$374
- After-tax cash flow
- $1,844/yr
For passive investors: Depreciation is non-cash, so a rental often shows a tax loss while cash-flowing — sheltering income. Rental losses are passive: they offset passive income freely, and up to $25,000/yr can offset ordinary (W-2) income if you actively participate and your MAGI is under $100k (phasing out to $0 by $150k); unused losses carry forward. On sale, claimed depreciation is recaptured at up to 25%, and gains may owe capital-gains tax (a 1031 exchange can defer both). Figures are a year-1 estimate at your 24.0% rate — not tax advice; consult a CPA.
Schools (NCES district)
- District
- Harrisburg City SD
- NCES district ID
- 4211580
- Math proficiency
- 6% ▼ -6.00%
- Reading proficiency
- 13% ▼ -10.00%
- Median HH income
- $33,432
- Composite
- 7.6/100
- National rank
- #9945
- State rank
- #535 of 539 in PA
Livability — Harrisburg
- Score
- 84/100
- State rank
- #107
- US rank
- #826
Category grades
Schools grade is shown separately in the Schools card above.
Census & demographics
- Census place
- Harrisburg, PA
- County
- Dauphin County · 247,857 people
- City population
- 184,296
- Metro
- Harrisburg-Carlisle, PA
- Population (ZIP)
- 27,364
- Household income
- $80,699
- Rent vs Own
- Severe rent burden
- 1037.0
Population outlook (Dauphin County) Hauer SSP2
- Today (2025)
- 281,628 people
- By 2030
- 283,549 · +0.7%
- By 2040
- 285,385 · +1.3%
- By 2050
- 286,188 · +1.6%
- By 2075
- 291,053 · +3.3%
- By 2100
- 282,374 · +0.3%
Race, ethnicity, and origin ACS 2023
- Neighborhood character
- Diverse neighborhood (Simpson 0.66)
- Race & ethnicity
- White 47% Black 32% Hispanic / Latino 9% Asian 7% Two or more races 6%
- Hispanic origin (detail)
- Puerto Rican 6% Dominican 1%
- Common ancestry
- Italian 3% Romanian 2% Slovak 1%
- Foreign-born
- 8% · Canada, India, Vietnam
- Languages at home
- 88% English-only · Spanish 6% Other Indo-European 2% Vietnamese 1%
Political lean MEDSL · Dauphin
- 2024 margin
- Lean D (+5.9) · D 52.4% · R 46.5% · Other 1.1%
- 2008→2024 swing
- -3.1pp toward R · 2008: 9.1pp · 2024: 5.9pp
- All cycles
- 2024: D+5.9 2020: D+8.5 2016: D+2.8 2012: D+6.0 2008: D+9.1
Not yet ingested
- Civics
- —
Market trends
- HPI YoY
- ▼ -144.07%
- Current HPI
- 257.826
- Rent YoY
- ▲ 1.55%
- Metro
- Harrisburg-Carlisle, PA
- State GDP YoY
- ▲ 1.68%
- F500 in state
- 34
Industry mix (Fortune 500 HQ in PA)
| Industry | F500 HQs | Revenue |
|---|---|---|
| Healthcare | 2 | $309B |
|
||
| Insurance | 2 | $27B |
|
||
| Telecommunications / Media | 1 | $124B |
|
||
| Industrial Distribution | 1 | $22B |
|
||
| Financial Services | 1 | $20B |
|
||
| Chemicals / Materials | 1 | $18B |
|
||
Price history
+468.9% since first listed23 events — show timeline
- 2026-05-05 Pending — BRIGHT MLS
- 2026-05-05 Pending — BRIGHT MLS
- 2026-05-05 Listing Removed — BRIGHT MLS
- 2026-05-05 Listing Removed — BRIGHT MLS
- 2026-04-30 Listed $184,900 BRIGHT MLS
- 2026-04-15 Relisted — BRIGHT MLS
- 2026-03-31 Pending — BRIGHT MLS
- 2026-03-16 Relisted — BRIGHT MLS
- 2025-12-30 Pending — BRIGHT MLS
- 2025-11-13 Listed $184,900 BRIGHT MLS
- 2016-09-27 Sold (Public Records) $94,500 Public Records
- 2016-09-16 Sold (MLS) $94,500 BRIGHT MLS
- 2016-07-26 Listing Removed — BRIGHT MLS
- 2016-01-14 Listed $93,499 BRIGHT MLS
- 2012-01-10 Sold (Public Records) $80,000 Public Records
- 2012-01-03 Sold (MLS) $80,000 BRIGHT MLS
- 2012-01-03 Sold (MLS) $80,000 BRIGHT MLS
- 2011-11-22 Listing Removed — BRIGHT MLS
- 2011-11-22 Listing Removed — BRIGHT MLS
- 2011-03-25 Listed $91,000 BRIGHT MLS
- 2010-12-06 Listed $91,000 BRIGHT MLS
- 1990-02-02 Sold (Public Records) $47,000 Public Records
- 1986-01-14 Sold (Public Records) $32,500 Public Records
Property tax history
+1.0%/yrLatest (2026): $2,910 · +1.7% YoY. Source: county tax records.
Cash-flow waterfall
monthlySold comps — $/sqft
last 12 mo · ≤1 miLoading sold comps…