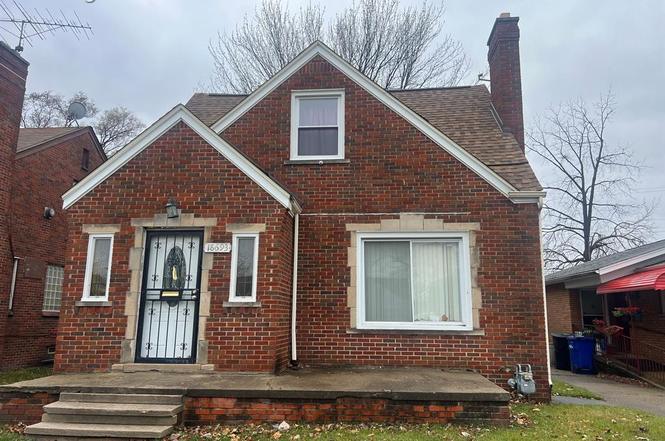
18693 Whitcomb St · Detroit, MI
Flood risk 3/10 · Minor
- FEMA flood zone
- X (unshaded)
- Chance of flooding over 30 yrs
- 0.2%
- Est. flood insurance / yr
- $473 – $860
Fire risk 1/10 · Minimal
- Est. fire insurance / yr
- $784 – $1,456
Heat risk 3/10 · Minor
- Hot days now (above 98°F)
- 7 days/yr
- Hot days in 30 yrs
- 15 days/yr
Wind risk 2/10 · Minimal
- Chance of severe wind over 30 yrs
- —
Air-quality risk 3/10 · Minor
- Unhealthy air days now
- 2 days/yr
- Unhealthy air days in 30 yrs
- 5 days/yr
Risk factors via First Street. Map © Google.
Why this score? — see what drove the C grade
The composite is a weighted blend of 9 inputs, each scored 0–100. Each bar is that input's sub-score; the figure is the points it added to the 100-point composite (weight × sub-score).
- Cash flow +21.5/30.0
- ARV discount +10.2/15.0
- 1% rule +7.7/10.0
- DSCR +6.9/10.0
- Livability +3.7/5.0
- Rent growth +3.3/5.0
- Condition / age +2.5/5.0
- Schools +1.3/10.0
- Appreciation +0.0/10.0
$119,000
🖨 Deal sheet (PDF) 📄 Offer letter ✓ Due diligence
Listing remarks
Beautiful and well-maintained 4-bedroom, 2 full-bath brick bungalow located in a desirable neighborhood of similar brick homes. This solid home offers excellent curb appeal, a spacious living room with a cozy fireplace, a formal dining room, and a finished basement providing additional living and entertaining space. Move-in ready and waiting for its next owner. Sold AS- IS. Pre-approved buyers only. Buyers agent must accompany all showings.
Key facts
- 0.25 acre lot
- Built 1941
- Listed 3 days
Property features AI
Finance
- Other: Has home warranty
- Financial info:
- HOA & community:
Exterior
- Parking:
- Security:
- Utilities: Public water; Public sewer (assumed via public utilities); Electric service (standard)
- Home design: Residential 1 1/2-story home; Built in 1941
- Construction: Brick construction; Basement foundation
- Exterior features: Brick exterior; Paved street frontage; Frontage of 40 feet; Lot size approximately 0.25 acre
Interior
- Kitchen: Kitchen on entry level — 11 x 10, ceramic flooring; Dining room on entry level — 12 x 11
- Bedrooms: Bedroom 1 (Entry level) — 13 x 10, carpet; Bedroom 2 (Second level) — 18 x 12, carpet; Bedroom 3 (Second level) — approx. 11 wide, carpet; Bedroom 4 (Entry level) — 10 x 10, carpet
- Flooring: Carpet in bedrooms; Wood flooring in living room; Ceramic tile in bathrooms and kitchen
- Bathrooms: Three total bathrooms/lavatories; Two full bathrooms; One lavatory; Bathroom on second level with ceramic flooring (approx. 7 x 7); Bathroom on entry level with ceramic flooring (approx. 8 x 7); Basement lavatory with ceramic flooring (approx. 6 x 6)
- Heating & cooling: Forced air heating; Natural gas heating fuel
- Interior features: Total of 10 rooms; Finished basement
- Laundry & utility: Basement space available (finished) — could accommodate laundry/utility
Neighborhood map
What this means for you Summary
Snapshot
- This is a 4-bed/1.0-bath single-family listed at $119k.
Deal economics
- At list price, monthly cash flow is $178 ($2k/yr) — positive.
- The deal already cash-flows at list — no discount required.
- Meets the 1% rule at list price ($2k rent vs $119k).
Location & tenants
- Location reads 73/100 on livability (#218 in MI) — a middle-class / working-renter tenant base. Strengths: amenities A+, commute A+, cost of living A+; Watch: schools F, crime F, employment F.
- Detroit Public Schools Community District (urban): math 10% / reading 24% proficiency, ranked #499 of 540 in MI (top 92%) — low school quality limits family demand, transient renter base, plan for 1-2y turnover; 90% free/reduced lunch — lower-income household profile, screen leases tightly.
- Market conditions: Rents rising (+3.2%/yr); 290 active listings in the ZIP; 35 comparable units currently listed for rent nearby; rentals at typical pace (median 18d on market — plan ~3-4 weeks tenant-placement turnaround); lower-income renter base — watch delinquency; 2,639 units permitted in Wayne County in 2024 (1,216 in 5+ unit buildings).
- At $1,513/mo this rent would consume 46% of the median local household income ($39k/yr) (locally 3064% of renters already pay >50% of income on rent) — very limited rent-growth headroom before tenants either downsize or default.
Forward outlook
- Local home prices are declining (-3.0%/yr); year-one equity from $823 of loan paydown is wiped out by about $4k of value loss. Plan a longer hold.
- Wayne County population projected at -17% by 2050 — secular population decline; favor cash flow + early exit over multi-decade hold.
Negotiation context
- Only 4 days on market — expect competitive offers; lowballing is unlikely to land.
- 7 sale attempts since 20y ago; this cycle's ask has dropped $11k (8%) from the opening price — seller is motivated, your offer sets the floor, not the list.
- Current owner paid $97k; 22% above their basis — modest negotiation headroom, anchor on the comps not their cost.
Risks & watch-outs
- Watch-outs: property tax is 3.5% of price; built in 1941 — expect roof / HVAC / electrical / plumbing capex.
Questions for the listing agent
- Built in 1941 — when were the roof, HVAC, electrical panel, plumbing, and water heater last replaced?
- Property tax is high relative to price — has the assessment been appealed recently, and will the sale trigger a re-assessment?
- Is there a deadline driving the sale (1031 exchange, divorce, estate, relocation)? That informs how much negotiation room exists.
- Schools are F-rated, which usually means shorter tenancies and higher turnover. Who's the typical renter profile here, and what's been the actual vacancy rate?
- Crime grade is F in this area — have there been break-ins, vandalism, or insurance claims at this property in the last 3 years? What carrier currently insures it and at what premium?
- What's the average days-on-market for RENTAL listings here right now (not sales)? A rising rental-DOM trend means longer vacancies and softer asking-rent achievability than the comps imply.
- What's the recent tenant-quality profile in this submarket — average credit score on applications, eviction rate, late-payment / NSF rate, and stable-employment percentage? A property-management company in the area should have these aggregated.
- How much new for-sale + rental construction is in the pipeline within 1–3 miles? Heavy new supply typically softens prices + rents 12–24 months out; constrained supply supports both.
Investment metrics
- 1% rule
- 1.27% ✓
- Cap rate
- 8.09%
- Cash-on-cash
- 6.42%
- DSCR
- 1.29
- GRM
- 6.6
CMA / ARV
- ARV (on-the-fly)
- $126,600
- Comps found
- 12
Show comp detail 12 sales within ~0.75 mi
| Address | Dist | Beds/Ba | Sqft | Sold | Price | $/sf | Match |
|---|---|---|---|---|---|---|---|
| 18982 Coyle St | 0.20mi | 3/1.0 (-1) | 1,328 (+5%) | 3mo | $132,300 | $100 | 75 |
| 18477 Prevost St | 0.36mi | 3/2.0 (-1) | 1,234 (-2%) | 2mo | $163,695 | $133 | 68 |
| 18052 Prevost St | 0.53mi | 3/1.5 (-1) | 1,270 (+0%) | 5mo | $90,000 | $71 | 64 |
| 19477 Prest St | 0.49mi | 3/2.0 (-1) | 1,300 (+3%) | 1mo | $173,000 | $133 | 63 |
| 19336 Forrer St | 0.43mi | 3/1.0 (-1) | 1,200 (-5%) | 6mo | $85,000 | $71 | 61 |
| 19412 Sussex St | 0.44mi | 3/1.0 (-1) | 1,170 (-8%) | 2mo | $93,000 | $79 | 61 |
| 18990 Prevost St | 0.33mi | 3/1.0 (-1) | 1,124 (-11%) | 6mo | $71,300 | $63 | 56 |
| 19180 Murray Hill St | 0.58mi | 3/1.0 (-1) | 1,200 (-5%) | 6mo | $57,000 | $48 | 54 |
| 19134 Montrose St | 0.28mi | 3/2.0 (-1) | 1,430 (+13%) | 4mo | $163,000 | $114 | 53 |
| 18239 Saint Marys St | 0.59mi | 3/1.0 (-1) | 1,136 (-10%) | 1mo | $124,900 | $110 | 49 |
| 19338 Murray Hill St | 0.63mi | 3/1.5 (-1) | 1,400 (+11%) | 1mo | $176,500 | $126 | 45 |
| 18476 Mark Twain St | 0.55mi | 3/1.0 (-1) | 1,089 (-14%) | 8mo | $71,000 | $65 | 40 |
Match score weights: distance 35% · size 25% · config 20% · recency 20%. Top-matched comps best support the ARV.
Projected returns pro-forma
-3.0% appreciation · 3.25% rent growth · sell at horizon
- IRR
- -6.0%
- Equity multiple
- 0.78×
- Total profit
- $-7,398
- Equity at exit
- $17,743
- IRR
- 4.2%
- Equity multiple
- 1.31×
- Total profit
- $10,339
- Equity at exit
- $10,289
Cash invested: $33,320 (down + closing). Projections, not guarantees.
Landlord ↔ Tenant lean methodology
- Overall (STATE)
- 62 Landlord-Friendly
- State Michigan
- 62 Landlord-Friendly · EVEN
- County
- — inherits STATE
- City
- — inherits STATE
ZIP-level market 48235
- Rents YoY
- 3.2%
- Active inventory
- 290
- Price-to-rent
- 6.6×
Monthly cashflow live
- Estimated rent
- $1,513 high interval (Pro) →
- Mortgage (P&I)
- −$624
- Tax from tax record
- −$343 /mo · $4,119/yr
- Insurance
- −$50
- HOA
- −$0
- Vacancy / Maint / Mgmt
- −$318
- Net cashflow
- $178
Break-even live
Sensitivity live
| Price | -10% $246 | -5% $212 | +0% $178 | +5% $145 | +10% $111 |
|---|---|---|---|---|---|
| Rent | -10% $59 | -5% $119 | +0% $178 | +5% $238 | +10% $298 |
| Rate | -1.0pp $238 | -0.5pp $209 | base $178 | +0.5pp $148 | +1.0pp $116 |
UW: 25.0% down · 7.5% · 30yr · 1.5% tax · 5.0% vac · 8.0% maint · 8.0% mgmt
Financing live
Cash to close
- Down payment
- $29,750
- Closing costs
- $3,570
- Reserves months
- —
- Total cash needed
- —
Loan-product check · same deal, 3 products live
Conventional
25% down · 7.5% · 30yr
- Down + closing
- —
- Monthly P&I
- —
- Monthly cashflow
- —
- DSCR
- —
- Eligible?
- —
Personal DTI + credit; lowest rate.
DSCR
20% down · 8.5% · 30yr
- Down + closing
- —
- Monthly P&I
- —
- Monthly cashflow
- —
- DSCR
- —
- Eligible?
- —
No personal income docs; deal must DSCR.
Hard money
10% down · 12.0% · 12mo
- Down + closing
- —
- Monthly P&I
- —
- Monthly cashflow
- —
- DSCR
- —
- Eligible?
- —
Short-term bridge; refi at stabilization.
Rent comps 35 comps
| Address | Beds | Baths | Sqft | Rent | $/sqft | DOM | Units | Dist |
|---|---|---|---|---|---|---|---|---|
| 18481 Prest St Detroit, MI | 3.0 | 1.5 | 1100 | $1,300 | $1.18 | 20d | 1 | 0.13mi |
| 18964 Coyle St Detroit, MI | 3.0 | 1.0 | 1300 | $1,350 | $1.04 | 4d | 1 | 0.21mi |
| 18675 Forrer St Detroit, MI | 3.0 | 1.0 | 1200 | $1,225 | $1.02 | 6d | 1 | 0.25mi |
| 18400 Rutherford St Detroit, MI | 3.0 | 1.0 | 1050 | $1,400 | $1.33 | 5d | 1 | 0.40mi |
| 18257 Mark Twain St Detroit, MI | 3.0 | 1.0 | 1185 | $1,507 | $1.27 | 18d | 1 | 0.58mi |
| 19440 Rutherford St Detroit, MI | 3.0 | 1.0 | 1000 | $1,400 | $1.40 | 25d | 1 | 0.58mi |
| 19467 Rutherford St Detroit, MI | 3.0 | 1.0 | 1002 | $1,200 | $1.20 | 18d | 1 | 0.62mi |
| 19503 Mansfield St Detroit, MI | 3.0 | 1.0 | 1200 | $1,350 | $1.12 | 18d | 1 | 0.68mi |
| 17573 Asbury Park Detroit, MI | 3.0 | 2.0 | 990 | $1,400 | $1.41 | 0d | 1 | 0.78mi |
| 17165 Prevost St Detroit, MI | 3.0 | 1.0 | 1060 | $2,400 | $2.26 | 3d | 1 | 0.82mi |
| 18010 Lesure St Detroit, MI | 3.0 | 1.0 | 1010 | $1,500 | $1.49 | 0d | 1 | 0.90mi |
| 16837 Winthrop St Detroit, MI | 5.0 | 2.0 | 1500 | $2,000 | $1.33 | 21d | 1 | 0.93mi |
| 19400 Harlow St Detroit, MI | 4.0 | 1.0 | 1298 | $1,275 | $0.98 | 18d | 1 | 1.00mi |
| 20042 Freeland St Detroit, MI | 3.0 | 1.5 | 1445 | $1,300 | $0.90 | 0d | 1 | 1.02mi |
| 18494 Ashton Ave Detroit, MI | 3.0 | 1.0 | 1000 | $1,600 | $1.60 | 18d | 1 | 1.13mi |
| 20210 Biltmore St Detroit, MI | 3.0 | 1.0 | 1033 | $1,350 | $1.31 | 25d | 1 | 1.17mi |
| 19818 Fenmore St Detroit, MI | 3.0 | 1.0 | 902 | $1,275 | $1.41 | 45d | 1 | 1.21mi |
| 20203 Gilchrist St Detroit, MI | 3.0 | 1.0 | 1031 | $1,250 | $1.21 | 6d | 1 | 1.22mi |
| 16876 Harlow Ave Unit (NO) Detroit, MI | 3.0 | 1.0 | 1250 | $1,350 | $1.08 | 45d | 1 | 1.26mi |
| 19918 Southfield Fwy Detroit, MI | 3.0 | 1.0 | 915 | $1,375 | $1.50 | 16d | 1 | 1.27mi |
| 20314 Gilchrist St Detroit, MI | 3.0 | 1.0 | 1042 | $1,500 | $1.44 | 6d | 1 | 1.28mi |
| 16151 Robson St Detroit, MI | 3.0 | 1.0 | 1300 | $1,525 | $1.17 | 16d | 1 | 1.28mi |
| 16535 Asbury Park Detroit, MI | 3.0 | 1.5 | 1152 | $1,450 | $1.26 | 25d | 1 | 1.31mi |
| 20043 Fenmore St Detroit, MI | 3.0 | 1.0 | 1030 | $1,423 | $1.38 | 0d | 1 | 1.33mi |
| 20259 Oakfield St Detroit, MI | 3.0 | 1.0 | 1056 | $1,250 | $1.18 | 18d | 1 | 1.33mi |
| 20426 Tracey St Detroit, MI | 3.0 | 1.0 | 1200 | $1,200 | $1.00 | 25d | 1 | 1.34mi |
| 16505 Stansbury St Detroit, MI | 3.0 | 1.0 | 1700 | $1,345 | $0.79 | 45d | 1 | 1.35mi |
| 16505 Stansbury St Detroit, MI | 3.0 | 1.0 | 1100 | $1,250 | $1.14 | 12d | 1 | 1.35mi |
| 16210 Ferguson St Detroit, MI | 4.0 | 2.0 | 1493 | $1,750 | $1.17 | 5d | 1 | 1.37mi |
| 19970 Ashton Ave Detroit, MI | 3.0 | 1.0 | 1000 | $1,000 | $1.00 | 45d | 1 | 1.39mi |
| 17654 Greenview Ave Detroit, MI | 4.0 | 1.0 | 1377 | $1,350 | $0.98 | 18d | 1 | 1.44mi |
| 15866 Mansfield St Detroit, MI | 3.0 | 1.0 | 1324 | $1,425 | $1.08 | 25d | 1 | 1.44mi |
| 15810 Robson St Detroit, MI | 3.0 | 1.0 | 1142 | $1,500 | $1.31 | 25d | 1 | 1.45mi |
| 20510 Fenmore St Detroit, MI | 3.0 | 1.0 | 1194 | $1,300 | $1.09 | 3d | 1 | 1.46mi |
| 20200 Ashton Ave Detroit, MI | 3.0 | 1.0 | 1200 | $1,200 | $1.00 | 18d | 1 | 1.47mi |
Listing history 7 events
-
2026-06-21days on market $119,000 Active 4 DOM
-
2026-06-19remarks 444-char remark
-
2026-06-18statusdays on market $119,000 Active 1 DOM
-
2026-06-17days on market $119,000 Coming Soon 3 DOM
-
2026-06-16days on market $119,000 Coming Soon 2 DOM
-
2026-06-15remarks 432-char remark
-
2026-06-15$119,000 Coming Soon 1 DOM
ⓘ Source: listings_history table (triggers on properties + properties_extension) + one-shot
backfill from property_details.listing_events for pre-trigger history.
Tax reassessment forecast MI · Partial reset (capped growth)
- Current annual tax
- $4,119 · $343/mo
- Projected year-2 tax
- $4,119 · $343/mo
- Expected delta
- $0/yr ($0/mo · 0.0%)
ⓘ Screening estimate from a state-policy table — verify with the county assessor before closing.
Climate risk First Street
- Flood 3/10 Moderate FEMA zone X (unshaded) · 20% chance over 30 yrs
- Wildfire 1/10 Low
- Heat 3/10 Moderate 7 d/yr ≥98°F today · 15 d/yr by 30 yrs out
- Wind 2/10 Low
- Air quality 3/10 Moderate 2 unhealthy d/yr today · 5 by 30 yrs out
Nearby sold comps map
Loading sold comps map…
Walkable amenities ~0.75 mi
Loading nearby amenities…
Taxation est. · year 1
- Rental income
- $18,156
- − Mortgage interest
- −$6,666
- − Property taxes
- −$4,119
- − Insurance
- −$595
- − Repairs & maintenance
- −$1,452
- − Management
- −$1,452
- − Depreciation
- −$3,462
- Taxable income
- $409
- Est. tax owed @ 24.0%
- −$98
- After-tax cash flow
- $2,042/yr
For passive investors: Depreciation is non-cash, so a rental often shows a tax loss while cash-flowing — sheltering income. Rental losses are passive: they offset passive income freely, and up to $25,000/yr can offset ordinary (W-2) income if you actively participate and your MAGI is under $100k (phasing out to $0 by $150k); unused losses carry forward. On sale, claimed depreciation is recaptured at up to 25%, and gains may owe capital-gains tax (a 1031 exchange can defer both). Figures are a year-1 estimate at your 24.0% rate — not tax advice; consult a CPA.
Schools (NCES district)
- District
- Detroit Public Schools Community District
- NCES district ID
- 2601103
- Math proficiency
- 10% ▼ -2.00%
- Reading proficiency
- 24% ▲ 6.00%
- Median HH income
- $25,815
- Composite
- 13.06/100
- National rank
- #9564
- State rank
- #499 of 540 in MI
Livability — Detroit
- Score
- 73/100
- State rank
- #218
- US rank
- #5427
Category grades
Schools grade is shown separately in the Schools card above.
Census & demographics
- Census place
- Detroit, MI
- County
- Wayne County · 1,562,939 people
- City population
- 572,865
- Metro
- Detroit-Warren-Dearborn, MI
- Population (ZIP)
- 45,600
- Household income
- $39,265
- Rent vs Own
- Severe rent burden
- 3064.0
Population outlook (Wayne County) Hauer SSP2
- Today (2025)
- 1,675,273 people
- By 2030
- 1,620,300 · -3.3%
- By 2040
- 1,502,341 · -10.3%
- By 2050
- 1,384,039 · -17.4%
- By 2075
- 1,124,592 · -32.9%
- By 2100
- 881,193 · -47.4%
Race, ethnicity, and origin ACS 2023
- Neighborhood character
- Predominantly Black (94%)
- Race & ethnicity
- Black 94% White 3% Two or more races 2% Hispanic / Latino 1%
- Foreign-born
- 1% · Canada
- Languages at home
- 98% English-only · Spanish 1%
Political lean MEDSL · Wayne
- 2024 margin
- Strong D (+29.0) · D 62.7% · R 33.7% · Other 3.6%
- 2008→2024 swing
- -20.5pp toward R · 2008: 49.5pp · 2024: 29.0pp
- All cycles
- 2024: D+29.0 2020: D+38.1 2016: D+37.3 2012: D+46.9 2008: D+49.5
Not yet ingested
- Civics
- —
Market trends
- HPI YoY
- ▼ -153.02%
- Current HPI
- 263.6326
- Rent YoY
- ▲ 3.25%
- Metro
- Detroit-Warren-Dearborn, MI
- State GDP YoY
- ▲ 1.37%
- F500 in state
- 28
Industry mix (Fortune 500 HQ in MI)
| Industry | F500 HQs | Revenue |
|---|---|---|
| Automotive Parts | 3 | $48B |
|
||
| Automotive | 2 | $372B |
|
||
| Chemicals | 1 | $45B |
|
||
| Automotive Retail | 1 | $29B |
|
||
| Healthcare / Medical Devices | 1 | $23B |
|
||
| Automotive Technology | 1 | $20B |
|
||
Price history
+548.5% since first listed19 events — show timeline
- 2026-06-15 Coming Soon $119,000 MiRealSource-MiMLS
- 2025-03-20 Listing Removed — REALCOMP
- 2025-03-20 Listing Removed — MiRealSource-MiMLS
- 2024-12-17 Listed $129,900 MiRealSource-MiMLS
- 2024-12-17 Listed $129,900 REALCOMP
- 2024-12-10 Coming Soon — MiRealSource-MiMLS
- 2024-12-10 Coming Soon — REALCOMP
- 2011-02-27 Listing Removed — REALCOMP
- 2011-02-27 Listing Removed — MiRealSource-MiMLS
- 2010-08-27 Listed $7,525 REALCOMP
- 2010-08-27 Listed $7,525 MiRealSource-MiMLS
- 2010-03-10 Listing Removed — REALCOMP
- 2009-09-30 Listed $30,000 REALCOMP
- 2008-08-15 Sold (Public Records) $97,300 Public Records
- 2008-01-18 Sold (MLS) $7,525 REALCOMP
- 2007-11-09 Listed $59,900 REALCOMP
- 2007-04-11 Listing Removed — REALCOMP
- 2006-10-17 Listed $59,900 REALCOMP
- 1993-08-27 Sold (Public Records) $18,351 Public Records
Property tax history
+29.5%/yrLatest (2025): $4,119 · +0.6% YoY. Source: county tax records.
Cash-flow waterfall
monthlySold comps — $/sqft
last 12 mo · ≤1 miLoading sold comps…