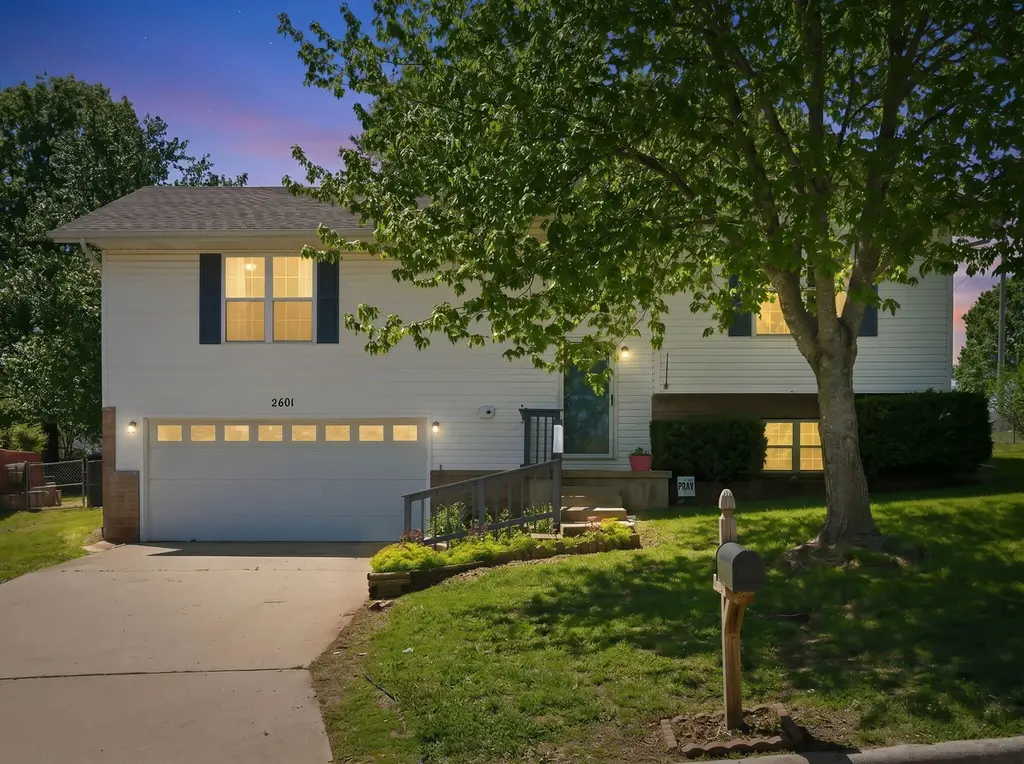
2601 S 14th St · Ozark, MO
Flood risk 1/10 · Minimal
- FEMA flood zone
- X (unshaded)
- Chance of flooding over 30 yrs
- 0.0%
- Est. flood insurance / yr
- $473 – $860
Fire risk 3/10 · Minor
- Est. fire insurance / yr
- $1,054 – $1,958
Heat risk 5/10 · Moderate
- Hot days now (above 104°F)
- 7 days/yr
- Hot days in 30 yrs
- 19 days/yr
Wind risk 2/10 · Minimal
- Chance of severe wind over 30 yrs
- —
Air-quality risk 1/10 · Minimal
- Unhealthy air days now
- 0 days/yr
- Unhealthy air days in 30 yrs
- 0 days/yr
Risk factors via First Street. Map © Google.
Why this score? — see what drove the D grade
The composite is a weighted blend of 9 inputs, each scored 0–100. Each bar is that input's sub-score; the figure is the points it added to the 100-point composite (weight × sub-score).
- Cash flow +12.0/30.0
- ARV discount +7.5/15.0
- Schools +5.2/10.0
- Rent growth +3.8/5.0
- DSCR +3.6/10.0
- Livability +3.6/5.0
- Condition / age +2.5/5.0
- 1% rule +2.4/10.0
- Appreciation +0.0/10.0
$244,777
🖨 Deal sheet (PDF) 📄 Offer letter ✓ Due diligence
Listing remarks
Welcome to this spacious 4 bedroom, 3 bath split level home in the desirable Oak Hill Estates subdivision in Ozark. Built in 1996 and sitting on a generous quarter acre lot, this two story home offers a functional layout with plenty of room to spread out. Inside you will find two living areas and an open floor plan that flows seamlessly into the kitchen and dining space, with direct access to the back deck and fenced yard, perfect for entertaining or relaxing. The primary suite features a full bath with a walk in shower, while the additional bedrooms offer comfortable space for family or guests. The fourth bedroom is non conforming, making it a great option for an office, hobby room, or fle
Key facts
- Open floor plan
- Fenced yard
- Two living areas
Tags
Neighborhood map
What this means for you Summary
Snapshot
- This is a 4-bed/3.0-bath other listed at $245k.
Deal economics
- At list price, monthly cash flow is $-58 ($-693/yr) — negative.
- To cash-flow at today's rent, offer at most $235k (4.2% below list).
- To meet the 1% rule (rent ≥ 1% of price), the offer needs to be $182k (25.8% below list).
- Recommended offer: $182k (25.8% below list) — sets the bar for 1% rule.
- Cap rate 6.0% vs local median 2.8% in Ozark — top-decile yield for the area; either an underpriced asset or a hidden risk that comps aren't pricing in. Stress-test before assuming the spread holds.
Location & tenants
- Location reads 72/100 on livability (#94 in MO) — a middle-class / working-renter tenant base. Strengths: crime A+, cost of living A+, housing A+; Watch: amenities F, commute F, health & safety F.
- Ozark R-VI (rural): math 60% / reading 62% proficiency, ranked #10 of 324 in MO (top 3%) — acceptable for families but not a draw, mixed tenant base, ~2y average lease.
- Zoned schools: South Elem. (math 59% / reading 63%, grade B, #114 of 1,115 statewide, top 10%, 524 students, 44% FRL); Ozark Jr. High (math 54% / reading 59%, grade B, #38 of 391 statewide, top 10%, 946 students, 37% FRL); Ozark High (math 47% / reading 64%, grade C, #64 of 521 statewide, top 12%, 1,838 students, 33% FRL).
- Market conditions: Rents rising fast (+5.3%/yr); 381 active listings in the ZIP; 4 comparable units currently listed for rent nearby; rentals at typical pace (median 25d on market — plan ~3-4 weeks tenant-placement turnaround); solid renter incomes; 537 units permitted in Christian County in 2024 (0 in 5+ unit buildings).
Forward outlook
- Local home prices are declining (-3.0%/yr); year-one equity from $2k of loan paydown is wiped out by about $7k of value loss. Plan a longer hold.
- Christian County population projected at +24% by 2050 — long-run rental-demand tailwind backs the buy-and-hold thesis.
Negotiation context
- Only 4 days on market — expect competitive offers; lowballing is unlikely to land.
- 4 sale attempts since 2y ago with the ask held roughly flat each time — persistent listings suggest the price (not the market) is what's stuck; bring a comps-based counter.
Risks & watch-outs
- Climate carrying-cost: extreme-heat days projected 7→19/yr by 2055 (HVAC capex compounding) — expect insurance premiums to compound above CPI over the hold.
Questions for the listing agent
- What do current leases actually rent for vs. the listed asking? Can we see a recent rent roll and the last 12 months of T-12 income?
- Is there a deadline driving the sale (1031 exchange, divorce, estate, relocation)? That informs how much negotiation room exists.
- Schools are B-rated — typically a magnet for longer-tenancy family renters. What's the average tenant stay here, and is there a school-zone premium baked into asking?
- The area grade is low — what's the realistic commute time and amenity access for the typical tenant pool here? Any planned neighborhood developments (good or bad) we should know about?
- What's the average days-on-market for RENTAL listings here right now (not sales)? A rising rental-DOM trend means longer vacancies and softer asking-rent achievability than the comps imply.
- What's the recent tenant-quality profile in this submarket — average credit score on applications, eviction rate, late-payment / NSF rate, and stable-employment percentage? A property-management company in the area should have these aggregated.
- How much new for-sale + rental construction is in the pipeline within 1–3 miles? Heavy new supply typically softens prices + rents 12–24 months out; constrained supply supports both.
Investment metrics
- 1% rule
- 0.74% ✗
- Cap rate
- 6.01%
- Cash-on-cash
- -1.01%
- DSCR
- 0.96
- GRM
- 11.2
CMA / ARV
No comps found within radius.
Projected returns pro-forma
-3.0% appreciation · 5.34% rent growth · sell at horizon
- IRR
- -15.7%
- Equity multiple
- 0.43×
- Total profit
- $-39,060
- Equity at exit
- $36,497
- IRR
- -4.1%
- Equity multiple
- 0.70×
- Total profit
- $-20,289
- Equity at exit
- $21,164
Cash invested: $68,538 (down + closing). Projections, not guarantees.
Landlord ↔ Tenant lean methodology
- Overall (STATE)
- 81 Strongly Landlord-Friendly
- State Missouri
- 81 Strongly Landlord-Friendly · R+10
- County
- — inherits STATE
- City
- — inherits STATE
ZIP-level market 65721
- Rents YoY
- 5.3%
- Active inventory
- 381
- Price-to-rent
- 11.2×
Monthly cashflow live
- Estimated rent
- $1,817 medium interval (Pro) →
- Mortgage (P&I)
- −$1,284
- Tax from tax record
- −$107 /mo · $1,290/yr
- Insurance
- −$102
- HOA
- −$0
- Vacancy / Maint / Mgmt
- −$382
- Net cashflow
- $-58
Break-even live
Sensitivity live
| Price | -10% $81 | -5% $12 | +0% $-58 | +5% $-127 | +10% $-196 |
|---|---|---|---|---|---|
| Rent | -10% $-201 | -5% $-130 | +0% $-58 | +5% $14 | +10% $86 |
| Rate | -1.0pp $66 | -0.5pp $4 | base $-58 | +0.5pp $-121 | +1.0pp $-186 |
UW: 25.0% down · 7.5% · 30yr · 1.5% tax · 5.0% vac · 8.0% maint · 8.0% mgmt
Financing live
Cash to close
- Down payment
- $61,194
- Closing costs
- $7,343
- Reserves months
- —
- Total cash needed
- —
Loan-product check · same deal, 3 products live
Conventional
25% down · 7.5% · 30yr
- Down + closing
- —
- Monthly P&I
- —
- Monthly cashflow
- —
- DSCR
- —
- Eligible?
- —
Personal DTI + credit; lowest rate.
DSCR
20% down · 8.5% · 30yr
- Down + closing
- —
- Monthly P&I
- —
- Monthly cashflow
- —
- DSCR
- —
- Eligible?
- —
No personal income docs; deal must DSCR.
Hard money
10% down · 12.0% · 12mo
- Down + closing
- —
- Monthly P&I
- —
- Monthly cashflow
- —
- DSCR
- —
- Eligible?
- —
Short-term bridge; refi at stabilization.
Rent comps 4 comps
| Address | Beds | Baths | Sqft | Rent | $/sqft | DOM | Units | Dist |
|---|---|---|---|---|---|---|---|---|
| 1352 W Kirkwood St Ozark, MO | 3.0 | 2.0 | 1500 | $1,695 | $1.13 | 15d | 1 | 0.76mi |
| 1431 S Treetop Ct Ozark, MO | 3.0 | 2.0 | 1362 | $1,795 | $1.32 | 25d | 1 | 0.79mi |
| 1420 S Treetop Ct Ozark, MO | 3.0 | 2.0 | 1484 | $1,625 | $1.10 | 25d | 1 | 0.84mi |
| 707 E Watermill Cir Ozark, MO | 3.0 | 2.0 | 1300 | $1,495 | $1.15 | 15d | 1 | 0.94mi |
Listing history 12 events
-
2026-04-26status Pending
-
2026-04-22$244,777 Active
-
2025-01-10price $264,900
-
2024-12-06$269,900 Active
-
2024-09-06$279,000 Active
-
2024-09-04historical
-
2024-08-24price $278,500
-
2024-07-03price $279,500
-
2024-06-01price $299,500
-
2024-05-12price $304,900
-
2024-05-04$312,900 Active
-
2020-03-09soldstatus
ⓘ Source: listings_history table (triggers on properties + properties_extension) + one-shot
backfill from property_details.listing_events for pre-trigger history.
Tax reassessment forecast MO · Resets to sale price
- Current annual tax
- $1,290 · $107/mo
- Projected year-2 tax
- $2,374 · $198/mo
- Expected delta
- +$1,085/yr (+$90/mo · 84.1%)
ⓘ Screening estimate from a state-policy table — verify with the county assessor before closing.
Climate risk First Street
- Flood 1/10 Low FEMA zone X (unshaded) · 0% chance over 30 yrs
- Wildfire 3/10 Moderate
- Heat 5/10 Major 7 d/yr ≥104°F today · 19 d/yr by 30 yrs out
- Wind 2/10 Low
- Air quality 1/10 Low 0 unhealthy d/yr today · 0 by 30 yrs out
Nearby sold comps map
Loading sold comps map…
Walkable amenities ~0.75 mi
Loading nearby amenities…
Taxation est. · year 1
- Rental income
- $21,803
- − Mortgage interest
- −$13,711
- − Property taxes
- −$1,290
- − Insurance
- −$1,224
- − Repairs & maintenance
- −$1,744
- − Management
- −$1,744
- − Depreciation
- −$7,121
- Taxable loss
- −$5,031
- Est. tax savings @ 24.0%
- +$1,208
- After-tax cash flow
- $514/yr
For passive investors: Depreciation is non-cash, so a rental often shows a tax loss while cash-flowing — sheltering income. Rental losses are passive: they offset passive income freely, and up to $25,000/yr can offset ordinary (W-2) income if you actively participate and your MAGI is under $100k (phasing out to $0 by $150k); unused losses carry forward. On sale, claimed depreciation is recaptured at up to 25%, and gains may owe capital-gains tax (a 1031 exchange can defer both). Figures are a year-1 estimate at your 24.0% rate — not tax advice; consult a CPA.
Schools (NCES district)
- District
- Ozark R-VI
- NCES district ID
- 2923430
- Math proficiency
- 60% ▼ -1.00%
- Reading proficiency
- 62% ▼ -3.00%
- Median HH income
- $54,408
- Composite
- 52.33/100
- National rank
- #1590
- State rank
- #10 of 324 in MO
Livability — Ozark
- Score
- 72/100
- State rank
- #94
- US rank
- #6242
Category grades
Schools grade is shown separately in the Schools card above.
Census & demographics
- Census place
- Ozark, MO
- County
- Christian County · 70,465 people
- City population
- 33,452
- Metro
- Springfield, MO
- Population (ZIP)
- 33,452
- Household income
- $77,507
- Rent vs Own
- Severe rent burden
- 673.0
Population outlook (Christian County) Hauer SSP2
- Today (2025)
- 95,071 people
- By 2030
- 100,379 · +5.6%
- By 2040
- 109,902 · +15.6%
- By 2050
- 117,487 · +23.6%
- By 2075
- 130,738 · +37.5%
- By 2100
- 131,730 · +38.6%
Race, ethnicity, and origin ACS 2023
- Neighborhood character
- Predominantly White (91%)
- Race & ethnicity
- White 91% Two or more races 5% Hispanic / Latino 4%
- Common ancestry
- Italian 3% Slovak 2% Portuguese 2%
- Foreign-born
- 3% · Canada
- Languages at home
- 95% English-only · Spanish 3% Other Indo-European 1% Russian/Polish/Slavic 1%
Political lean MEDSL · Christian
- 2024 margin
- Solid R (+52.2) · D 23.3% · R 75.6% · Other 1.1%
- 2008→2024 swing
- -16.4pp toward R · 2008: -35.8pp · 2024: -52.2pp
- All cycles
- 2024: R+52.2 2020: R+50.8 2016: R+54.2 2012: R+46.5 2008: R+35.8
Not yet ingested
- Civics
- —
Market trends
- HPI YoY
- ▼ -103.28%
- Current HPI
- 188.699
- Rent YoY
- ▲ 5.34%
- Metro
- Springfield, MO
- State GDP YoY
- ▲ 1.84%
- F500 in state
- 20
Industry mix (Fortune 500 HQ in MO)
| Industry | F500 HQs | Revenue |
|---|---|---|
| Healthcare | 1 | $163B |
|
||
| Insurance | 1 | $21B |
|
||
| Industrial Technology | 1 | $17B |
|
||
| Retail | 1 | $16B |
|
||
| Industrial Distribution | 1 | $10B |
|
||
| Utilities | 1 | $9B |
|
||
Price history
-21.8% since first listed12 events — show timeline
- 2026-04-26 Pending — SOMO
- 2026-04-22 Listed $244,777 SOMO
- 2025-01-10 Price Changed $264,900 SOMO
- 2024-12-06 Listed $269,900 SOMO
- 2024-09-06 Listed $279,000 SOMO
- 2024-09-04 Delisted — SOMO
- 2024-08-24 Price Changed $278,500 SOMO
- 2024-07-03 Price Changed $279,500 SOMO
- 2024-06-01 Price Changed $299,500 SOMO
- 2024-05-12 Price Changed $304,900 SOMO
- 2024-05-04 Listed $312,900 SOMO
- 2020-03-09 Sold (Public Records) — Public Records
Property tax history
+2.0%/yrLatest (2025): $1,290 · -8.0% YoY. Source: county tax records.
Cash-flow waterfall
monthlySold comps — $/sqft
last 12 mo · ≤1 miLoading sold comps…