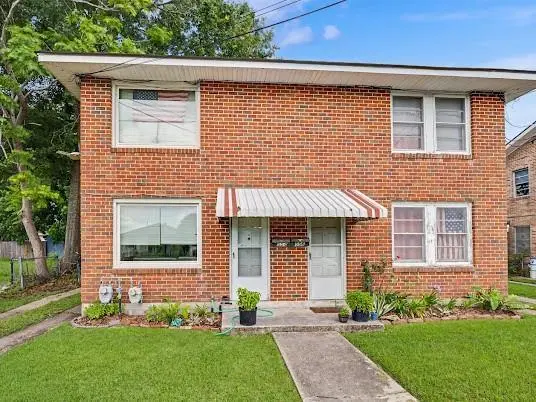
 Duplex
554-556 Carrollton Ave · Metairie, LA
Flood risk 8/10 · Major
- FEMA flood zone
- AE
- Chance of flooding over 30 yrs
- 0.77%
- Est. flood insurance / yr
- $1,737 – $8,500
Fire risk 1/10 · Minimal
- Est. fire insurance / yr
- $1,269 – $2,357
Heat risk 10/10 · Severe
- Hot days now (above 108°F)
- 7 days/yr
- Hot days in 30 yrs
- 21 days/yr
Wind risk 10/10 · Severe
- Chance of severe wind over 30 yrs
- 99.0%
Air-quality risk 4/10 · Minor
- Unhealthy air days now
- 4 days/yr
- Unhealthy air days in 30 yrs
- 4 days/yr
Risk factors via First Street. Map © Google.
Why this score? — see what drove the C+ grade
The composite is a weighted blend of 9 inputs, each scored 0–100. Each bar is that input's sub-score; the figure is the points it added to the 100-point composite (weight × sub-score).
- Cash flow +21.6/30.0
- ARV discount +15.0/15.0
- DSCR +6.9/10.0
- 1% rule +4.9/10.0
- Livability +4.4/5.0
- Schools +2.5/10.0
- Condition / age +2.5/5.0
- Rent growth +2.4/5.0
- Appreciation +0.0/10.0
$349,000
🖨 Deal sheet (PDF) 📄 Offer letter ✓ Due diligence
Multi-family units
County records classify this as Multi-Family (2-4 Unit). Listing-text estimate: 2 units. confirmed
Listing remarks MLS
Opportunity awaits with this duplex located in a well established Metairie neighborhood. Featuring an up and down unit configuration with approximately 1,843 square feet of living area, the property offers a combined total of 4 bedrooms and 2 baths, along with a 2 car garage, 2 car carport and covered porch. Whether you're looking to add to your investment portfolio, owner occupy one unit while generating rental income from the other or renovate and maximize its potential, this property offers plenty of possibilities. Situated on a 5,529 square foot lot with convenient access to shopping, dining, schools and major roadways, the location is hard to beat. Property is being sold as-is, giving the next owner the opportunity to make improvements and updates to suit their needs. Don't miss the chance to bring new life to this income producing property in the heart of Metairie.
Key facts
- Covered porch
- Heart of metairie
- 529 square foot lot
Tags
Property features AI
Finance
- Financial info: Multifamily with 2 total units; Tenants are responsible for electricity, gas, and water
Exterior
- Parking: Covered garage with two spaces
- Utilities: Public water; Public sewer
- Home design: 2-story building; Brick and frame construction; Slab foundation; Shingle roof
- Construction: Built with brick and frame materials; Shingle roof; Slab foundation
- Exterior features: Porch; Rectangular lot; Outside city limits
Interior
- Bedrooms: 2-unit property (multifamily)
- Bathrooms: 2 full bathrooms (total)
- Heating & cooling: Ductless heating; Wall furnace; Window cooling units
- Interior features: Average condition; Porch
- Laundry & utility: Tenants pay electricity, gas, and water
Neighborhood map
What this means for you Summary
Snapshot
- This is a 2 × 2-bed/1.0-bath units multifamily listed at $349k.
Deal economics
- At list price, monthly cash flow is $101 ($1k/yr) — positive. Per door: $50/mo.
- The deal already cash-flows at list — no discount required.
- To meet the 1% rule (rent ≥ 1% of price), the offer needs to be $346k (0.9% below list).
- Recommended offer: $346k (0.9% below list) — sets the bar for 1% rule.
- Cap rate 8.1% vs local median 3.6% in Metairie — top-decile yield for the area; either an underpriced asset or a hidden risk that comps aren't pricing in. Stress-test before assuming the spread holds.
Location & tenants
- Location reads 87/100 on livability (#1 in LA, #261 nationally) — a professional / high-income tenant draw. Strengths: commute A+, housing A+, health & safety A+.
- Jefferson Parish (suburban): math 24% / reading 34% proficiency, ranked #44 of 98 in LA (top 45%) — low school quality limits family demand, transient renter base, plan for 1-2y turnover; 70% free/reduced lunch — lower-income household profile, screen leases tightly.
- Zoned schools: Marie B. Riviere Elementary School (math 33% / reading 33%, grade F, #297 of 646 statewide, top 46%, 612 students, 52% FRL); J.D. Meisler Middle School (math 13% / reading 28%, grade F, #161 of 218 statewide, top 76%, 753 students, 50% FRL); Riverdale High School (math 36% / reading 52%, grade F, #62 of 265 statewide, top 23%, 1,019 students, 50% FRL) — zoned schools average 51% FRL vs 70% district-wide (19 pts lower); this property's tenant base skews higher-income than the district average.
- Market conditions: Rents soft (-0.3%/yr); 178 active listings in the ZIP; 40 comparable units currently listed for rent nearby; rentals at typical pace (median 22d on market — plan ~3-4 weeks tenant-placement turnaround); solid renter incomes; 518 units permitted in Jefferson Parish in 2024 (43 in 5+ unit buildings).
- At $3,460/mo this rent would consume 47% of the median local household income ($89k/yr) (locally 711% of renters already pay >50% of income on rent) — very limited rent-growth headroom before tenants either downsize or default.
Forward outlook
- Local home prices are declining (-3.0%/yr); year-one equity from $2k of loan paydown is wiped out by about $10k of value loss. Plan a longer hold.
Negotiation context
- Only 12 days on market — expect competitive offers; lowballing is unlikely to land.
- 2 sale attempts with the ask held roughly flat each time — persistent listings suggest the price (not the market) is what's stuck; bring a comps-based counter.
Risks & watch-outs
- Watch-outs: flood insurance adds $427/mo; built in 1950 — expect roof / HVAC / electrical / plumbing capex.
- Climate carrying-cost: in FEMA flood zone AE (mandatory federal flood insurance); severe wind risk, 99% chance of damaging wind over 30y; extreme-heat days projected 7→21/yr by 2055 (HVAC capex compounding) — expect insurance premiums to compound above CPI over the hold.
Questions for the listing agent
- Can we see the unit-by-unit rent roll, current vacancy, and any below-market leases? What's the average tenancy length?
- What capital expenditures (roof, boiler, parking lot, exteriors) have been made in the last 5 years, and what's planned in the next 2?
- Built in 1950 — when were the roof, HVAC, electrical panel, plumbing, and water heater last replaced?
- What's the actual annual flood-insurance premium (NFIP or private), and is the property in a SFHA with mandatory coverage?
- Is there a deadline driving the sale (1031 exchange, divorce, estate, relocation)? That informs how much negotiation room exists.
- Schools are B-rated — typically a magnet for longer-tenancy family renters. What's the average tenant stay here, and is there a school-zone premium baked into asking?
- What's the average days-on-market for RENTAL listings here right now (not sales)? A rising rental-DOM trend means longer vacancies and softer asking-rent achievability than the comps imply.
- What's the recent tenant-quality profile in this submarket — average credit score on applications, eviction rate, late-payment / NSF rate, and stable-employment percentage? A property-management company in the area should have these aggregated.
- How much new apartment / multifamily construction is in the pipeline within 1–3 miles? Heavy new supply (>2% of stock underway) typically softens rents 12–24 months out; light construction supports rent growth.
Investment metrics
- 1% rule
- 0.99% ✗
- Cap rate
- 8.11%
- Cash-on-cash
- 6.47%
- DSCR
- 1.29
- GRM
- 8.4
CMA / ARV
- ARV (on-the-fly)
- $442,320
- Comps found
- 6
Show comp detail 6 sales within ~0.75 mi
| Address | Dist | Beds/Ba | Sqft | Sold | Price | $/sf | Match |
|---|---|---|---|---|---|---|---|
| 343 45 Aris Ave | 0.22mi | 4/2.0 | 1,799 (-2%) | 6mo | $310,000 | $172 | 81 |
| 431-33 Nursery Ave | 0.08mi | 4/2.0 | 1,580 (-14%) | 6mo | $325,000 | $206 | 68 |
| 504 06 Nursery Ave | 0.12mi | 5/4.0 (+1) | 1,993 (+8%) | 2mo | $560,000 | $281 | 66 |
| 200-202 Pink St | 0.42mi | 5/2.0 (+1) | 1,792 (-3%) | 8mo | $430,000 | $240 | 64 |
| 346 Carrollton Ave | 0.43mi | 4/2.0 | 1,625 (-12%) | 14mo | $485,000 | $298 | 49 |
| 231-233 14th St | 0.72mi | 5/4.5 (+1) | 1,958 (+6%) | 11mo | $425,000 | $217 | 32 |
Match score weights: distance 35% · size 25% · config 20% · recency 20%. Top-matched comps best support the ARV.
Projected returns pro-forma
-3.0% appreciation · 0.0% rent growth · sell at horizon
- IRR
- -18.0%
- Equity multiple
- 0.39×
- Total profit
- $-60,091
- Equity at exit
- $52,037
- IRR
- -18.3%
- Equity multiple
- 0.16×
- Total profit
- $-82,491
- Equity at exit
- $30,175
Cash invested: $97,720 (down + closing). Projections, not guarantees.
Landlord ↔ Tenant lean methodology
- Overall (STATE)
- 90 Strongly Landlord-Friendly
- State Louisiana
- 90 Strongly Landlord-Friendly · R+12
- County
- — inherits STATE
- City
- — inherits STATE
ZIP-level market 70005
- Rents YoY
- -0.3%
- Active inventory
- 178
- Price-to-rent
- 16.8×
Monthly cashflow live
- Estimated rent
- $3,460 high interval (Pro) →
- Mortgage (P&I)
- −$1,830
- Tax from tax record
- −$231 /mo · $2,767/yr
- Insurance
- −$145
- Flood insurance flood zone
- −$427 /mo · $5,118/yr
- HOA
- −$0
- Vacancy / Maint / Mgmt
- −$727
- Net cashflow
- $101
Break-even live
Sensitivity live
| Price | -10% $298 | -5% $199 | +0% $101 | +5% $2 | +10% $-97 |
|---|---|---|---|---|---|
| Rent | -10% $-173 | -5% $-36 | +0% $101 | +5% $237 | +10% $374 |
| Rate | -1.0pp $276 | -0.5pp $189 | base $101 | +0.5pp $10 | +1.0pp $-82 |
2-unit breakdown (identical units grouped — click to expand)
| Units | Beds | Baths | Est. rent |
|---|---|---|---|
| 2× units | 2 | 1 | $3,460 |
| #1 | 2 | 1 | $1,730 |
| #2 | 2 | 1 | $1,730 |
| Total (2 units) | $3,460 | ||
UW: 25.0% down · 7.5% · 30yr · 1.5% tax · 5.0% vac · 8.0% maint · 8.0% mgmt
Financing live
Cash to close
- Down payment
- $87,250
- Closing costs
- $10,470
- Reserves months
- —
- Total cash needed
- —
Loan-product check · same deal, 3 products live
Conventional
25% down · 7.5% · 30yr
- Down + closing
- —
- Monthly P&I
- —
- Monthly cashflow
- —
- DSCR
- —
- Eligible?
- —
Personal DTI + credit; lowest rate.
DSCR
20% down · 8.5% · 30yr
- Down + closing
- —
- Monthly P&I
- —
- Monthly cashflow
- —
- DSCR
- —
- Eligible?
- —
No personal income docs; deal must DSCR.
Hard money
10% down · 12.0% · 12mo
- Down + closing
- —
- Monthly P&I
- —
- Monthly cashflow
- —
- DSCR
- —
- Eligible?
- —
Short-term bridge; refi at stabilization.
Rent comps 40 comps
| Address | Beds | Baths | Sqft | Rent | $/sqft | DOM | Units | Dist |
|---|---|---|---|---|---|---|---|---|
| 504 Nursery Ave Metairie, LA | 3.0 | 2.0 | 1267 | $2,500 | $1.97 | 16d | 1 | 0.15mi |
| 375 Aris Ave Metairie, LA | 4.0 | 2.0 | 1480 | $2,100 | $1.42 | 25d | 1 | 0.19mi |
| 517 Rosa Ave Metairie, LA | 3.0 | 2.0 | 1900 | $2,100 | $1.11 | 6d | 1 | 0.42mi |
| 209 Rosa Ave Metairie, LA | 3.0 | 2.5 | 2400 | $2,000 | $0.83 | 16d | 1 | 0.43mi |
| 437 Elmeer Ave Metairie, LA | 3.0 | 2.0 | 2041 | $3,950 | $1.94 | 23d | 1 | 0.63mi |
| 428 16th St New Orleans, LA | 3.0 | 2.0 | 1682 | $2,350 | $1.40 | 19d | 1 | 0.66mi |
| 318 18th St New Orleans, LA | 3.0 | 2.0 | 1600 | $2,320 | $1.45 | 25d | 1 | 0.74mi |
| 644 Oaklawn Dr Metairie, LA | 3.0 | 2.0 | 1504 | $2,300 | $1.53 | 16d | 1 | 0.77mi |
| 228 Fairway Dr New Orleans, LA | 3.0 | 2.5 | 2300 | $4,300 | $1.87 | 5d | 1 | 0.80mi |
| 228 Fairway Dr New Orleans, LA | 3.0 | 2.5 | 2300 | $4,300 | $1.87 | 4d | 1 | 0.80mi |
| 6256 Bellaire Dr Unit 6254 New Orleans, LA | 3.0 | 2.0 | 1510 | $1,850 | $1.23 | 22d | 1 | 0.81mi |
| 6121 W End Blvd New Orleans, LA | 3.0 | 2.0 | 1350 | $1,900 | $1.41 | 21d | 1 | 0.88mi |
| 849 Rosa Ave Unit 1 Metairie, LA | 4.0 | 3.0 | 2392 | $2,650 | $1.11 | 25d | 1 | 0.89mi |
| 5622 Canal Blvd Unit Upper New Orleans, LA | 3.0 | 2.0 | 1736 | $2,100 | $1.21 | 5d | 1 | 0.97mi |
| 218 Aurora Ave Metairie, LA | 3.0 | 2.5 | 2500 | $2,500 | $1.00 | 25d | 1 | 0.98mi |
| 6180 Milne Blvd New Orleans, LA | 3.0 | 2.5 | 1785 | $2,400 | $1.34 | 4d | 1 | 1.01mi |
| 700 Florida Blvd New Orleans, LA | 3.0 | 2.5 | 1850 | $1,950 | $1.05 | 18d | 1 | 1.03mi |
| 5373 Canal Blvd New Orleans, LA | 3.0 | 2.0 | 1800 | $4,200 | $2.33 | 45d | 1 | 1.07mi |
| 5373 Canal Blvd New Orleans, LA | 3.0 | 2.0 | 1800 | $6,800 | $3.78 | 19d | 1 | 1.07mi |
| 109 Avenue E Metairie, LA | 3.0 | 3.5 | 2068 | $3,000 | $1.45 | 46d | 1 | 1.12mi |
| 728 Bonnabel Blvd Unit 1 Metairie, LA | 3.0 | 2.0 | 2000 | $3,500 | $1.75 | 45d | 1 | 1.13mi |
| 6118 Canal Blvd New Orleans, LA | 3.0 | 2.0 | 1960 | $2,800 | $1.43 | 18d | 1 | 1.15mi |
| 431 Tacoma St New Orleans, LA | 3.0 | 2.0 | 2019 | $4,300 | $2.13 | 18d | 1 | 1.17mi |
| 6344 Milne Blvd New Orleans, LA | 3.0 | 2.0 | 1450 | $2,500 | $1.72 | 16d | 1 | 1.18mi |
| 5458 General Diaz St New Orleans, LA | 3.0 | 2.0 | 1289 | $2,000 | $1.55 | 18d | 1 | 1.20mi |
| 309 Lilac St Metairie, LA | 3.0 | 2.5 | 1750 | $1,745 | $1.00 | 45d | 1 | 1.20mi |
| 1421 Carrollton Ave Metairie, LA | 3.0 | 2.0 | 1300 | $1,650 | $1.27 | 45d | 1 | 1.21mi |
| 517 Beverly Garden Dr Metairie, LA | 3.0 | 2.0 | 1700 | $2,000 | $1.18 | 46d | 1 | 1.23mi |
| 261 Hollywood Dr Unit C Metairie, LA | 3.0 | 1.0 | 1400 | $2,300 | $1.64 | 6d | 1 | 1.24mi |
| 6558 Bellaire Dr New Orleans, LA | 3.0 | 2.5 | 1700 | $1,900 | $1.12 | 4d | 1 | 1.24mi |
| 1117 Andrews Ave Metairie, LA | 3.0 | 2.0 | 1770 | $2,600 | $1.47 | 45d | 1 | 1.25mi |
| 6509 West End Blvd New Orleans, LA | 4.0 | 2.0 | 1750 | $2,600 | $1.49 | 25d | 1 | 1.28mi |
| 301 City Park Ave New Orleans, LA | 4.0 | 2.0 | 1550 | $2,000 | $1.29 | 16d | 1 | 1.28mi |
| 422 36th St New Orleans, LA | 3.0 | 2.0 | 1400 | $2,250 | $1.61 | 25d | 1 | 1.28mi |
| 609 Melody Dr Metairie, LA | 3.0 | 1.0 | 1372 | $2,150 | $1.57 | 25d | 1 | 1.29mi |
| 312 W Esplanade Ave Metairie, LA | 3.0 | 2.5 | 1400 | $1,600 | $1.14 | 45d | 1 | 1.30mi |
| 132 Hesper Ave Metairie, LA | 4.0 | 4.0 | 2598 | $5,500 | $2.12 | 45d | 1 | 1.30mi |
| 4901 Iberville St New Orleans, LA | 4.0 | 2.5 | 2256 | $3,500 | $1.55 | 45d | 1 | 1.39mi |
| 6552 Milne Blvd New Orleans, LA | 4.0 | 2.0 | 2436 | $2,400 | $0.99 | 19d | 1 | 1.40mi |
| 6369 Canal Blvd New Orleans, LA | 3.0 | 2.0 | 2000 | $2,600 | $1.30 | 16d | 1 | 1.40mi |
Listing history 8 events
-
2026-06-21days on market $349,000 Active 12 DOM
-
2026-06-18days on market $349,000 Active 9 DOM
-
2026-06-17days on market $349,000 Active 8 DOM
-
2026-06-16days on market $349,000 Active 7 DOM
-
2026-06-15days on market $349,000 Active 6 DOM
-
2026-06-13days on market $349,000 Active 4 DOM
-
2026-06-10remarks 693-char remark
-
2026-06-10$349,000 Active 1 DOM
ⓘ Source: listings_history table (triggers on properties + properties_extension) + one-shot
backfill from property_details.listing_events for pre-trigger history.
Tax reassessment forecast LA · Resets to sale price
- Current annual tax
- $2,767 · $231/mo
- Projected year-2 tax
- $2,767 · $231/mo
- Expected delta
- $0/yr ($0/mo · 0.0%)
ⓘ Screening estimate from a state-policy table — verify with the county assessor before closing.
Climate risk First Street
- Flood 8/10 Severe FEMA zone AE · 77% chance over 30 yrs
- Wildfire 1/10 Low
- Heat 10/10 Extreme 7 d/yr ≥108°F today · 21 d/yr by 30 yrs out
- Wind 10/10 Extreme 99% chance of damaging wind over 30 yrs
- Air quality 4/10 Moderate 4 unhealthy d/yr today · 4 by 30 yrs out
Nearby sold comps map
Loading sold comps map…
Walkable amenities ~0.75 mi
Loading nearby amenities…
Taxation est. · year 1
- Rental income
- $41,520
- − Mortgage interest
- −$19,549
- − Property taxes
- −$2,767
- − Insurance
- −$6,864
- − Repairs & maintenance
- −$3,322
- − Management
- −$3,322
- − Depreciation
- −$10,153
- Taxable loss
- −$4,455
- Est. tax savings @ 24.0%
- +$1,069
- After-tax cash flow
- $2,278/yr
For passive investors: Depreciation is non-cash, so a rental often shows a tax loss while cash-flowing — sheltering income. Rental losses are passive: they offset passive income freely, and up to $25,000/yr can offset ordinary (W-2) income if you actively participate and your MAGI is under $100k (phasing out to $0 by $150k); unused losses carry forward. On sale, claimed depreciation is recaptured at up to 25%, and gains may owe capital-gains tax (a 1031 exchange can defer both). Figures are a year-1 estimate at your 24.0% rate — not tax advice; consult a CPA.
Schools (NCES district)
- District
- Jefferson Parish
- NCES district ID
- 2200840
- Math proficiency
- 24% ▼ -36.00%
- Reading proficiency
- 34% ▼ -30.00%
- Median HH income
- $48,421
- Composite
- 25.19/100
- National rank
- #7511
- State rank
- #44 of 98 in LA
Livability — Metairie
- Score
- 87/100
- State rank
- #1
- US rank
- #261
Category grades
Schools grade is shown separately in the Schools card above.
Census & demographics
- Census place
- Metairie, LA
- County
- Jefferson Parish · 426,999 people
- City population
- 137,978
- Metro
- New Orleans-Metairie, LA
- Population (ZIP)
- 24,088
- Household income
- $89,194
- Rent vs Own
- Severe rent burden
- 711.0
Population outlook (Jefferson County) Hauer SSP2
- Today (2025)
- 451,696 people
- By 2030
- 455,451 · +0.8%
- By 2040
- 458,308 · +1.5%
- By 2050
- 461,031 · +2.1%
- By 2075
- 476,351 · +5.5%
- By 2100
- 499,377 · +10.6%
Race, ethnicity, and origin ACS 2023
- Neighborhood character
- Predominantly White (81%)
- Race & ethnicity
- White 81% Hispanic / Latino 13% Two or more races 8% Asian 2% Native American 2% Black 1%
- Hispanic origin (detail)
- Mexican 1%
- Common ancestry
- Lithuanian 21% Slovak 2% Iranian 1%
- Foreign-born
- 9% · Canada, China, Vietnam
- Languages at home
- 89% English-only · Spanish 8% French/Haitian/Cajun 1% Other Indo-European 1%
Political lean MEDSL · Jefferson
- 2024 margin
- R (+12.9) · D 42.5% · R 55.5% · Other 2.1%
- 2008→2024 swing
- +13.6pp toward D · 2008: -26.6pp · 2024: -12.9pp
- All cycles
- 2024: R+12.9 2020: R+11.1 2016: R+14.8 2012: R+18.4 2008: R+26.6
Not yet ingested
- Civics
- —
Market trends
- HPI YoY
- ▼ -371.32%
- Current HPI
- 142.4955
- Rent YoY
- ▼ -0.31%
- Metro
- New Orleans-Metairie, LA
- State GDP YoY
- ▲ 3.29%
- F500 in state
- 10
Industry mix (Fortune 500 HQ in LA)
| Industry | F500 HQs | Revenue |
|---|---|---|
| Telecommunications | 2 | $23B |
|
||
| Utilities | 1 | $12B |
|
||
| Wholesale / Distribution | 1 | $5B |
|
||
| Advertising | 1 | $2B |
|
||
Price history
+0.0% since first listed3 events — show timeline
- 2026-06-09 Listed $349,000 AcadianaMLS
- 2026-06-09 Listed $349,000 GSREIN
- 1990-07-01 Sold (Public Records) — Public Records
Property tax history
+1.5%/yrLatest (2025): $2,767 · +0.2% YoY. Source: county tax records.
Cash-flow waterfall
monthlySold comps — $/sqft
last 12 mo · ≤1 miLoading sold comps…