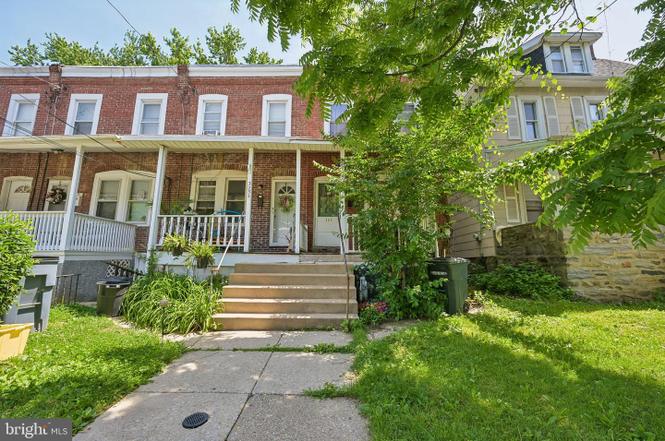
325 W Spring Ave · Ardmore, PA
Flood risk 1/10 · Minimal
- FEMA flood zone
- X (unshaded)
- Chance of flooding over 30 yrs
- 0.0%
- Est. flood insurance / yr
- $473 – $860
Fire risk 1/10 · Minimal
- Est. fire insurance / yr
- $511 – $949
Heat risk 6/10 · Moderate
- Hot days now (above 103°F)
- 7 days/yr
- Hot days in 30 yrs
- 15 days/yr
Wind risk 6/10 · Moderate
- Chance of severe wind over 30 yrs
- 27.0%
Air-quality risk 4/10 · Minor
- Unhealthy air days now
- 3 days/yr
- Unhealthy air days in 30 yrs
- 6 days/yr
Risk factors via First Street. Map © Google.
Why this score? — see what drove the D grade
The composite is a weighted blend of 9 inputs, each scored 0–100. Each bar is that input's sub-score; the figure is the points it added to the 100-point composite (weight × sub-score).
- Cash flow +14.0/30.0
- Schools +7.3/10.0
- ARV discount +5.2/15.0
- Livability +4.7/5.0
- DSCR +4.3/10.0
- Rent growth +3.5/5.0
- 1% rule +3.1/10.0
- Condition / age +2.5/5.0
- Appreciation +0.0/10.0
$320,000
🖨 Deal sheet (PDF) 📄 Offer letter ✓ Due diligence
Listing remarks
A Rare Gem in the Heart of Ardmore! Welcome home to this charming 2-bedroom, 1-bath Colonial that perfectly blends timeless character with modern updates. From the inviting front porch to the private, shaded backyard oasis, this home offers warmth, comfort, and inviting spaces both inside and out. Inside, you'll find beautiful hardwood flooring throughout, a large formal dining room ideal for entertaining, and an updated kitchen featuring stainless steel appliances and ample cabinet space. Recent improvements include: updated kitchen appliances (May 2024), fresh paint throughout the first floor, stairwell, and upstairs hallway, new drywall overlays on all first-floor ceilings, and new drywa
Key facts
- Hardwood flooring
- Formal dining room
- Updated kitchen
Tags
Property features AI
Exterior
- Parking: On-street parking
- Utilities: Public water; Public sewer; Electric service; Natural gas
- Home design: Interior townhouse/rowhouse; Fee simple ownership
- Construction: Brick construction; Stone and brick/mortar foundation; Above-grade and below-grade structures
- Exterior features: No tidal water; Lot dimensions approximately 15 x 0
Interior
- Kitchen: Dishwasher; Gas oven/range; Refrigerator
- Bedrooms: Two bedrooms on the upper level
- Bathrooms: One full bathroom
- Heating & cooling: Forced air heating (natural gas); Ceiling fan cooling; Wall unit cooling; Electric cooling systems
- Interior features: Tub/shower; Unfinished basement
- Laundry & utility: Washer; Dryer; Natural gas hot water
Neighborhood map
What this means for you Summary
Snapshot
- This is a 2-bed/1.0-bath townhouse listed at $320k.
Deal economics
- At list price, monthly cash flow is $42 ($507/yr) — positive.
- The deal already cash-flows at list — no discount required.
- To meet the 1% rule (rent ≥ 1% of price), the offer needs to be $259k (19.1% below list).
- Recommended offer: $259k (19.1% below list) — sets the bar for 1% rule.
- Cap rate 6.5% vs local median 2.1% in Ardmore — top-decile yield for the area; either an underpriced asset or a hidden risk that comps aren't pricing in. Stress-test before assuming the spread holds.
Location & tenants
- Location reads 94/100 on livability (#2 in PA, #6 nationally) — a professional / high-income tenant draw. Strengths: crime A+, amenities A+, commute A+; Watch: cost of living D-.
- Lower Merion SD (suburban): math 74% / reading 84% proficiency, ranked #3 of 539 in PA (top 1%) — strong family-tenant draw, lease renewals of 3-5y typical; only 7% free/reduced lunch — higher-income household profile.
- Zoned schools: Penn Wynne Sch (math 79% / reading 86%, grade A+, #32 of 1,518 statewide, top 2%, 615 students, 18% FRL); Bala-Cynwyd Ms (math 66% / reading 84%, grade A, #6 of 512 statewide, top 1%, 809 students, 12% FRL); Lower Merion Hs (math 87%, 1,712 students, 17% FRL).
- Market conditions: Rents rising (+3.9%/yr); 38 active listings in the ZIP; 22 comparable units currently listed for rent nearby; rentals at typical pace (median 17d on market — plan ~3-4 weeks tenant-placement turnaround); high-income renter base; 1,936 units permitted in Montgomery County in 2024 (530 in 5+ unit buildings).
Forward outlook
- Local home prices are declining (-3.0%/yr); year-one equity from $2k of loan paydown is wiped out by about $10k of value loss. Plan a longer hold.
- Montgomery County population projected at +5% by 2050 — modest demand growth; plan on rents tracking national, not racing it.
Negotiation context
- Only 9 days on market — expect competitive offers; lowballing is unlikely to land.
- 3 sale attempts since 30y ago with the ask held roughly flat each time — persistent listings suggest the price (not the market) is what's stuck; bring a comps-based counter.
- Current owner paid $149k; list at $320k implies a 115% gain — meaningful room to come down on a strong offer.
Risks & watch-outs
- Watch-outs: built in 1900 — expect roof / HVAC / electrical / plumbing capex.
- Climate carrying-cost: major wind risk, 27% chance of damaging wind over 30y; extreme-heat days projected 7→15/yr by 2055 (HVAC capex compounding) — expect insurance premiums to compound above CPI over the hold.
Questions for the listing agent
- Built in 1900 — when were the roof, HVAC, electrical panel, plumbing, and water heater last replaced?
- Is there a deadline driving the sale (1031 exchange, divorce, estate, relocation)? That informs how much negotiation room exists.
- Schools are A-rated — typically a magnet for longer-tenancy family renters. What's the average tenant stay here, and is there a school-zone premium baked into asking?
- The area grade is low — what's the realistic commute time and amenity access for the typical tenant pool here? Any planned neighborhood developments (good or bad) we should know about?
- What's the average days-on-market for RENTAL listings here right now (not sales)? A rising rental-DOM trend means longer vacancies and softer asking-rent achievability than the comps imply.
- What's the recent tenant-quality profile in this submarket — average credit score on applications, eviction rate, late-payment / NSF rate, and stable-employment percentage? A property-management company in the area should have these aggregated.
- How much new for-sale + rental construction is in the pipeline within 1–3 miles? Heavy new supply typically softens prices + rents 12–24 months out; constrained supply supports both.
Investment metrics
- 1% rule
- 0.81% ✗
- Cap rate
- 6.45%
- Cash-on-cash
- 0.57%
- DSCR
- 1.03
- GRM
- 10.3
CMA / ARV
- ARV (on-the-fly)
- $304,384
- Comps found
- 12
Show comp detail 12 sales within ~0.75 mi
| Address | Dist | Beds/Ba | Sqft | Sold | Price | $/sf | Match |
|---|---|---|---|---|---|---|---|
| 237 W Montgomery Ave Unit 2S | 0.34mi | 2/2.0 | 938 (+1%) | 1mo | $301,000 | $321 | 78 |
| 106 W Montgomery Ave #8 | 0.37mi | 2/1.5 | 960 (+3%) | 7mo | $367,500 | $383 | 69 |
| 237 W Montgomery Ave Unit 1Q | 0.34mi | 2/2.0 | 960 (+3%) | 7mo | $315,000 | $328 | 69 |
| 237 Montgomery Ave Unit 1-L | 0.34mi | 1/1.5 (-1) | 990 (+7%) | 4mo | $212,500 | $215 | 62 |
| 106 W Montgomery Ave #6 | 0.37mi | 2/1.5 | 960 (+3%) | 19mo | $361,000 | $376 | 59 |
| 225 Sheas Ter | 0.61mi | 2/1.0 | 1,008 (+9%) | 10mo | $220,000 | $218 | 49 |
| 449 W Montgomery Ave #203 | 0.57mi | 1/1.0 (-1) | 858 (-8%) | 8mo | $250,000 | $291 | 49 |
| 104 Woodside Rd Unit C-302 | 0.40mi | 2/2.0 | 1,063 (+14%) | 9mo | $290,000 | $273 | 45 |
| 139 Walnut Ave | 0.49mi | 3/1.5 (+1) | 1,064 (+15%) | 7mo | $384,000 | $361 | 40 |
| 139 Simpson Rd | 0.55mi | 3/1.0 (+1) | 1,032 (+11%) | 16mo | $399,900 | $388 | 38 |
| 104 Woodside Rd Unit B-202 | 0.40mi | 2/2.0 | 1,063 (+14%) | 19mo | $355,000 | $334 | 38 |
| 206 Sheas Ter | 0.60mi | 3/1.0 (+1) | 1,056 (+14%) | 16mo | $321,000 | $304 | 31 |
Match score weights: distance 35% · size 25% · config 20% · recency 20%. Top-matched comps best support the ARV.
Projected returns pro-forma
-3.0% appreciation · 3.92% rent growth · sell at horizon
- IRR
- -14.5%
- Equity multiple
- 0.48×
- Total profit
- $-46,832
- Equity at exit
- $47,713
- IRR
- -4.5%
- Equity multiple
- 0.69×
- Total profit
- $-27,563
- Equity at exit
- $27,668
Cash invested: $89,600 (down + closing). Projections, not guarantees.
Landlord ↔ Tenant lean methodology
- Overall (STATE)
- 62 Landlord-Friendly
- State Pennsylvania
- 62 Landlord-Friendly · EVEN
- County
- — inherits STATE
- City
- — inherits STATE
ZIP-level market 19003
- Rents YoY
- 3.9%
- Active inventory
- 38
- Price-to-rent
- 10.3×
Monthly cashflow live
- Estimated rent
- $2,589 high interval (Pro) →
- Mortgage (P&I)
- −$1,678
- Tax from tax record
- −$192 /mo · $2,299/yr
- Insurance
- −$133
- HOA
- −$0
- Vacancy / Maint / Mgmt
- −$544
- Net cashflow
- $42
Break-even live
Sensitivity live
| Price | -10% $223 | -5% $133 | +0% $42 | +5% $-48 | +10% $-139 |
|---|---|---|---|---|---|
| Rent | -10% $-162 | -5% $-60 | +0% $42 | +5% $145 | +10% $247 |
| Rate | -1.0pp $203 | -0.5pp $124 | base $42 | +0.5pp $-41 | +1.0pp $-125 |
UW: 25.0% down · 7.5% · 30yr · 1.5% tax · 5.0% vac · 8.0% maint · 8.0% mgmt
Financing live
Cash to close
- Down payment
- $80,000
- Closing costs
- $9,600
- Reserves months
- —
- Total cash needed
- —
Loan-product check · same deal, 3 products live
Conventional
25% down · 7.5% · 30yr
- Down + closing
- —
- Monthly P&I
- —
- Monthly cashflow
- —
- DSCR
- —
- Eligible?
- —
Personal DTI + credit; lowest rate.
DSCR
20% down · 8.5% · 30yr
- Down + closing
- —
- Monthly P&I
- —
- Monthly cashflow
- —
- DSCR
- —
- Eligible?
- —
No personal income docs; deal must DSCR.
Hard money
10% down · 12.0% · 12mo
- Down + closing
- —
- Monthly P&I
- —
- Monthly cashflow
- —
- DSCR
- —
- Eligible?
- —
Short-term bridge; refi at stabilization.
Rent comps 22 comps
| Address | Beds | Baths | Sqft | Rent | $/sqft | DOM | Units | Dist |
|---|---|---|---|---|---|---|---|---|
| 104 Woodside Rd Unit A305 Haverford, PA | 2.0 | 2.0 | 1063 | $2,600 | $2.45 | 16d | 1 | 0.42mi |
| 101 Valley Rd Unit 00 8-C Ardmore, PA | 1.0 | 1.0 | 600 | $1,450 | $2.42 | 45d | 1 | 0.47mi |
| 24 Cricket Ave Ardmore, PA | 1.0–3.0 | 1.0–3.0 | 1150 | $5,336 | $4.64 | 0d | 17 | 0.48mi |
| 20 W Montgomery Ave Unit 00 209 Ardmore, PA | 2.0 | 2.0 | 1100 | $2,250 | $2.05 | 16d | 1 | 0.48mi |
| 20 W Montgomery Ave Unit 00 208 Ardmore, PA | 2.0 | 2.0 | 1100 | $2,250 | $2.05 | 45d | 1 | 0.48mi |
| 65 Cricket Ave Ardmore, PA | 1.0–2.0 | 1.0–2.0 | 879 | $3,799 | $4.32 | 0d | 6 | 0.50mi |
| 16 W Montgomery Ave Unit 00 6 Ardmore, PA | 1.0 | 1.0 | 705 | $1,900 | $2.70 | 45d | 1 | 0.50mi |
| 16 W Montgomery Ave Unit 00 17 Ardmore, PA | 1.0 | 1.0 | 715 | $1,800 | $2.52 | 26d | 1 | 0.50mi |
| 11 E Athens Ave Ardmore, PA | 1.0–2.0 | 1.0 | 529 | $2,290 | $4.33 | 0d | 3 | 0.50mi |
| 457 W Lancaster Ave Unit B Haverford, PA | 1.0 | 1.0 | 600 | $1,550 | $2.58 | 18d | 1 | 0.51mi |
| 438 Montgomery Ave Haverford, PA | 1.0–2.0 | 1.0–2.0 | 775 | $2,498 | $3.22 | 18d | 1 | 0.54mi |
| 101 Mill Creek Rd Ardmore, PA | 2.0 | 1.0–2.0 | 681 | $2,295 | $3.37 | 12d | 5 | 0.59mi |
| 115 Mill Creek Rd Ardmore, PA | 2.0 | 1.0 | 826 | $2,695 | $3.26 | 4d | 5 | 0.62mi |
| 110 Grandview Rd Ardmore, PA | 2.0 | 1.0 | 1000 | $2,100 | $2.10 | 26d | 1 | 0.78mi |
| 115 Coulter Ave Ardmore, PA | 1.0–3.0 | 1.0–2.0 | 955 | $5,126 | $5.37 | 0d | 63 | 0.78mi |
| 369b E County Line Rd Ardmore, PA | 1.0 | 1.0 | 700 | $1,400 | $2.00 | 4d | 1 | 0.92mi |
| 601 Montgomery Ave #302 Bryn Mawr, PA | 2.0 | 2.0 | 1117 | $2,600 | $2.33 | 45d | 1 | 0.93mi |
| 170 Lakeside Rd Ardmore, PA | 2.0 | 1.0–2.0 | 779 | $2,525 | $3.24 | 7d | 6 | 1.02mi |
| 2301 Haverford Rd Ardmore, PA | 1.0 | 1.0 | 620 | $1,738 | $2.80 | 26d | 5 | 1.13mi |
| 47 S Merion Ave Apt 2 Bryn Mawr, PA | 1.0 | 1.0 | 800 | $1,565 | $1.96 | 23d | 1 | 1.43mi |
| 275 S Bryn Mawr Ave Bryn Mawr, PA | 1.0–2.0 | 1.0–2.0 | 950 | $2,848 | $3.00 | 0d | 32 | 1.46mi |
| 901 Montgomery Ave Bryn Mawr, PA | 1.0–2.0 | 1.0 | 698 | $1,850 | $2.65 | 6d | 18 | 1.48mi |
Listing history 7 events
-
2026-06-21days on market $320,000 Active 9 DOM
-
2026-06-18days on market $320,000 Active 6 DOM
-
2026-06-17days on market $320,000 Active 5 DOM
-
2026-06-16days on market $320,000 Active 4 DOM
-
2026-06-15days on market $320,000 Active 3 DOM
-
2026-06-13remarks 699-char remark
-
2026-06-13$320,000 Active 1 DOM
ⓘ Source: listings_history table (triggers on properties + properties_extension) + one-shot
backfill from property_details.listing_events for pre-trigger history.
Tax reassessment forecast PA · Partial reset (capped growth)
- Current annual tax
- $2,299 · $192/mo
- Projected year-2 tax
- $3,677 · $306/mo
- Expected delta
- +$1,379/yr (+$115/mo · 60.0%)
ⓘ Screening estimate from a state-policy table — verify with the county assessor before closing.
Climate risk First Street
- Flood 1/10 Low FEMA zone X (unshaded) · 0% chance over 30 yrs
- Wildfire 1/10 Low
- Heat 6/10 Major 7 d/yr ≥103°F today · 15 d/yr by 30 yrs out
- Wind 6/10 Major 27% chance of damaging wind over 30 yrs
- Air quality 4/10 Moderate 3 unhealthy d/yr today · 6 by 30 yrs out
Nearby sold comps map
Loading sold comps map…
Walkable amenities ~0.75 mi
Loading nearby amenities…
Taxation est. · year 1
- Rental income
- $31,068
- − Mortgage interest
- −$17,925
- − Property taxes
- −$2,299
- − Insurance
- −$1,600
- − Repairs & maintenance
- −$2,485
- − Management
- −$2,485
- − Depreciation
- −$9,309
- Taxable loss
- −$5,036
- Est. tax savings @ 24.0%
- +$1,209
- After-tax cash flow
- $1,716/yr
For passive investors: Depreciation is non-cash, so a rental often shows a tax loss while cash-flowing — sheltering income. Rental losses are passive: they offset passive income freely, and up to $25,000/yr can offset ordinary (W-2) income if you actively participate and your MAGI is under $100k (phasing out to $0 by $150k); unused losses carry forward. On sale, claimed depreciation is recaptured at up to 25%, and gains may owe capital-gains tax (a 1031 exchange can defer both). Figures are a year-1 estimate at your 24.0% rate — not tax advice; consult a CPA.
Schools (NCES district)
- District
- Lower Merion SD
- NCES district ID
- 4214160
- Math proficiency
- 74% ▼ -5.00%
- Reading proficiency
- 84% ▼ -4.00%
- Median HH income
- $113,035
- Composite
- 72.82/100
- National rank
- #194
- State rank
- #3 of 539 in PA
Livability — Ardmore
- Score
- 94/100
- State rank
- #2
- US rank
- #6
Category grades
Schools grade is shown separately in the Schools card above.
Census & demographics
- Census place
- Ardmore, PA
- County
- Montgomery County · 712,331 people
- City population
- 14,255
- Metro
- Philadelphia-Camden-Wilmington, PA-NJ-DE-MD
- Population (ZIP)
- 14,255
- Household income
- $119,861
- Rent vs Own
- Severe rent burden
- 418.0
Population outlook (Montgomery County) Hauer SSP2
- Today (2025)
- 856,074 people
- By 2030
- 870,887 · +1.7%
- By 2040
- 891,195 · +4.1%
- By 2050
- 896,417 · +4.7%
- By 2075
- 903,212 · +5.5%
- By 2100
- 843,240 · -1.5%
Race, ethnicity, and origin ACS 2023
- Neighborhood character
- Predominantly White (69%)
- Race & ethnicity
- White 69% Black 13% Two or more races 9% Hispanic / Latino 6% Asian 6%
- Hispanic origin (detail)
- Mexican 2%
- Common ancestry
- Romanian 5% Scotch-Irish 3% Slovak 2%
- Foreign-born
- 10% · Canada, China, South Korea
- Languages at home
- 88% English-only · Spanish 3% Chinese 2% Other Indo-European 2%
Political lean MEDSL · Montgomery
- 2024 margin
- Strong D (+22.8) · D 60.9% · R 38.1% · Other 1.1%
- 2008→2024 swing
- +2.0pp toward D · 2008: 20.8pp · 2024: 22.8pp
- All cycles
- 2024: D+22.8 2020: D+26.3 2016: D+21.1 2012: D+14.3 2008: D+20.8
Not yet ingested
- Civics
- —
Market trends
- HPI YoY
- ▼ -416.13%
- Current HPI
- 297.3326
- Rent YoY
- ▲ 3.92%
- Metro
- Philadelphia-Camden-Wilmington, PA-NJ-DE-MD
- State GDP YoY
- ▲ 1.68%
- F500 in state
- 34
Industry mix (Fortune 500 HQ in PA)
| Industry | F500 HQs | Revenue |
|---|---|---|
| Healthcare | 2 | $309B |
|
||
| Insurance | 2 | $27B |
|
||
| Telecommunications / Media | 1 | $124B |
|
||
| Industrial Distribution | 1 | $22B |
|
||
| Financial Services | 1 | $20B |
|
||
| Chemicals / Materials | 1 | $18B |
|
||
Price history
+434.2% since first listed9 events — show timeline
- 2026-06-13 Listed $320,000 BRIGHT MLS
- 2026-06-11 Coming Soon $320,000 BRIGHT MLS
- 2019-11-25 Sold (Public Records) $149,000 Public Records
- 2006-03-24 Sold (Public Records) $68,000 Public Records
- 1997-07-29 Sold (Public Records) $57,000 Public Records
- 1997-05-30 Listing Removed — BRIGHT MLS
- 1997-02-24 Listed $60,000 BRIGHT MLS
- 1996-10-31 Listing Removed — BRIGHT MLS
- 1996-08-15 Listed $59,900 BRIGHT MLS
Property tax history
+3.0%/yrLatest (2026): $2,299 · +4.6% YoY. Source: county tax records.
Cash-flow waterfall
monthlySold comps — $/sqft
last 12 mo · ≤1 miLoading sold comps…