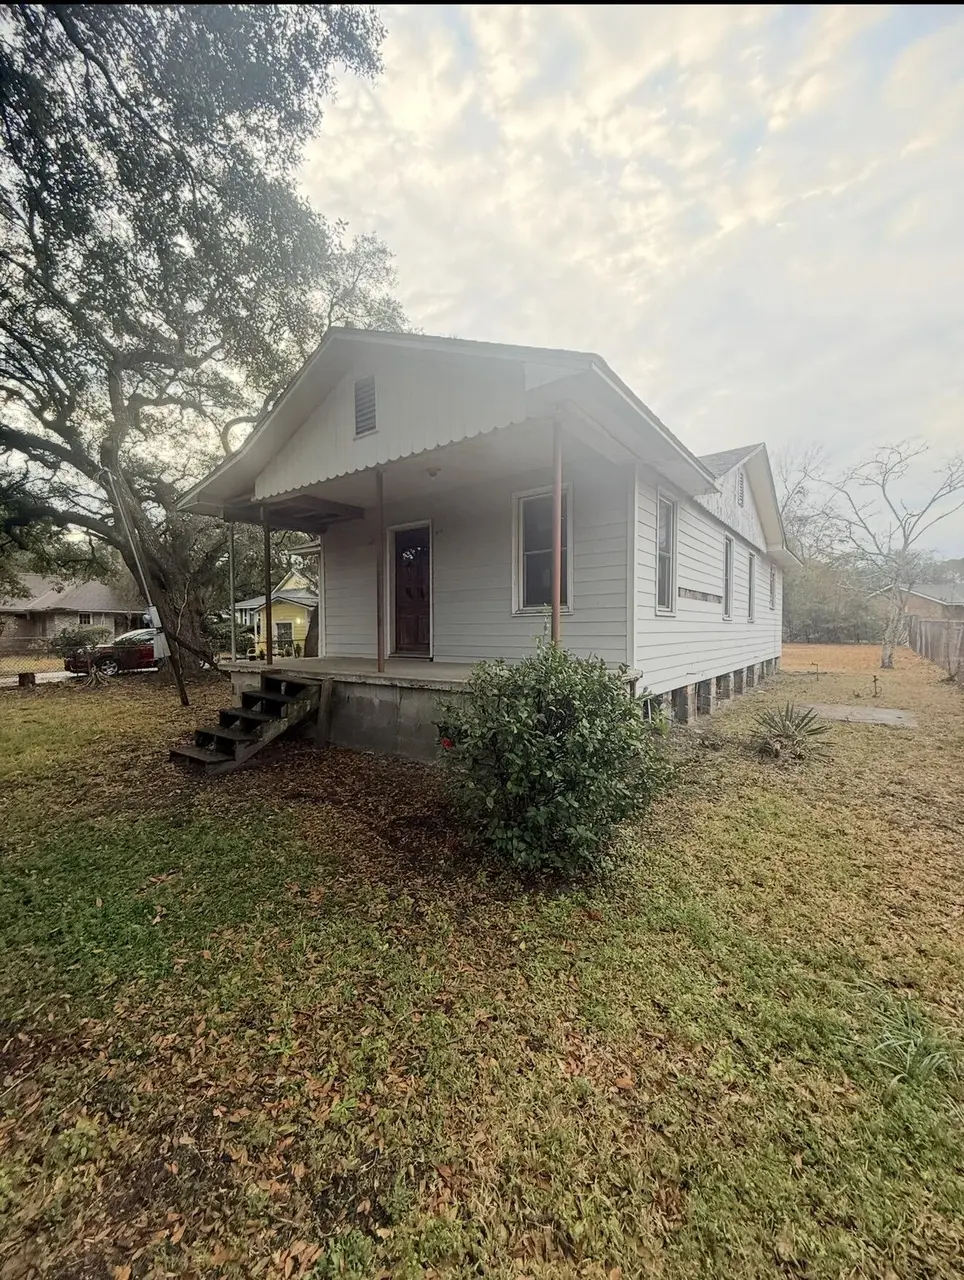
2605 Bennett Yard Rd · North Charleston, SC
Flood risk 1/10 · Minimal
- FEMA flood zone
- X (unshaded)
- Chance of flooding over 30 yrs
- 0.0%
- Est. flood insurance / yr
- $507 – $1,088
Fire risk 1/10 · Minimal
- Est. fire insurance / yr
- $783 – $1,453
Heat risk 10/10 · Severe
- Hot days now (above 105°F)
- 7 days/yr
- Hot days in 30 yrs
- 18 days/yr
Wind risk 9/10 · Severe
- Chance of severe wind over 30 yrs
- 99.0%
Air-quality risk 3/10 · Minor
- Unhealthy air days now
- 3 days/yr
- Unhealthy air days in 30 yrs
- 3 days/yr
Risk factors via First Street. Map © Google.
Why this score? — see what drove the B+ grade
The composite is a weighted blend of 9 inputs, each scored 0–100. Each bar is that input's sub-score; the figure is the points it added to the 100-point composite (weight × sub-score).
- Cash flow +30.0/30.0
- ARV discount +15.0/15.0
- DSCR +10.0/10.0
- 1% rule +7.4/10.0
- Schools +4.3/10.0
- Rent growth +4.1/5.0
- Livability +3.3/5.0
- Condition / age +2.5/5.0
- Appreciation +0.0/10.0
$150,000
🖨 Deal sheet 📄 Offer letter ✓ Due diligence
Listing remarks
Calling all investors, flippers, Airbnb and handy buyers! Bring your tools and your vision to 2605 Bennett Yard Road. Location is everything! Tucked into North Charleston, you are just minutes from major employers, local dining, shopping, and main highways for easy commute.
Key facts
- 0.28 acre lot
- Built 1961
Property features AI
Finance
- Financial info: Annual property tax noted (amount provided in records)
- HOA & community: No association fee
Exterior
- Utilities: Public sewer
- Home design: Single-family detached home; Residential property; Fee simple ownership
- Exterior features: Asphalt roof; No other structures on the property; Located in the Green Grove subdivision
Interior
- Bedrooms: 3 bedrooms
- Bathrooms: 1 bathroom
- Interior features: 3 bedrooms; 1 bathroom
Neighborhood map
What this means for you Summary
Snapshot
- This is a 2-bed/1.0-bath single-family listed at $150k.
Deal economics
- At list price, monthly cash flow is $569 ($7k/yr) — positive.
- The deal already cash-flows at list — no discount required.
- Meets the 1% rule at list price ($2k rent vs $150k).
- Cap rate 10.8% vs local median 4.0% in North Charleston — top-decile yield for the area; either an underpriced asset or a hidden risk that comps aren't pricing in. Stress-test before assuming the spread holds.
Location & tenants
- Location reads 66/100 on livability (#122 in SC) — a middle-class / working-renter tenant base. Strengths: housing A+, health & safety A+, cost of living A; Watch: employment C-, crime F, amenities F.
- Charleston 01 (urban): math 48% / reading 53% proficiency, ranked #7 of 80 in SC (top 9%) — acceptable for families but not a draw, mixed tenant base, ~2y average lease.
- Zoned schools: Chicora Elementary (math 9% / reading 5%, grade F, #596 of 597 statewide, top 100%, 320 students, 100% FRL); Morningside Middle (math 4% / reading 12%, grade F, #226 of 229 statewide, top 99%, 567 students, 100% FRL) — zoned schools average 100% FRL vs 44% district-wide (56 pts higher); higher-poverty schools than district average — tighter screening recommended.
- Zoned-school proficiency averages 8% at this address vs 50% district-wide (-43 pts) — the specific schools serving this property underperform the Charleston 01 average; the district grade overstates school quality for this exact location.
- Market conditions: Rents rising fast (+6.4%/yr); 203 active listings in the ZIP; 20 comparable units currently listed for rent nearby; rentals at typical pace (median 24d on market — plan ~3-4 weeks tenant-placement turnaround); 4,156 units permitted in Charleston County in 2024 (857 in 5+ unit buildings).
- This rent runs 40% of the median local income ($57k/yr) — at the standard rent-burdened threshold; future hikes will face affordability resistance.
Forward outlook
- Local home prices are declining (-3.0%/yr); year-one equity from $1k of loan paydown is wiped out by about $4k of value loss. Plan a longer hold.
- Charleston County population projected at +44% by 2050 — long-run rental-demand tailwind backs the buy-and-hold thesis.
- At projected returns (-3.0% appreciation + 6.4% rent growth), your $42k cash investment doubles in ~7 years — after that, you're playing with house money.
Negotiation context
- Only 1 days on market — expect competitive offers; lowballing is unlikely to land.
Risks & watch-outs
- Climate carrying-cost: severe wind risk, 99% chance of damaging wind over 30y; extreme-heat days projected 7→18/yr by 2055 (HVAC capex compounding) — expect insurance premiums to compound above CPI over the hold.
Questions for the listing agent
- Built in 1961 — when were the roof, HVAC, electrical panel, plumbing, and water heater last replaced?
- Is there a deadline driving the sale (1031 exchange, divorce, estate, relocation)? That informs how much negotiation room exists.
- Crime grade is F in this area — have there been break-ins, vandalism, or insurance claims at this property in the last 3 years? What carrier currently insures it and at what premium?
- What's the average days-on-market for RENTAL listings here right now (not sales)? A rising rental-DOM trend means longer vacancies and softer asking-rent achievability than the comps imply.
- What's the recent tenant-quality profile in this submarket — average credit score on applications, eviction rate, late-payment / NSF rate, and stable-employment percentage? A property-management company in the area should have these aggregated.
- How much new for-sale + rental construction is in the pipeline within 1–3 miles? Heavy new supply typically softens prices + rents 12–24 months out; constrained supply supports both.
Investment metrics
- 1% rule
- 1.24% ✓
- Cap rate
- 10.85%
- Cash-on-cash
- 16.27%
- DSCR
- 1.72
- GRM
- 6.7
CMA / ARV
- ARV (on-the-fly)
- $256,932
- Comps found
- 6
Show comp detail 6 sales within ~0.75 mi
| Address | Dist | Beds/Ba | Sqft | Sold | Price | $/sf | Match |
|---|---|---|---|---|---|---|---|
| 2666 Bennett Yard Rd | 0.22mi | 3/2.0 (+1) | 892 (+12%) | 9mo | $289,000 | $324 | 52 |
| 2965 Alabama Dr | 0.74mi | 3/2.0 (+1) | 800 (+1%) | 4mo | $305,000 | $381 | 52 |
| 2885 Charlene Dr | 0.68mi | 2/1.0 | 864 (+9%) | 4mo | $200,000 | $231 | 50 |
| 2897 Charlene Dr | 0.66mi | 2/1.0 | 864 (+9%) | 18mo | $270,000 | $313 | 39 |
| 2805 Martha Dr | 0.71mi | 2/1.0 | 864 (+9%) | 17mo | $220,000 | $255 | 37 |
| 2963 Alabama Dr | 0.74mi | 2/1.5 | 676 (-15%) | 10mo | $272,000 | $402 | 30 |
Match score weights: distance 35% · size 25% · config 20% · recency 20%. Top-matched comps best support the ARV.
Projected returns pro-forma
-3.0% appreciation · 6.36% rent growth · sell at horizon
- IRR
- 10.7%
- Equity multiple
- 1.44×
- Total profit
- $18,428
- Equity at exit
- $22,365
- IRR
- 22.2%
- Equity multiple
- 3.17×
- Total profit
- $91,194
- Equity at exit
- $12,969
Cash invested: $42,000 (down + closing). Projections, not guarantees.
Landlord ↔ Tenant lean methodology
- Overall (STATE)
- 90 Strongly Landlord-Friendly
- State South Carolina
- 90 Strongly Landlord-Friendly · R+6
- County
- — inherits STATE
- City
- — inherits STATE
ZIP-level market 29405
- Home prices YoY
- -29.0%
- Rents YoY
- 6.4%
- Active inventory
- 203
- Price-to-rent
- 6.7×
Monthly cashflow live
- Estimated rent
- $1,865 high interval (Pro) →
- Mortgage (P&I)
- −$787
- Tax from tax record
- −$55 /mo · $658/yr
- Insurance
- −$62
- HOA
- −$0
- Vacancy / Maint / Mgmt
- −$392
- Net cashflow
- $569
Break-even live
UW: 25.0% down · 7.5% · 30yr · 1.5% tax · 5.0% vac · 8.0% maint · 8.0% mgmt
Financing live
Cash to close
- Down payment
- $37,500
- Closing costs
- $4,500
- Reserves months
- —
- Total cash needed
- —
Loan-product check · same deal, 3 products live
Conventional
25% down · 7.5% · 30yr
- Down + closing
- —
- Monthly P&I
- —
- Monthly cashflow
- —
- DSCR
- —
- Eligible?
- —
Personal DTI + credit; lowest rate.
DSCR
20% down · 8.5% · 30yr
- Down + closing
- —
- Monthly P&I
- —
- Monthly cashflow
- —
- DSCR
- —
- Eligible?
- —
No personal income docs; deal must DSCR.
Hard money
10% down · 12.0% · 12mo
- Down + closing
- —
- Monthly P&I
- —
- Monthly cashflow
- —
- DSCR
- —
- Eligible?
- —
Short-term bridge; refi at stabilization.
Rent comps 20 comps
| Address | Beds | Baths | Sqft | Rent | $/sqft | DOM | Units | Dist |
|---|---|---|---|---|---|---|---|---|
| 2512 Bennett Yard Rd Unit B North Charleston, SC | 3.0 | 1.5 | 834 | $1,800 | $2.16 | 23d | 1 | 0.06mi |
| 3229 W Montague Ave North Charleston, SC | 1.0–2.0 | 1.0–2.0 | 946 | $2,601 | $2.75 | 3d | 32 | 0.54mi |
| 2808 Martha Dr North Charleston, SC | 3.0 | 2.0 | 1025 | $2,250 | $2.20 | 23d | 1 | 0.74mi |
| 2708 Busch Ave North Charleston, SC | 3.0 | 1.5 | 1025 | $2,100 | $2.05 | 23d | 1 | 0.86mi |
| 4025 Gary Dr Unit A North Charleston, SC | 3.0 | 1.0 | 925 | $1,600 | $1.73 | 23d | 1 | 0.91mi |
| 2755 Louise Dr North Charleston, SC | 3.0 | 1.0 | 1025 | $1,800 | $1.76 | 23d | 1 | 0.91mi |
| 4008 Gary Dr North Charleston, SC | 2.0 | 1.0 | 676 | $1,300 | $1.92 | 14d | 1 | 0.94mi |
| 4742 Farmal St North Charleston, SC | 3.0 | 1.0 | 1076 | $2,025 | $1.88 | 3d | 1 | 0.94mi |
| 3812 W Montague Ave North Charleston, SC | 1.0–2.0 | 1.0–2.0 | 910 | $2,476 | $2.72 | 3d | 43 | 0.95mi |
| 3963 W Montague Ave Unit 7 North Charleston, SC | 2.0 | 1.0 | 660 | $1,400 | $2.12 | 23d | 1 | 1.02mi |
| 3925 Hilda St North Charleston, SC | 3.0 | 1.0 | 900 | $1,700 | $1.89 | 21d | 1 | 1.05mi |
| 2667 Olympia Ave North Charleston, SC | 2.0 | 2.0 | 899 | $1,500 | $1.67 | 23d | 1 | 1.16mi |
| 2679 Olympia Ave Unit A North Charleston, SC | 3.0 | 1.0 | 1100 | $1,995 | $1.81 | 23d | 1 | 1.17mi |
| 2645 Oregon Ave North Charleston, SC | 3.0 | 2.0 | 916 | $2,300 | $2.51 | 23d | 1 | 1.26mi |
| 5110 Scarsdale Ave #101 North Charleston, SC | 2.0 | 2.0 | 1076 | $1,500 | $1.39 | 12d | 1 | 1.29mi |
| 5138 Scarsdale Ave North Charleston, SC | 2.0 | 1.0 | 886 | $1,550 | $1.75 | 21d | 1 | 1.33mi |
| 2674 Madden Dr North Charleston, SC | 3.0 | 2.0 | 858 | $2,200 | $2.56 | 23d | 1 | 1.39mi |
| 4135 Bonaparte Dr North Charleston, SC | 2.0–3.0 | 1.5 | 1250 | $1,275 | $1.02 | 23d | 1 | 1.45mi |
| 2620 Woodlawn Ave North Charleston, SC | 3.0 | 1.0 | 892 | $1,695 | $1.90 | 10d | 1 | 1.47mi |
| 2620 Woodlawn Ave North Charleston, SC | 3.0 | 1.0 | 892 | $1,695 | $1.90 | 23d | 1 | 1.47mi |
Listing history 3 events
-
2026-06-13status $150,000 Pending 1 DOM
-
2026-06-10remarks 274-char remark
-
2026-06-10$150,000 Coming Soon 1 DOM
ⓘ Source: listings_history table (triggers on properties + properties_extension) + one-shot
backfill from property_details.listing_events for pre-trigger history.
Tax reassessment forecast SC · Resets to sale price
- Current annual tax
- $658 · $55/mo
- Projected year-2 tax
- $855 · $71/mo
- Expected delta
- +$197/yr (+$16/mo · 29.9%)
ⓘ Screening estimate from a state-policy table — verify with the county assessor before closing.
Climate risk First Street
- Flood 1/10 Low FEMA zone X (unshaded) · 0% chance over 30 yrs
- Wildfire 1/10 Low
- Heat 10/10 Extreme 7 d/yr ≥105°F today · 18 d/yr by 30 yrs out
- Wind 9/10 Extreme 99% chance of damaging wind over 30 yrs
- Air quality 3/10 Moderate 3 unhealthy d/yr today · 3 by 30 yrs out
Nearby sold comps map
Loading sold comps map…
Walkable amenities ~0.75 mi
Loading nearby amenities…
Taxation est. · year 1
- Rental income
- $22,381
- − Mortgage interest
- −$8,402
- − Property taxes
- −$658
- − Insurance
- −$750
- − Repairs & maintenance
- −$1,791
- − Management
- −$1,791
- − Depreciation
- −$4,364
- Taxable income
- $4,626
- Est. tax owed @ 24.0%
- −$1,110
- After-tax cash flow
- $5,723/yr
For passive investors: Depreciation is non-cash, so a rental often shows a tax loss while cash-flowing — sheltering income. Rental losses are passive: they offset passive income freely, and up to $25,000/yr can offset ordinary (W-2) income if you actively participate and your MAGI is under $100k (phasing out to $0 by $150k); unused losses carry forward. On sale, claimed depreciation is recaptured at up to 25%, and gains may owe capital-gains tax (a 1031 exchange can defer both). Figures are a year-1 estimate at your 24.0% rate — not tax advice; consult a CPA.
Schools (NCES district)
- District
- Charleston 01
- NCES district ID
- 4501440
- Math proficiency
- 48% ▼ -2.00%
- Reading proficiency
- 53% ▬ 0.00%
- Median HH income
- $52,376
- Composite
- 43.41/100
- National rank
- #3018
- State rank
- #7 of 80 in SC
Livability — North Charleston
- Score
- 66/100
- State rank
- #122
- US rank
- #12222
Category grades
Schools grade is shown separately in the Schools card above.
Census & demographics
- Census place
- North Charleston, SC
- County
- Charleston County · 366,793 people
- City population
- 108,266
- Metro
- Charleston-North Charleston, SC
- Population (ZIP)
- 26,254
- Household income
- $56,600
- Rent vs Own
- Severe rent burden
- 1564.0
Population outlook (Charleston County) Hauer SSP2
- Today (2025)
- 480,562 people
- By 2030
- 525,921 · +9.4%
- By 2040
- 612,189 · +27.4%
- By 2050
- 691,627 · +43.9%
- By 2075
- 847,979 · +76.5%
- By 2100
- 926,482 · +92.8%
Race, ethnicity, and origin ACS 2023
- Neighborhood character
- Majority Black (57%)
- Race & ethnicity
- Black 57% White 34% Hispanic / Latino 5% Two or more races 4%
- Hispanic origin (detail)
- Mexican 2%
- Common ancestry
- Slovak 1% Lithuanian 1% Italian 1%
- Foreign-born
- 4% · Canada
- Languages at home
- 93% English-only · Spanish 5%
Political lean MEDSL · Charleston
- 2024 margin
- Lean D (+5.7) · D 51.9% · R 46.3% · Other 1.8%
- 2008→2024 swing
- -2.7pp toward R · 2008: 8.3pp · 2024: 5.7pp
- All cycles
- 2024: D+5.7 2020: D+12.9 2016: D+7.9 2012: D+2.4 2008: D+8.3
Not yet ingested
- Civics
- —
Market trends
- HPI YoY
- ▼ -152.19%
- Current HPI
- 372.8886
- Rent YoY
- ▲ 6.36%
- Metro
- Charleston-North Charleston, SC
- State GDP YoY
- ▲ 4.51%
- F500 in state
- 2
Industry mix (Fortune 500 HQ in SC)
| Industry | F500 HQs | Revenue |
|---|---|---|
| Packaging | 1 | $7B |
|
||
Price history
+0.0% since first listed2 events — show timeline
- 2026-06-10 Listed $150,000 Charleston Trident MLS
- 2026-06-10 Coming Soon $150,000 Charleston Trident MLS
Property tax history
+0.7%/yrLatest (2022): $658 · +0.6% YoY. Source: county tax records.
Cash-flow waterfall
monthlySold comps — $/sqft
last 12 mo · ≤1 miLoading sold comps…