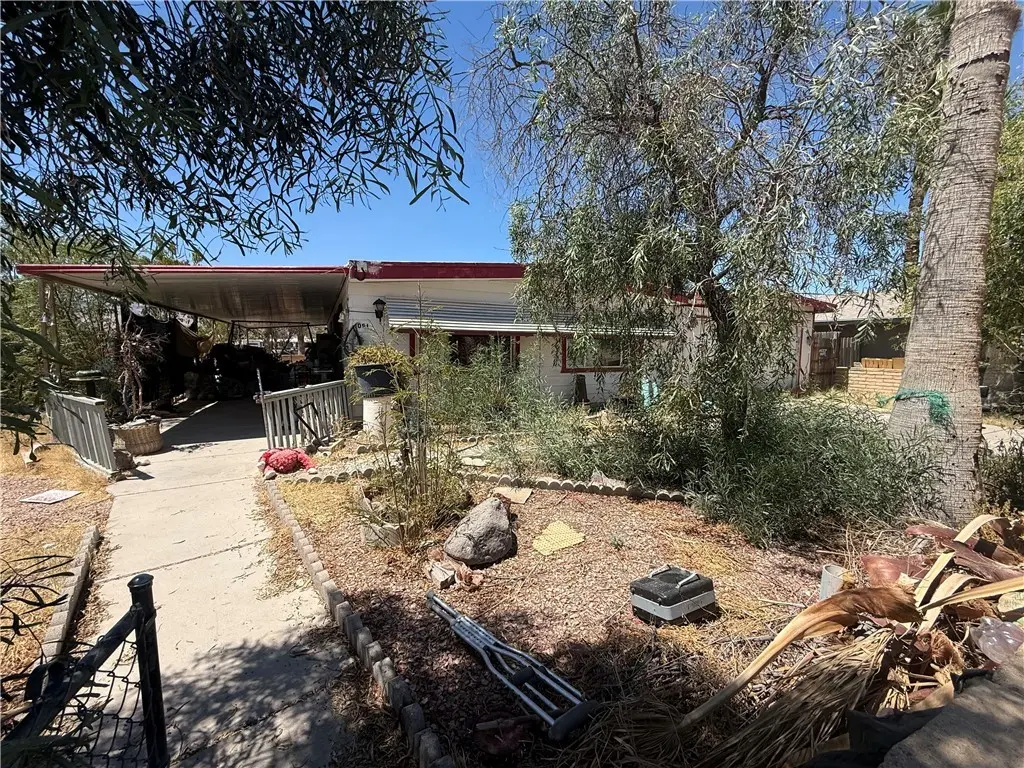
1091 Baseline Rd · Bullhead City, AZ
Flood risk 1/10 · Minimal
- FEMA flood zone
- X (unshaded)
- Chance of flooding over 30 yrs
- 0.0%
- Est. flood insurance / yr
- $507 – $1,088
Fire risk 4/10 · Minor
- Est. fire insurance / yr
- $610 – $1,132
Heat risk 9/10 · Severe
- Hot days now (above 116°F)
- 7 days/yr
- Hot days in 30 yrs
- 16 days/yr
Wind risk 1/10 · Minimal
- Chance of severe wind over 30 yrs
- —
Air-quality risk 1/10 · Minimal
- Unhealthy air days now
- 0 days/yr
- Unhealthy air days in 30 yrs
- 0 days/yr
Risk factors via First Street. Map © Google.
Why this score? — see what drove the B- grade
The composite is a weighted blend of 9 inputs, each scored 0–100. Each bar is that input's sub-score; the figure is the points it added to the 100-point composite (weight × sub-score).
- Cash flow +30.0/30.0
- 1% rule +10.0/10.0
- DSCR +10.0/10.0
- ARV discount +7.5/15.0
- Livability +3.2/5.0
- Condition / age +2.5/5.0
- Rent growth +2.3/5.0
- Schools +1.6/10.0
- Appreciation +0.0/10.0
$90,000
🖨 Deal sheet 📄 Offer letter ✓ Due diligence
Listing remarks
SELLER MOTIVATED! Investor opportunity in Bullhead City. This property is being sold AS-IS and is CASH ONLY. Great potential for investors or buyers looking for a project. Property will require repairs and updates. 2 full length patios with easy access to the backyard! Conveniently located just minutes from Laughlin casinos, the Colorado River, boating, dining, and entertainment, this property offers easy access to everything the tri-state area has to offer.
Key facts
- Full length patios
- 6,970 sq ft lot
- 2 garage spots
Tags
Property features AI
Finance
- Other: Located in Holiday Highlands subdivision; Cross streets: Clover Ln & Baseline
Exterior
- Parking: Attached 2-car garage
- Utilities: Electricity available; Natural gas available; Public sewer
- Home design: Manufactured home (double wide); Residential property; Fixer condition; Entry with ceiling fan and tile counters; Facing information not provided
- Construction: Roof: Other
- Exterior features: Covered patio; Patio; Block and chain link fencing; Corner lot
Interior
- Kitchen: Dishwasher; Gas oven; Gas range; Refrigerator
- Flooring: Carpet; Wood
- Bathrooms: 1 full bathroom; 1 three-quarter bathroom
- Heating & cooling: Central heating (natural gas); Central air; Evaporative cooling; Ceiling fans
- Interior features: Ceiling fans; Tile countertops
- Laundry & utility: Electric dryer hookup
Neighborhood map
What this means for you Summary
Snapshot
- This is a 2-bed/2.0-bath land listed at $90k.
Deal economics
- At list price, monthly cash flow is $669 ($8k/yr) — positive.
- The deal already cash-flows at list — no discount required.
- Meets the 1% rule at list price ($2k rent vs $90k).
- Cap rate 15.2% vs local median 3.7% in Bullhead City — top-decile yield for the area; either an underpriced asset or a hidden risk that comps aren't pricing in. Stress-test before assuming the spread holds.
Location & tenants
- Location reads 64/100 on livability (#103 in AZ) — a middle-class / working-renter tenant base. Strengths: cost of living A+, housing A+; Watch: health & safety C-, employment D, schools F.
- Bullhead City School District (4378) (town): math 16% / reading 22% proficiency, ranked #189 of 249 in AZ (top 76%) — low school quality limits family demand, transient renter base, plan for 1-2y turnover; 68% free/reduced lunch — lower-income household profile, screen leases tightly.
- Market conditions: Rents soft (-0.9%/yr); 710 active listings in the ZIP; 24 comparable units currently listed for rent nearby; rentals leasing fast (median 13d on market — plan ~1-2 weeks tenant-placement turnaround); 2,543 units permitted in Mohave County in 2024 (33 in 5+ unit buildings).
- This rent runs 38% of the median local income ($48k/yr) — at the standard rent-burdened threshold; future hikes will face affordability resistance.
Forward outlook
- Local home prices are declining (-3.0%/yr); year-one equity from $622 of loan paydown is wiped out by about $3k of value loss. Plan a longer hold.
- Mohave County population projected to shrink 6% by 2050 — rents likely to lag national; underwrite the cash flow, not the appreciation.
- At projected returns (-3.0% appreciation + 0.0% rent growth), your $25k cash investment doubles in ~5 years — after that, you're playing with house money.
Negotiation context
- Only 9 days on market — expect competitive offers; lowballing is unlikely to land.
- Current owner paid $45k; list at $90k implies a 100% gain — meaningful room to come down on a strong offer.
Risks & watch-outs
- Climate carrying-cost: extreme-heat days projected 7→16/yr by 2055 (HVAC capex compounding) — expect insurance premiums to compound above CPI over the hold.
Questions for the listing agent
- Built in 1970 — when were the roof, HVAC, electrical panel, plumbing, and water heater last replaced?
- Is there a deadline driving the sale (1031 exchange, divorce, estate, relocation)? That informs how much negotiation room exists.
- Schools are F-rated, which usually means shorter tenancies and higher turnover. Who's the typical renter profile here, and what's been the actual vacancy rate?
- Crime grade is D in this area — have there been break-ins, vandalism, or insurance claims at this property in the last 3 years? What carrier currently insures it and at what premium?
- What's the average days-on-market for RENTAL listings here right now (not sales)? A rising rental-DOM trend means longer vacancies and softer asking-rent achievability than the comps imply.
- What's the recent tenant-quality profile in this submarket — average credit score on applications, eviction rate, late-payment / NSF rate, and stable-employment percentage? A property-management company in the area should have these aggregated.
- How much new for-sale + rental construction is in the pipeline within 1–3 miles? Heavy new supply typically softens prices + rents 12–24 months out; constrained supply supports both.
Investment metrics
- 1% rule
- 1.70% ✓
- Cap rate
- 15.21%
- Cash-on-cash
- 31.84%
- DSCR
- 2.42
- GRM
- 4.9
CMA / ARV
No comps found within radius.
Projected returns pro-forma
-3.0% appreciation · 0.0% rent growth · sell at horizon
- IRR
- 23.6%
- Equity multiple
- 1.93×
- Total profit
- $23,503
- Equity at exit
- $13,419
- IRR
- 29.6%
- Equity multiple
- 3.30×
- Total profit
- $57,905
- Equity at exit
- $7,782
Cash invested: $25,200 (down + closing). Projections, not guarantees.
Landlord ↔ Tenant lean methodology
- Overall (STATE)
- 87 Strongly Landlord-Friendly
- State Arizona
- 87 Strongly Landlord-Friendly · R+3
- County
- — inherits STATE
- City
- — inherits STATE
ZIP-level market 86442
- Home prices YoY
- -27.0%
- Rents YoY
- -0.9%
- Active inventory
- 710
- Price-to-rent
- 4.9×
Monthly cashflow live
- Estimated rent
- $1,526 high interval (Pro) →
- Mortgage (P&I)
- −$472
- Tax from tax record
- −$27 /mo · $327/yr
- Insurance
- −$38
- HOA
- −$0
- Vacancy / Maint / Mgmt
- −$320
- Net cashflow
- $669
Break-even live
UW: 25.0% down · 7.5% · 30yr · 1.5% tax · 5.0% vac · 8.0% maint · 8.0% mgmt
Financing live
Cash to close
- Down payment
- $22,500
- Closing costs
- $2,700
- Reserves months
- —
- Total cash needed
- —
Loan-product check · same deal, 3 products live
Conventional
25% down · 7.5% · 30yr
- Down + closing
- —
- Monthly P&I
- —
- Monthly cashflow
- —
- DSCR
- —
- Eligible?
- —
Personal DTI + credit; lowest rate.
DSCR
20% down · 8.5% · 30yr
- Down + closing
- —
- Monthly P&I
- —
- Monthly cashflow
- —
- DSCR
- —
- Eligible?
- —
No personal income docs; deal must DSCR.
Hard money
10% down · 12.0% · 12mo
- Down + closing
- —
- Monthly P&I
- —
- Monthly cashflow
- —
- DSCR
- —
- Eligible?
- —
Short-term bridge; refi at stabilization.
Rent comps 24 comps
| Address | Beds | Baths | Sqft | Rent | $/sqft | DOM | Units | Dist |
|---|---|---|---|---|---|---|---|---|
| 1066 Mobile Ln Bullhead City, AZ | 2.0 | 2.0 | 931 | $1,250 | $1.34 | 13d | 1 | 0.24mi |
| 945 Holly St Bullhead City, AZ | 2.0 | 1.0 | 967 | $1,295 | $1.34 | 13d | 1 | 0.26mi |
| 1044 Paradise Dr Bullhead City, AZ | 3.0 | 1.5 | 1320 | $1,450 | $1.10 | 13d | 1 | 0.48mi |
| 813 Gemstone Ave Bullhead City, AZ | 2.0 | 2.0 | 1000 | $1,200 | $1.20 | 13d | 1 | 0.49mi |
| 1344 Park Ln Bullhead City, AZ | 2.0 | 2.0 | 1400 | $1,500 | $1.07 | 13d | 1 | 0.56mi |
| 1389 Trane Rd Bullhead City, AZ | 3.0 | 2.0 | 1409 | $2,050 | $1.45 | 13d | 1 | 0.56mi |
| 1340 Gemstone Ave Bullhead City, AZ | 2.0 | 1.0 | 1260 | $1,800 | $1.43 | 13d | 1 | 0.57mi |
| 652 Holly St Bullhead City, AZ | 3.0 | 2.0 | 1200 | $1,500 | $1.25 | 13d | 1 | 0.74mi |
| 548 Ramar Rd Bullhead City, AZ | 2.0 | 2.0 | 949 | $1,400 | $1.48 | 13d | 1 | 0.97mi |
| 546 Roadrunner Dr Bullhead City, AZ | 3.0 | 2.0 | 922 | $1,300 | $1.41 | 13d | 1 | 1.01mi |
| 405 Anna Cir Unit A Bullhead City, AZ | 3.0 | 2.0 | 1076 | $1,350 | $1.25 | 13d | 1 | 1.22mi |
| 1800 Club House Dr Unit K90 Bullhead City, AZ | 2.0 | 1.5 | 1156 | $1,800 | $1.56 | 13d | 1 | 1.23mi |
| 384 Anna Cir Apt A Bullhead City, AZ | 2.0 | 1.5 | 1515 | $1,350 | $0.89 | 13d | 1 | 1.24mi |
| 1800 Club House Dr Unit 28 Bullhead City, AZ | 2.0 | 2.0 | 1174 | $2,500 | $2.13 | 13d | 1 | 1.25mi |
| 437 Riverfront Dr Unit 6 Bullhead City, AZ | 2.0 | 1.5 | 1392 | $2,400 | $1.72 | 21d | 1 | 1.26mi |
| 437 Riverfront Dr Unit 4 Bullhead City, AZ | 2.0 | 1.0 | 1080 | $1,650 | $1.53 | 21d | 1 | 1.26mi |
| 437 Riverfront Dr #5 Bullhead City, AZ | 2.0 | 2.0 | 1362 | $2,600 | $1.91 | 21d | 1 | 1.26mi |
| 1453 Luna Ln Bullhead City, AZ | 2.0 | 1.0 | 1050 | $1,500 | $1.43 | 13d | 1 | 1.30mi |
| 3800 Desert Marina Dr #164 Laughlin, NV | 1.0 | 1.0 | 1025 | $850 | $0.83 | 43d | 1 | 1.43mi |
| 363 Rio Grande Ct Bullhead City, AZ | 2.0 | 2.0 | 940 | $950 | $1.01 | 12d | 1 | 1.45mi |
| 1825 E Shore Villas Dr #34 Bullhead City, AZ | 3.0 | 3.0 | 1712 | $2,200 | $1.29 | 13d | 1 | 1.45mi |
| 1486 Plata Dr Bullhead City, AZ | 3.0 | 2.0 | 1242 | $1,800 | $1.45 | 13d | 1 | 1.47mi |
| 346 Rio Grande Ct Bullhead City, AZ | 2.0 | 2.0 | 1030 | $1,200 | $1.17 | 1d | 1 | 1.49mi |
| 1225 Verano Dr Bullhead City, AZ | 3.0 | 2.0 | 1650 | $1,450 | $0.88 | 13d | 1 | 1.50mi |
Listing history 6 events
-
2026-06-02status $90,000 Pending 9 DOM
-
2026-06-01days on market $90,000 Active 9 DOM
-
2026-05-31days on market $90,000 Active 8 DOM
-
2026-05-30days on market $90,000 Active 7 DOM
-
2026-05-23$90,000 Active
-
1995-10-30soldstatus $45,000
ⓘ Source: listings_history table (triggers on properties + properties_extension) + one-shot
backfill from property_details.listing_events for pre-trigger history.
Tax reassessment forecast AZ · Resets to sale price
- Current annual tax
- $327 · $27/mo
- Projected year-2 tax
- $594 · $50/mo
- Expected delta
- +$267/yr (+$22/mo · 81.6%)
ⓘ Screening estimate from a state-policy table — verify with the county assessor before closing.
Climate risk First Street
- Flood 1/10 Low FEMA zone X (unshaded) · 0% chance over 30 yrs
- Wildfire 4/10 Moderate
- Heat 9/10 Extreme 7 d/yr ≥116°F today · 16 d/yr by 30 yrs out
- Wind 1/10 Low
- Air quality 1/10 Low 0 unhealthy d/yr today · 0 by 30 yrs out
Nearby sold comps map
Loading sold comps map…
Walkable amenities ~0.75 mi
Loading nearby amenities…
Taxation est. · year 1
- Rental income
- $18,310
- − Mortgage interest
- −$5,041
- − Property taxes
- −$327
- − Insurance
- −$450
- − Repairs & maintenance
- −$1,465
- − Management
- −$1,465
- − Depreciation
- −$2,618
- Taxable income
- $6,944
- Est. tax owed @ 24.0%
- −$1,666
- After-tax cash flow
- $6,358/yr
For passive investors: Depreciation is non-cash, so a rental often shows a tax loss while cash-flowing — sheltering income. Rental losses are passive: they offset passive income freely, and up to $25,000/yr can offset ordinary (W-2) income if you actively participate and your MAGI is under $100k (phasing out to $0 by $150k); unused losses carry forward. On sale, claimed depreciation is recaptured at up to 25%, and gains may owe capital-gains tax (a 1031 exchange can defer both). Figures are a year-1 estimate at your 24.0% rate — not tax advice; consult a CPA.
Schools (NCES district)
- District
- Bullhead City School District (4378)
- NCES district ID
- 0401500
- Math proficiency
- 16% ▼ -11.00%
- Reading proficiency
- 22% ▼ -6.00%
- Median HH income
- $37,109
- Composite
- 15.83/100
- National rank
- #9263
- State rank
- #189 of 249 in AZ
Livability — Bullhead City
- Score
- 64/100
- State rank
- #103
- US rank
- #14458
Category grades
Schools grade is shown separately in the Schools card above.
Census & demographics
- Census place
- Bullhead City, AZ
- County
- Mohave County · 181,906 people
- City population
- 43,354
- Metro
- Lake Havasu City-Kingman, AZ
- Population (ZIP)
- 34,735
- Household income
- $48,081
- Rent vs Own
- Severe rent burden
- 1040.0
Population outlook (Mohave County) Hauer SSP2
- Today (2025)
- 209,184 people
- By 2030
- 209,674 · +0.2%
- By 2040
- 205,897 · -1.6%
- By 2050
- 196,810 · -5.9%
- By 2075
- 169,454 · -19.0%
- By 2100
- 136,630 · -34.7%
Race, ethnicity, and origin ACS 2023
- Neighborhood character
- Predominantly White (68%)
- Race & ethnicity
- White 68% Hispanic / Latino 22% Two or more races 12% Black 2% Asian 2%
- Hispanic origin (detail)
- Mexican 19%
- Common ancestry
- Portuguese 3% Romanian 2% Lithuanian 2%
- Foreign-born
- 9% · Canada, South Korea
- Languages at home
- 87% English-only · Spanish 11%
Political lean MEDSL · Mohave
- 2024 margin
- Solid R (+55.8) · D 21.8% · R 77.6%
- 2008→2024 swing
- -22.9pp toward R · 2008: -32.9pp · 2024: -55.8pp
- All cycles
- 2024: R+55.8 2020: R+51.3 2016: R+51.5 2012: R+42.6 2008: R+32.9
Not yet ingested
- Civics
- —
Market trends
- HPI YoY
- ▼ -100.11%
- Current HPI
- 270.3297
- Rent YoY
- ▼ -0.90%
- Metro
- Lake Havasu City-Kingman, AZ
- State GDP YoY
- ▲ 4.54%
- F500 in state
- 20
Industry mix (Fortune 500 HQ in AZ)
| Industry | F500 HQs | Revenue |
|---|---|---|
| Technology | 2 | $13B |
|
||
| Mining / Metals | 1 | $23B |
|
||
| Environmental Services | 1 | $16B |
|
||
| Metals / Steel | 1 | $14B |
|
||
| Technology Distribution | 1 | $9B |
|
||
| Homebuilding | 1 | $8B |
|
||
Price history
+100.0% since first listed2 events — show timeline
- 2026-05-23 Listed $90,000 WARDEX
- 1995-10-30 Sold (Public Records) $45,000 Public Records
Property tax history
+3.7%/yrLatest (2025): $327 · +3.3% YoY. Source: county tax records.
Cash-flow waterfall
monthlySold comps — $/sqft
last 12 mo · ≤1 miLoading sold comps…