18051 Biscayne Blvd #1504 · Aventura, FL
Flood risk 8/10 · Major
- FEMA flood zone
- AE
- Chance of flooding over 30 yrs
- 0.96%
- Est. flood insurance / yr
- $1,737 – $8,500
Fire risk 1/10 · Minimal
- Est. fire insurance / yr
- $947 – $1,759
Heat risk 10/10 · Severe
- Hot days now (above 104°F)
- 7 days/yr
- Hot days in 30 yrs
- 28 days/yr
Wind risk 10/10 · Severe
- Chance of severe wind over 30 yrs
- 99.0%
Air-quality risk 2/10 · Minimal
- Unhealthy air days now
- 1 days/yr
- Unhealthy air days in 30 yrs
- 2 days/yr
Risk factors via First Street. Map © Google.
Why this score? — see what drove the B- grade
The composite is a weighted blend of 9 inputs, each scored 0–100. Each bar is that input's sub-score; the figure is the points it added to the 100-point composite (weight × sub-score).
- Cash flow +24.1/30.0
- 1% rule +10.0/10.0
- DSCR +7.8/10.0
- ARV discount +7.5/15.0
- Appreciation +5.3/10.0
- Schools +4.2/10.0
- Livability +4.0/5.0
- Rent growth +2.7/5.0
- Condition / age +2.5/5.0
$269,000
🖨 Deal sheet (PDF) 📄 Offer letter ✓ Due diligence
Listing remarks
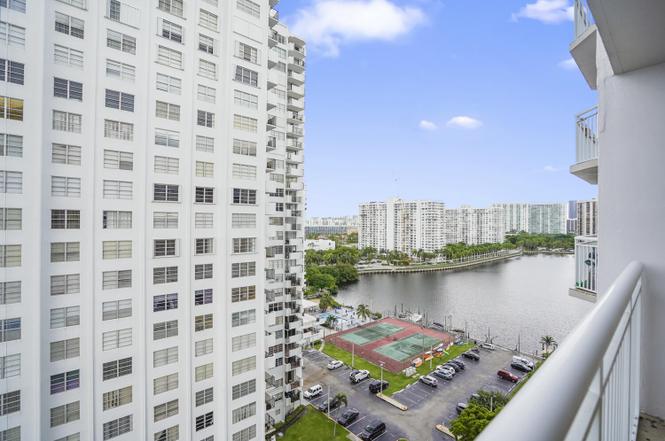
Discover the epitome of waterfront living in Aventura with this 2-bed, 2-bath condo spanning 1,605 sqft! Bathed in natural light, unit features a spacious wrap-around balcony provides stunning views. Recent renovations have elevated the building's amenities to a new level of luxury, including tennis courts, 2 swimming pools, a private marina with ocean access, on-site restaurant, gym, sauna, library, beauty salon, valet parking and even a convenience store! Perks include 24-hour security, a card room, party rooms, and a BBQ area. For convenience, residents can catch the free Aventura shuttle bus to nearby shopping, dining and the Aventura Mall. Monthly maintenance fees cover internet, basic
Key facts
- Wrap-around balcony
- Swimming pools
- Private marina
Tags
Property features AI
Finance
- Financial info: Pets not allowed
- HOA & community: Monthly association fee; Association amenities include clubhouse, elevators, fitness center, laundry, pool, sauna, tennis courts, on-site manager, bike storage, cafe/restaurant, internet included, library; Association includes cable TV, security, and hot water
Exterior
- Parking: Assigned parking
- Security: Gated community with guard
- Utilities: Cable available
- Home design: Condominium; Resale property; Faces east; 19-story building
- Construction: CBS construction
- Exterior features: Intracoastal waterfront
Interior
- Kitchen: Disposal; Dishwasher; Electric range; Microwave; Refrigerator
- Bedrooms: 2 bedrooms on the main level
- Flooring: Other
- Bathrooms: 2 full bathrooms on the main level
- Heating & cooling: Central electric heating; Central air conditioning; Ceiling fan(s)
- Interior features: Entrance foyer; Walk-in closet(s)
- Laundry & utility: Laundry available in the building
Neighborhood map
What this means for you Summary
Snapshot
- This is a 2-bed/2.0-bath condo listed at $269k.
Deal economics
- At list price, monthly cash flow is $105 ($1k/yr) — positive.
- The deal already cash-flows at list — no discount required.
- Meets the 1% rule at list price ($4k rent vs $269k).
- Recommended offer: $237k (12.0% below list) — sets the bar for market timing.
- Cap rate 8.7% vs local median 2.6% in Aventura — top-decile yield for the area; either an underpriced asset or a hidden risk that comps aren't pricing in. Stress-test before assuming the spread holds.
Location & tenants
- Location reads 80/100 on livability (#127 in FL, #1,834 nationally) — a professional / high-income tenant draw. Strengths: health & safety A+, amenities A, commute A; Watch: crime D+, cost of living F.
- Miami-Dade (suburban): math 45% / reading 54% proficiency, ranked #40 of 73 in FL (top 55%) — families likely to look elsewhere, expect single-tenant / working-renter base with shorter leases; 64% free/reduced lunch — lower-income household profile, screen leases tightly.
- Zoned schools: Aventura Waterways K-8 Center (math 56% / reading 65%, grade B-, #664 of 2,144 statewide, top 32%, 2,168 students, 32% FRL); Highland Oaks Middle School (math 28% / reading 51%, grade F, #373 of 571 statewide, top 66%, 774 students, 50% FRL); Dr. Michael M. Krop Senior High (math 21% / reading 46%, grade F, #400 of 667 statewide, top 61%, 2,235 students, 49% FRL) — zoned schools average 44% FRL vs 64% district-wide (20 pts lower); this property's tenant base skews higher-income than the district average.
- Market conditions: Rents flat; 1879 active listings in the ZIP; 10,051 units permitted in Miami-Dade County in 2024 (7,758 in 5+ unit buildings).
Forward outlook
- In year one you build about $3k of equity ($2k loan paydown + $1k appreciation (0.5% local appreciation)).
- Miami-Dade County population projected at +28% by 2050 — long-run rental-demand tailwind backs the buy-and-hold thesis.
- By year 9, paydown + projected appreciation supports a ~$33k cash-out refi (75% LTV) — recoverable capital for the next deal without selling this one.
Negotiation context
- It's been on market 170 days — a 12% lower offer ($237k) is reasonable based on typical stale-listing flexibility.
- 7 sale attempts since 3y ago; this cycle's ask is 11108% above the opening price — seller raised mid-cycle; expect resistance to lowballs.
- Current owner paid $155k; list at $269k implies a 74% gain — meaningful room to come down on a strong offer.
Risks & watch-outs
- Watch-outs: flood insurance adds $427/mo; HOA is 24% of rent.
- Climate carrying-cost: in FEMA flood zone AE (mandatory federal flood insurance); severe wind risk, 99% chance of damaging wind over 30y; extreme-heat days projected 7→28/yr by 2055 (HVAC capex compounding) — expect insurance premiums to compound above CPI over the hold.
Questions for the listing agent
- It's been on market 170 days. Have you received any prior offers? Is the seller open to a 12% concession, seller financing, or rate buy-down credit?
- Built in 1971 — when were the roof, HVAC, electrical panel, plumbing, and water heater last replaced?
- What's the actual annual flood-insurance premium (NFIP or private), and is the property in a SFHA with mandatory coverage?
- What does the HOA fee cover, when was the last increase, and are there any pending special assessments or reserve-fund shortfalls?
- Any open or pending special assessments — roof, HVAC, plumbing, elevator, façade? What's the per-unit balance and payoff schedule, and is the seller paying it off at close or rolling it to the buyer?
- Why hasn't it sold? Are there any deal-killer items the seller is aware of (foundation, flood, title, zoning, code violations)?
- Is there a deadline driving the sale (1031 exchange, divorce, estate, relocation)? That informs how much negotiation room exists.
- Schools are A-rated — typically a magnet for longer-tenancy family renters. What's the average tenant stay here, and is there a school-zone premium baked into asking?
- Crime grade is D in this area — have there been break-ins, vandalism, or insurance claims at this property in the last 3 years? What carrier currently insures it and at what premium?
- What's the average days-on-market for RENTAL listings here right now (not sales)? A rising rental-DOM trend means longer vacancies and softer asking-rent achievability than the comps imply.
- What's the recent tenant-quality profile in this submarket — average credit score on applications, eviction rate, late-payment / NSF rate, and stable-employment percentage? A property-management company in the area should have these aggregated.
- How much new apartment / multifamily construction is in the pipeline within 1–3 miles? Heavy new supply (>2% of stock underway) typically softens rents 12–24 months out; light construction supports rent growth.
Investment metrics
- 1% rule
- 1.62% ✓
- Cap rate
- 8.66%
- Cash-on-cash
- 8.47%
- DSCR
- 1.38
- GRM
- 5.1
CMA / ARV
No comps found within radius.
Projected returns pro-forma
0.53% appreciation · 0.94% rent growth · sell at horizon
- IRR
- -0.6%
- Equity multiple
- 0.97×
- Total profit
- $-2,343
- Equity at exit
- $85,271
- IRR
- 2.3%
- Equity multiple
- 1.25×
- Total profit
- $18,715
- Equity at exit
- $108,406
Cash invested: $75,320 (down + closing). Projections, not guarantees.
Landlord ↔ Tenant lean methodology
- Overall (STATE)
- 87 Strongly Landlord-Friendly
- State Florida
- 87 Strongly Landlord-Friendly · R+3
- County
- — inherits STATE
- City
- — inherits STATE
ZIP-level market 33160
- Home prices YoY
- 0.2%
- Rents YoY
- 0.9%
- Active inventory
- 1879
- Price-to-rent
- 5.1×
Monthly cashflow live
- Estimated rent
- $4,362 medium interval (Pro) →
- Mortgage (P&I)
- −$1,411
- Tax from tax record
- −$346 /mo · $4,151/yr
- Insurance
- −$112
- Flood insurance flood zone
- −$427 /mo · $5,118/yr
- HOA
- −$1,046
- Vacancy / Maint / Mgmt
- −$916
- Net cashflow
- $105
Break-even live
Sensitivity live
| Price | -10% $257 | -5% $181 | +0% $105 | +5% $29 | +10% $-47 |
|---|---|---|---|---|---|
| Rent | -10% $-240 | -5% $-67 | +0% $105 | +5% $277 | +10% $449 |
| Rate | -1.0pp $240 | -0.5pp $173 | base $105 | +0.5pp $35 | +1.0pp $-36 |
UW: 25.0% down · 7.5% · 30yr · 1.5% tax · 5.0% vac · 8.0% maint · 8.0% mgmt
Financing live
Cash to close
- Down payment
- $67,250
- Closing costs
- $8,070
- Reserves months
- —
- Total cash needed
- —
Loan-product check · same deal, 3 products live
Conventional
25% down · 7.5% · 30yr
- Down + closing
- —
- Monthly P&I
- —
- Monthly cashflow
- —
- DSCR
- —
- Eligible?
- —
Personal DTI + credit; lowest rate.
DSCR
20% down · 8.5% · 30yr
- Down + closing
- —
- Monthly P&I
- —
- Monthly cashflow
- —
- DSCR
- —
- Eligible?
- —
No personal income docs; deal must DSCR.
Hard money
10% down · 12.0% · 12mo
- Down + closing
- —
- Monthly P&I
- —
- Monthly cashflow
- —
- DSCR
- —
- Eligible?
- —
Short-term bridge; refi at stabilization.
HOA detail condo
- Monthly dues
- $1,046 · $12,552/yr
- Likely covers
- waterinternetpoolgymsecurity
- Assessments
- None detected in remarks — confirm with the listing agent.
Listing history 37 events
-
2026-06-21days on market $269,000 Active 170 DOM
-
2026-06-18days on market $269,000 Active 167 DOM
-
2026-06-17days on market $269,000 Active 166 DOM
-
2026-06-16days on market $269,000 Active 165 DOM
-
2026-06-15days on market $269,000 Active 164 DOM
-
2026-06-13days on market $269,000 Active 162 DOM
-
2026-06-09days on market $269,000 Active 158 DOM
-
2026-06-08days on market $269,000 Active 157 DOM
-
2026-06-07days on market $269,000 Active 156 DOM
-
2026-06-04days on market $269,000 Active 153 DOM
-
2026-06-03days on market $269,000 Active 152 DOM
-
2026-06-02days on market $269,000 Active 151 DOM
-
2026-06-01days on market $269,000 Active 150 DOM
-
2026-05-31days on market $269,000 Active 149 DOM
-
2026-05-16historical $2,400
-
2026-05-07$2,400
-
2026-01-02$269,000 Active
-
2026-01-01historical
-
2025-11-12price $274,999
-
2025-07-22historical $2,375
-
2025-07-07price $289,999
-
2025-06-05price $2,375
-
2025-05-20price $299,999
-
2025-05-13$2,400
-
2025-04-27historical $2,400
-
2025-04-15$2,400
-
2025-01-14$325,000 Active
-
2025-01-01historical
-
2024-01-04status Active
-
2023-12-30historical
-
2023-12-11price $325,000
-
2023-10-23price $335,000
-
2023-09-28$350,000 Active
-
2013-04-18soldstatus $155,000
-
2011-08-23soldstatus $115,000
-
1980-01-01soldstatus $80,000
-
1977-11-01soldstatus $40,000
ⓘ Source: listings_history table (triggers on properties + properties_extension) + one-shot
backfill from property_details.listing_events for pre-trigger history.
Tax reassessment forecast FL · Resets to sale price
- Current annual tax
- $4,151 · $346/mo
- Projected year-2 tax
- $4,151 · $346/mo
- Expected delta
- $0/yr ($0/mo · 0.0%)
ⓘ Screening estimate from a state-policy table — verify with the county assessor before closing.
Climate risk First Street
- Flood 8/10 Severe FEMA zone AE · 96% chance over 30 yrs
- Wildfire 1/10 Low
- Heat 10/10 Extreme 7 d/yr ≥104°F today · 28 d/yr by 30 yrs out
- Wind 10/10 Extreme 99% chance of damaging wind over 30 yrs
- Air quality 2/10 Low 1 unhealthy d/yr today · 2 by 30 yrs out
Nearby sold comps map
Loading sold comps map…
Walkable amenities ~0.75 mi
Loading nearby amenities…
Taxation est. · year 1
- Rental income
- $52,345
- − Mortgage interest
- −$15,068
- − Property taxes
- −$4,151
- − Insurance
- −$6,464
- − Repairs & maintenance
- −$4,188
- − Management
- −$4,188
- − HOA
- −$12,552
- − Depreciation
- −$7,825
- Taxable loss
- −$2,090
- Est. tax savings @ 24.0%
- +$502
- After-tax cash flow
- $1,760/yr
For passive investors: Depreciation is non-cash, so a rental often shows a tax loss while cash-flowing — sheltering income. Rental losses are passive: they offset passive income freely, and up to $25,000/yr can offset ordinary (W-2) income if you actively participate and your MAGI is under $100k (phasing out to $0 by $150k); unused losses carry forward. On sale, claimed depreciation is recaptured at up to 25%, and gains may owe capital-gains tax (a 1031 exchange can defer both). Figures are a year-1 estimate at your 24.0% rate — not tax advice; consult a CPA.
Schools (NCES district)
- District
- Miami-Dade
- NCES district ID
- 1200390
- Math proficiency
- 45% ▼ -16.00%
- Reading proficiency
- 54% ▼ -5.00%
- Median HH income
- $43,928
- Composite
- 41.76/100
- National rank
- #3397
- State rank
- #40 of 73 in FL
Livability — Aventura
- Score
- 80/100
- State rank
- #127
- US rank
- #1834
Category grades
Schools grade is shown separately in the Schools card above.
Census & demographics
- Census place
- Aventura, FL
- County
- Miami-Dade County · 2,697,751 people
- City population
- 90,324
- Metro
- Miami-Fort Lauderdale-Pompano Beach, FL
- Population (ZIP)
- 43,718
- Household income
- $67,040
- Rent vs Own
- Severe rent burden
- 3106.0
Population outlook (Miami-Dade County) Hauer SSP2
- Today (2025)
- 3,126,439 people
- By 2030
- 3,325,765 · +6.4%
- By 2040
- 3,697,561 · +18.3%
- By 2050
- 4,012,134 · +28.3%
- By 2075
- 4,605,612 · +47.3%
- By 2100
- 4,866,598 · +55.7%
Race, ethnicity, and origin ACS 2023
- Neighborhood character
- Diverse neighborhood (Simpson 0.59)
- Race & ethnicity
- Hispanic / Latino 46% White 44% Two or more races 27% Black 4% Asian 2%
- Hispanic origin (detail)
- Mexican 1% Puerto Rican 3% Cuban 8% Dominican 1% Salvadoran 4%
- Common ancestry
- Scotch-Irish 8% Hispanic 3% Subsaharan African 3%
- Foreign-born
- 61% · Canada, Jamaica, Dominican Republic
- Languages at home
- 29% English-only · Spanish 45% Russian/Polish/Slavic 12% Other Indo-European 5%
Political lean MEDSL · Miami-Dade
- 2024 margin
- R (+11.4) · D 43.9% · R 55.4%
- 2008→2024 swing
- -27.6pp toward R · 2008: 16.1pp · 2024: -11.4pp
- All cycles
- 2024: R+11.4 2020: D+7.3 2016: D+29.6 2012: D+23.7 2008: D+16.1
Not yet ingested
- Civics
- —
Market trends
- HPI YoY
- ▲ 0.53%
- Current HPI
- 284.9293
- Rent YoY
- ▲ 0.94%
- Metro
- Miami-Fort Lauderdale-Pompano Beach, FL
- State GDP YoY
- ▲ 3.28%
- F500 in state
- 36
Industry mix (Fortune 500 HQ in FL)
| Industry | F500 HQs | Revenue |
|---|---|---|
| Industrial Technology | 2 | $29B |
|
||
| Insurance | 2 | $17B |
|
||
| Retail | 1 | $60B |
|
||
| Technology Distribution | 1 | $58B |
|
||
| Homebuilding | 1 | $35B |
|
||
| Technology Manufacturing | 1 | $35B |
|
||
Price history
-94.0% since first listed23 events — show timeline
- 2026-05-16 Rental Removed $2,400 RMLSFL
- 2026-05-07 Listed for Rent $2,400 RMLSFL
- 2026-01-02 Listed $269,000 Beaches MLS
- 2026-01-01 Listing Removed — Beaches MLS
- 2025-11-12 Price Changed $274,999 Beaches MLS
- 2025-07-22 Rental Removed $2,375 RMLSFL
- 2025-07-07 Price Changed $289,999 Beaches MLS
- 2025-06-05 Price Changed $2,375 RMLSFL
- 2025-05-20 Price Changed $299,999 Beaches MLS
- 2025-05-13 Listed for Rent $2,400 RMLSFL
- 2025-04-27 Rental Removed $2,400 RMLSFL
- 2025-04-15 Listed for Rent $2,400 RMLSFL
- 2025-01-14 Listed $325,000 Beaches MLS
- 2025-01-01 Listing Removed — Beaches MLS
- 2024-01-04 Relisted — Beaches MLS
- 2023-12-30 Listing Removed — Beaches MLS
- 2023-12-11 Price Changed $325,000 Beaches MLS
- 2023-10-23 Price Changed $335,000 Beaches MLS
- 2023-09-28 Listed $350,000 Beaches MLS
- 2013-04-18 Sold (Public Records) $155,000 Public Records
- 2011-08-23 Sold (Public Records) $115,000 Public Records
- 1980-01-01 Sold (Public Records) $80,000 Public Records
- 1977-11-01 Sold (Public Records) $40,000 Public Records
Property tax history
+4.8%/yrLatest (2025): $4,151 · +1.8% YoY. Source: county tax records.
Cash-flow waterfall
monthlySold comps — $/sqft
last 12 mo · ≤1 miLoading sold comps…