 🔨 Auction
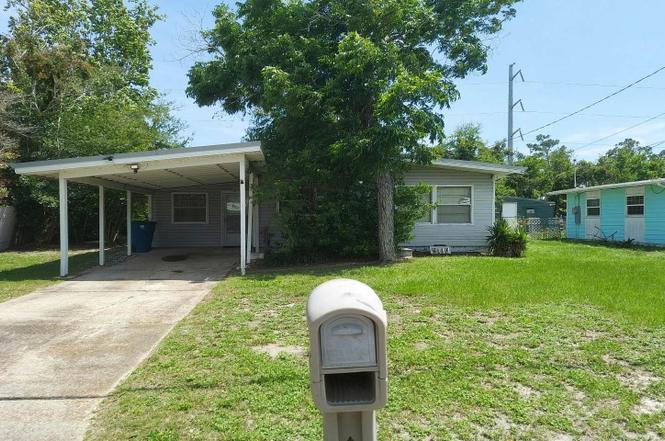
3113 W 20th Ct · Panama City, FL
Flood risk 4/10 · Minor
- FEMA flood zone
- A
- Chance of flooding over 30 yrs
- 0.17%
- Est. flood insurance / yr
- $1,009 – $1,996
Fire risk 1/10 · Minimal
- Est. fire insurance / yr
- $947 – $1,759
Heat risk 10/10 · Severe
- Hot days now (above 106°F)
- 7 days/yr
- Hot days in 30 yrs
- 21 days/yr
Wind risk 9/10 · Severe
- Chance of severe wind over 30 yrs
- 99.0%
Air-quality risk 1/10 · Minimal
- Unhealthy air days now
- 0 days/yr
- Unhealthy air days in 30 yrs
- 0 days/yr
Risk factors via First Street. Map © Google.
Why this score? — see what drove the D- grade
The composite is a weighted blend of 9 inputs, each scored 0–100. Each bar is that input's sub-score; the figure is the points it added to the 100-point composite (weight × sub-score).
- Cash flow +9.4/30.0
- ARV discount +7.5/15.0
- Schools +4.3/10.0
- Livability +3.6/5.0
- 1% rule +2.8/10.0
- Rent growth +2.8/5.0
- DSCR +2.6/10.0
- Condition / age +2.5/5.0
- Appreciation +0.0/10.0
$5,000
🖨 Deal sheet 📄 Offer letter ✓ Due diligence
Listing remarks
Foreclosure Auction Ends June 25, 2026 at 12:00 PM EST. Discover this inviting 3-bedroom, 1-bathroom single-family home, offering a great opportunity in the desirable Panama City area. The list price is the opening bid for the online auction. Sold As-is. Explore more details and submit your bid through Federa.
Key facts
- Built 1959
Property features AI
Finance
- Other:
- Financial info:
- HOA & community:
Exterior
- Parking:
- Security:
- Utilities:
- Home design: Residential property; 1 story
- Construction:
- Exterior features: Lot approximately 0.24 acres; Zoned RLD 1
Interior
- Kitchen:
- Bedrooms:
- Flooring:
- Bathrooms: 1 full bathroom
- Heating & cooling:
- Interior features: Single-story interior
- Laundry & utility:
Neighborhood map
What this means for you Summary
Snapshot
- This is a 3-bed/1.0-bath single-family listed at $5k.
Deal economics
- At list price, monthly cash flow is $-280 ($-3k/yr) — negative.
- The deal already cash-flows at list — no discount required.
- Meets the 1% rule at list price ($2k rent vs $5k).
Location & tenants
- Location reads 72/100 on livability (#350 in FL) — a middle-class / working-renter tenant base. Strengths: cost of living A+, housing A+, health & safety A+; Watch: crime F, amenities F, commute F.
- Bay (suburban): math 51% / reading 51% proficiency, ranked #29 of 73 in FL (top 40%) — acceptable for families but not a draw, mixed tenant base, ~2y average lease.
- Market conditions: Rents rising (+1.2%/yr); 381 active listings in the ZIP; 10 comparable units currently listed for rent nearby; rentals at typical pace (median 21d on market — plan ~3-4 weeks tenant-placement turnaround); 2,473 units permitted in Bay County in 2024 (559 in 5+ unit buildings).
Forward outlook
- Local home prices are declining (-3.0%/yr); year-one equity from $2k of loan paydown is wiped out by about $7k of value loss. Plan a longer hold.
- Bay County population projected at +24% by 2050 — long-run rental-demand tailwind backs the buy-and-hold thesis.
Negotiation context
- Only 2 days on market — expect competitive offers; lowballing is unlikely to land.
- 2 sale attempts since 21y ago with the ask held roughly flat each time — persistent listings suggest the price (not the market) is what's stuck; bring a comps-based counter.
Risks & watch-outs
- Watch-outs: property tax is 65.1% of price; flood insurance adds $125/mo; built in 1959 — expect roof / HVAC / electrical / plumbing capex.
- Climate carrying-cost: in FEMA flood zone A (mandatory federal flood insurance); severe wind risk, 99% chance of damaging wind over 30y; extreme-heat days projected 7→21/yr by 2055 (HVAC capex compounding) — expect insurance premiums to compound above CPI over the hold.
Questions for the listing agent
- What do current leases actually rent for vs. the listed asking? Can we see a recent rent roll and the last 12 months of T-12 income?
- Built in 1959 — when were the roof, HVAC, electrical panel, plumbing, and water heater last replaced?
- Property tax is high relative to price — has the assessment been appealed recently, and will the sale trigger a re-assessment?
- What's the actual annual flood-insurance premium (NFIP or private), and is the property in a SFHA with mandatory coverage?
- Is there a deadline driving the sale (1031 exchange, divorce, estate, relocation)? That informs how much negotiation room exists.
- Schools are B-rated — typically a magnet for longer-tenancy family renters. What's the average tenant stay here, and is there a school-zone premium baked into asking?
- Crime grade is F in this area — have there been break-ins, vandalism, or insurance claims at this property in the last 3 years? What carrier currently insures it and at what premium?
- The area grade is low — what's the realistic commute time and amenity access for the typical tenant pool here? Any planned neighborhood developments (good or bad) we should know about?
- What's the average days-on-market for RENTAL listings here right now (not sales)? A rising rental-DOM trend means longer vacancies and softer asking-rent achievability than the comps imply.
- What's the recent tenant-quality profile in this submarket — average credit score on applications, eviction rate, late-payment / NSF rate, and stable-employment percentage? A property-management company in the area should have these aggregated.
- How much new for-sale + rental construction is in the pipeline within 1–3 miles? Heavy new supply typically softens prices + rents 12–24 months out; constrained supply supports both.
Investment metrics
- 1% rule
- 0.78% ✗
- Cap rate
- 5.43%
- Cash-on-cash
- -3.07%
- DSCR
- 0.86
- GRM
- 10.6
CMA / ARV
- ARV (on-the-fly)
- $216,980
- Comps found
- 12
Show comp detail 12 sales within ~0.75 mi
| Address | Dist | Beds/Ba | Sqft | Sold | Price | $/sf | Match |
|---|---|---|---|---|---|---|---|
| 2205 Forest Ave | 0.26mi | 3/1.5 | 1,090 (-5%) | 9mo | $205,000 | $188 | 70 |
| 3942 W 21st Pl | 0.52mi | 3/2.0 | 1,196 (+5%) | 7mo | $237,000 | $198 | 58 |
| 2003 Drummond Ave | 0.27mi | 3/2.0 | 1,242 (+9%) | 13mo | $225,000 | $181 | 58 |
| 3926 W 21st Pl | 0.47mi | 3/2.0 | 1,196 (+5%) | 10mo | $234,900 | $196 | 58 |
| 1903 Arthur Ave | 0.56mi | 3/1.0 | 1,069 (-6%) | 13mo | $185,000 | $173 | 52 |
| 1712 Wilmont Ave | 0.45mi | 3/1.0 | 1,211 (+6%) | 22mo | $230,000 | $190 | 51 |
| 1708 Lake Ave | 0.36mi | 2/1.0 (-1) | 1,000 (-12%) | 9mo | $110,000 | $110 | 50 |
| 1903 Chestnut Ave | 0.26mi | 3/2.0 | 1,300 (+14%) | 18mo | $180,000 | $138 | 45 |
| 1711 Wilmont Ave Unit 1/2 | 0.43mi | 3/2.0 | 1,040 (-9%) | 21mo | $180,000 | $173 | 43 |
| 2209 W 21st St | 0.68mi | 3/2.0 | 1,240 (+9%) | 19mo | $269,900 | $218 | 34 |
| 2305 Mound Ave | 0.75mi | 3/2.0 | 1,288 (+13%) | 15mo | $350,000 | $272 | 27 |
| 1517 Molitor Ave | 0.65mi | 3/2.0 | 1,292 (+13%) | 21mo | $319,000 | $247 | 26 |
Match score weights: distance 35% · size 25% · config 20% · recency 20%. Top-matched comps best support the ARV.
Projected returns pro-forma
-3.0% appreciation · 1.24% rent growth · sell at horizon
- IRR
- -27.9%
- Equity multiple
- 0.08×
- Total profit
- $-55,884
- Equity at exit
- $32,352
- IRR
- -35.4%
- Equity multiple
- -0.37×
- Total profit
- $-82,980
- Equity at exit
- $18,760
Cash invested: $60,754 (down + closing). Projections, not guarantees.
Landlord ↔ Tenant lean methodology
- Overall (STATE)
- 87 Strongly Landlord-Friendly
- State Florida
- 87 Strongly Landlord-Friendly · R+3
- County
- — inherits STATE
- City
- — inherits STATE
ZIP-level market 32405
- Rents YoY
- 1.2%
- Active inventory
- 381
- Price-to-rent
- 0.2×
Monthly cashflow live
- Estimated rent
- $1,702 high interval (Pro) →
- Mortgage (P&I)
- −$1,138
- Tax est. 1.5%
- −$271 /mo · $3,255/yr
- Insurance
- −$90
- Flood insurance flood zone
- −$125 /mo · $1,502/yr
- HOA
- −$0
- Vacancy / Maint / Mgmt
- −$357
- Net cashflow
- $-280
Break-even live
UW: 25.0% down · 7.5% · 30yr · 1.5% tax · 5.0% vac · 8.0% maint · 8.0% mgmt
Financing live
Cash to close
- Down payment
- $54,245
- Closing costs
- $6,509
- Reserves months
- —
- Total cash needed
- —
Loan-product check · same deal, 3 products live
Conventional
25% down · 7.5% · 30yr
- Down + closing
- —
- Monthly P&I
- —
- Monthly cashflow
- —
- DSCR
- —
- Eligible?
- —
Personal DTI + credit; lowest rate.
DSCR
20% down · 8.5% · 30yr
- Down + closing
- —
- Monthly P&I
- —
- Monthly cashflow
- —
- DSCR
- —
- Eligible?
- —
No personal income docs; deal must DSCR.
Hard money
10% down · 12.0% · 12mo
- Down + closing
- —
- Monthly P&I
- —
- Monthly cashflow
- —
- DSCR
- —
- Eligible?
- —
Short-term bridge; refi at stabilization.
Rent comps 10 comps
| Address | Beds | Baths | Sqft | Rent | $/sqft | DOM | Units | Dist |
|---|---|---|---|---|---|---|---|---|
| 3722 Burnham Way Panama City, FL | 3.0 | 2.0 | 1040 | $1,600 | $1.54 | 20d | 1 | 0.35mi |
| 1710 Drake Ave Panama City, FL | 3.0 | 2.0 | 1130 | $1,850 | $1.64 | 20d | 1 | 0.49mi |
| 4105 W 22nd St Unit 4105 Panama City, FL | 3.0 | 2.0 | 1000 | $1,395 | $1.40 | 20d | 1 | 0.59mi |
| 1804 Arthur Ave Panama City, FL | 3.0 | 1.5 | 1044 | $1,795 | $1.72 | 20d | 1 | 0.60mi |
| 1913 Laurel Ave Unit A Panama City, FL | 2.0 | 2.5 | 1238 | $1,725 | $1.39 | 13d | 1 | 0.60mi |
| 4324 W 20th St Panama City, FL | 1.0–3.0 | 1.0–2.5 | 1000 | $1,630 | $1.63 | 13d | 12 | 0.87mi |
| 4455 W 19th St #17 Panama City, FL | 2.0 | 1.5 | 1104 | $1,400 | $1.27 | 20d | 1 | 0.88mi |
| 2602 W 12th St Panama City, FL | 3.0 | 2.0 | 1400 | $2,095 | $1.50 | 20d | 1 | 1.09mi |
| 1301 Frankford Ave Apt B104 Panama City, FL | 2.0 | 1.0 | 780 | $1,000 | $1.28 | 13d | 1 | 1.12mi |
| 2100 W Beach Dr Unit F102 Panama City, FL | 2.0 | 1.0 | 970 | $1,700 | $1.75 | 20d | 1 | 1.50mi |
Listing history 3 events
-
2026-06-19days on market $5,000 Active 2 DOM
-
2026-06-17remarks 311-char remark
-
2026-06-17$5,000 Active 1 DOM
ⓘ Source: listings_history table (triggers on properties + properties_extension) + one-shot
backfill from property_details.listing_events for pre-trigger history.
Climate risk First Street
- Flood 4/10 Moderate FEMA zone A · 17% chance over 30 yrs
- Wildfire 1/10 Low
- Heat 10/10 Extreme 7 d/yr ≥106°F today · 21 d/yr by 30 yrs out
- Wind 9/10 Extreme 99% chance of damaging wind over 30 yrs
- Air quality 1/10 Low 0 unhealthy d/yr today · 0 by 30 yrs out
Nearby sold comps map
Loading sold comps map…
Walkable amenities ~0.75 mi
Loading nearby amenities…
Taxation est. · year 1
- Rental income
- $20,418
- − Mortgage interest
- −$12,154
- − Property taxes
- −$3,255
- − Insurance
- −$2,587
- − Repairs & maintenance
- −$1,633
- − Management
- −$1,633
- − Depreciation
- −$6,312
- Taxable loss
- −$7,157
- Est. tax savings @ 24.0%
- +$1,718
- After-tax cash flow
- $-1,648/yr
For passive investors: Depreciation is non-cash, so a rental often shows a tax loss while cash-flowing — sheltering income. Rental losses are passive: they offset passive income freely, and up to $25,000/yr can offset ordinary (W-2) income if you actively participate and your MAGI is under $100k (phasing out to $0 by $150k); unused losses carry forward. On sale, claimed depreciation is recaptured at up to 25%, and gains may owe capital-gains tax (a 1031 exchange can defer both). Figures are a year-1 estimate at your 24.0% rate — not tax advice; consult a CPA.
Schools (NCES district)
- District
- Bay
- NCES district ID
- 1200090
- Math proficiency
- 51% ▼ -8.00%
- Reading proficiency
- 51% ▼ -7.00%
- Median HH income
- $47,740
- Composite
- 43.41/100
- National rank
- #3014
- State rank
- #29 of 73 in FL
Livability — Panama City
- Score
- 72/100
- State rank
- #350
- US rank
- #5823
Category grades
Schools grade is shown separately in the Schools card above.
Census & demographics
- Census place
- Panama City, FL
- County
- Bay County · 163,593 people
- City population
- 91,445
- Metro
- Panama City, FL
- Population (ZIP)
- 29,984
- Household income
- $73,373
- Rent vs Own
- Severe rent burden
- 1008.0
Population outlook (Bay County) Hauer SSP2
- Today (2025)
- 206,264 people
- By 2030
- 217,740 · +5.6%
- By 2040
- 238,738 · +15.7%
- By 2050
- 255,545 · +23.9%
- By 2075
- 288,295 · +39.8%
- By 2100
- 288,638 · +39.9%
Race, ethnicity, and origin ACS 2023
- Neighborhood character
- Predominantly White (67%)
- Race & ethnicity
- White 67% Black 17% Two or more races 8% Hispanic / Latino 7% Native American 1%
- Hispanic origin (detail)
- Mexican 2% Puerto Rican 3%
- Common ancestry
- Slovak 4% Lithuanian 2% Romanian 2%
- Foreign-born
- 7% · Canada
- Languages at home
- 89% English-only · Spanish 6% Arabic 1% French/Haitian/Cajun 1%
Political lean MEDSL · Bay
- 2024 margin
- Solid R (+47.4) · D 25.8% · R 73.1% · Other 1.1%
- 2008→2024 swing
- -6.6pp toward R · 2008: -40.7pp · 2024: -47.4pp
- All cycles
- 2024: R+47.4 2020: R+43.5 2016: R+46.3 2012: R+43.6 2008: R+40.7
Not yet ingested
- Civics
- —
Market trends
- HPI YoY
- ▼ -217.88%
- Current HPI
- 262.7854
- Rent YoY
- ▲ 1.24%
- Metro
- Panama City, FL
- State GDP YoY
- ▲ 3.28%
- F500 in state
- 36
Industry mix (Fortune 500 HQ in FL)
| Industry | F500 HQs | Revenue |
|---|---|---|
| Industrial Technology | 2 | $29B |
|
||
| Insurance | 2 | $17B |
|
||
| Retail | 1 | $60B |
|
||
| Technology Distribution | 1 | $58B |
|
||
| Homebuilding | 1 | $35B |
|
||
| Technology Manufacturing | 1 | $35B |
|
||
Price history
-86.1% since first listed4 events — show timeline
- 2026-06-17 Listed $5,000 NFMLS
- 2021-12-14 Listing Removed — CPARMLS
- 2005-11-03 Listed $154,900 CPARMLS
- 1986-09-01 Sold (Public Records) $35,900 Public Records
Property tax history
+6.6%/yrLatest (2025): $1,968 · +7.4% YoY. Source: county tax records.
Cash-flow waterfall
monthlySold comps — $/sqft
last 12 mo · ≤1 miLoading sold comps…