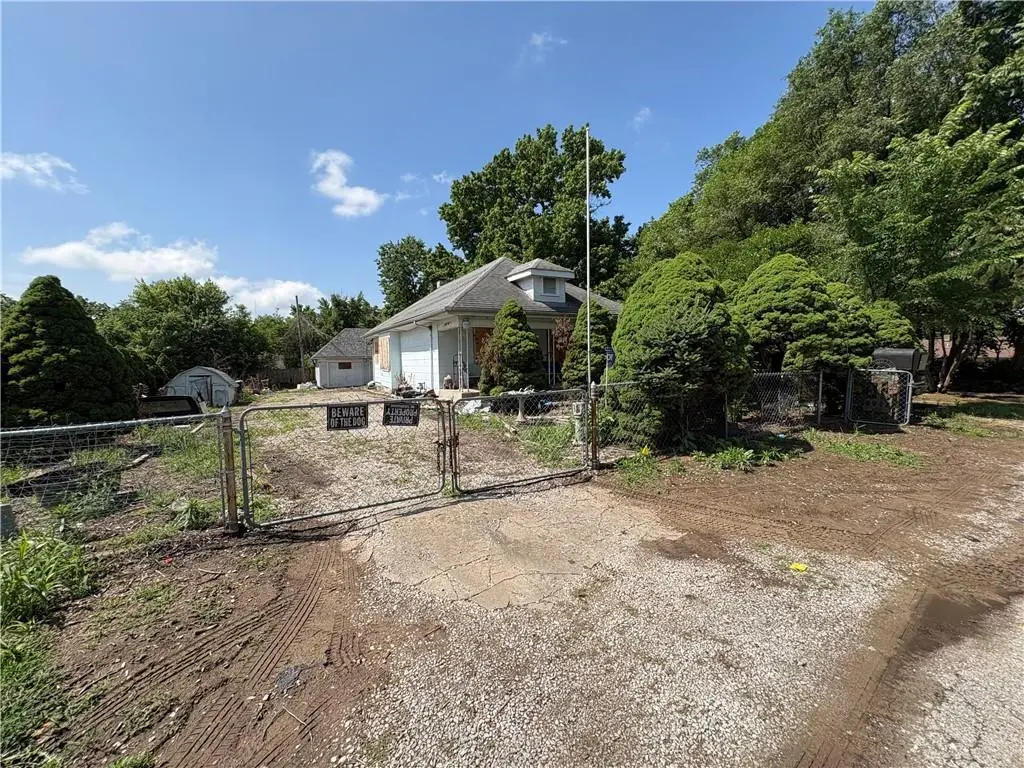
8617 Thompson Ave · Kansas City, MO
Flood risk 1/10 · Minimal
- FEMA flood zone
- X (unshaded)
- Chance of flooding over 30 yrs
- 0.0%
- Est. flood insurance / yr
- $473 – $860
Fire risk 1/10 · Minimal
- Est. fire insurance / yr
- $1,054 – $1,958
Heat risk 4/10 · Minor
- Hot days now (above 106°F)
- 7 days/yr
- Hot days in 30 yrs
- 17 days/yr
Wind risk 2/10 · Minimal
- Chance of severe wind over 30 yrs
- —
Air-quality risk 3/10 · Minor
- Unhealthy air days now
- 2 days/yr
- Unhealthy air days in 30 yrs
- 3 days/yr
Risk factors via First Street. Map © Google.
Why this score? — see what drove the B+ grade
The composite is a weighted blend of 9 inputs, each scored 0–100. Each bar is that input's sub-score; the figure is the points it added to the 100-point composite (weight × sub-score).
- Cash flow +30.0/30.0
- 1% rule +10.0/10.0
- DSCR +10.0/10.0
- Appreciation +10.0/10.0
- ARV discount +7.5/15.0
- Livability +3.9/5.0
- Rent growth +2.5/5.0
- Condition / age +2.5/5.0
- Schools +1.5/10.0
$50,000
🖨 Deal sheet 📄 Offer letter ✓ Due diligence
Listing remarks
This 2-bedroom, 1-bath bungalow in Kansas City is ready for its next chapter and offers the perfect canvas for those looking for their next real estate project. While the property needs a significant amount of cleaning out and updating, those with vision will appreciate the character and potential found throughout. Step inside to a traditional floor plan featuring a spacious living room that flows into the dining room and continues into the kitchen. Original woodwork and trim remain in the passageways, adding charm and preserving a piece of the home's history. The dining room is highlighted by a beautiful bay window that fills the space with natural light, while the front bedroom features a
Key facts
- Bay window
- Original woodwork
- Versatile bonus room
Tags
Property features AI
Finance
- Other: Lot approximately 9,089 square feet (per public records); Above-grade finished area reported as 1,016 (per public records)
- HOA & community: No association fees; Inside city limits
Exterior
- Parking: Detached 2-car garage; Additional garage structures on property
- Utilities: Public water; Public sewer
- Home design: Single-family residence (residential); Bungalow floor plan; Faces north
- Construction: Wood siding exterior; Composition roof; Approximately 101+ years old
- Exterior features: Deck; Metal fencing; Property listed as fixer
Interior
- Kitchen: Kitchen on the main level
- Bedrooms: 2 bedrooms on the main level
- Bathrooms: 1 full bathroom on the main level
- Heating & cooling: Forced air heating; No central air conditioning
- Interior features: Formal dining area; Recreation room; Basement (full, unfinished, inside entrance with walk-up access)
- Laundry & utility: Laundry located in the basement
Neighborhood map
What this means for you Summary
Snapshot
- This is a 2-bed/1.0-bath single-family listed at $50k.
Deal economics
- At list price, monthly cash flow is $498 ($6k/yr) — positive.
- The deal already cash-flows at list — no discount required.
- Meets the 1% rule at list price ($1k rent vs $50k).
- Cap rate 18.2% vs local median 3.9% in Kansas City — top-decile yield for the area; either an underpriced asset or a hidden risk that comps aren't pricing in. Stress-test before assuming the spread holds.
Location & tenants
- Location reads 78/100 on livability (#28 in MO, #2,671 nationally) — a middle-class / working-renter tenant base. Strengths: amenities A+, commute A+, cost of living A+; Watch: schools C-, crime F.
- Kansas City 33 (urban): math 12% / reading 24% proficiency, ranked #308 of 324 in MO (top 95%) — low school quality limits family demand, transient renter base, plan for 1-2y turnover; 75% free/reduced lunch — lower-income household profile, screen leases tightly.
- Market conditions: 12 active listings in the ZIP; 9 comparable units currently listed for rent nearby; rentals lingering (median 44d on market — plan ~5-8 weeks vacancy on turnover, expect pricing pressure); 56% of comp listings sitting > 30 days — soft ceiling on asking rent; 4,002 units permitted in Jackson County in 2024 (2,271 in 5+ unit buildings).
Forward outlook
- In year one you build about $5k of equity ($346 loan paydown + $5k appreciation (10.0% local appreciation)).
- Jackson County population projected at +4% by 2050 — modest demand growth; plan on rents tracking national, not racing it.
- At projected returns (10.0% appreciation + 3.0% rent growth), your $14k cash investment doubles in ~2 years — after that, you're playing with house money.
- By year 6, paydown + projected appreciation supports a ~$31k cash-out refi (75% LTV) — recoverable capital for the next deal without selling this one.
Negotiation context
- Only 7 days on market — expect competitive offers; lowballing is unlikely to land.
Risks & watch-outs
- Watch-outs: built in 1915 — expect roof / HVAC / electrical / plumbing capex.
Questions for the listing agent
- Built in 1915 — when were the roof, HVAC, electrical panel, plumbing, and water heater last replaced?
- Is there a deadline driving the sale (1031 exchange, divorce, estate, relocation)? That informs how much negotiation room exists.
- Crime grade is F in this area — have there been break-ins, vandalism, or insurance claims at this property in the last 3 years? What carrier currently insures it and at what premium?
- What's the average days-on-market for RENTAL listings here right now (not sales)? A rising rental-DOM trend means longer vacancies and softer asking-rent achievability than the comps imply.
- What's the recent tenant-quality profile in this submarket — average credit score on applications, eviction rate, late-payment / NSF rate, and stable-employment percentage? A property-management company in the area should have these aggregated.
- How much new for-sale + rental construction is in the pipeline within 1–3 miles? Heavy new supply typically softens prices + rents 12–24 months out; constrained supply supports both.
Investment metrics
- 1% rule
- 2.15% ✓
- Cap rate
- 18.23%
- Cash-on-cash
- 42.65%
- DSCR
- 2.90
- GRM
- 3.9
CMA / ARV
- ARV (on-the-fly)
- $106,680
- Comps found
- 10
Show comp detail 10 sales within ~0.75 mi
| Address | Dist | Beds/Ba | Sqft | Sold | Price | $/sf | Match |
|---|---|---|---|---|---|---|---|
| 716 Lewis Ave | 0.21mi | 3/1.0 (+1) | 1,062 (+4%) | 8mo | $49,000 | $46 | 71 |
| 8715 E Roberts St | 0.13mi | 3/1.5 (+1) | 1,056 (+4%) | 12mo | $20,000 | $19 | 71 |
| 8806 E Smart Ave | 0.23mi | 2/1.0 | 908 (-11%) | 6mo | $95,000 | $105 | 66 |
| 8919 E Independence Ave | 0.36mi | 2/1.0 | 988 (-3%) | 20mo | $140,000 | $142 | 62 |
| 578 S Oxford Ave | 0.74mi | 3/1.0 (+1) | 990 (-3%) | 2mo | $89,000 | $90 | 54 |
| 8907 E Smart Ave | 0.36mi | 3/1.0 (+1) | 936 (-8%) | 17mo | $115,000 | $123 | 51 |
| 702 Utley Ave | 0.29mi | 2/2.0 | 926 (-9%) | 21mo | $44,500 | $48 | 50 |
| 327 S Kentucky Ave | 0.43mi | 2/1.0 | 898 (-12%) | 23mo | $110,000 | $122 | 42 |
| 548 S Brookside Ave | 0.67mi | 2/1.0 | 875 (-14%) | 17mo | $45,000 | $51 | 32 |
| 531 S Brookside Ave | 0.70mi | 3/2.0 (+1) | 1,133 (+12%) | 12mo | $165,000 | $146 | 29 |
Match score weights: distance 35% · size 25% · config 20% · recency 20%. Top-matched comps best support the ARV.
Projected returns pro-forma
10.0% appreciation · 3.0% rent growth · sell at horizon
- IRR
- 57.4%
- Equity multiple
- 5.21×
- Total profit
- $58,941
- Equity at exit
- $45,044
- IRR
- 50.9%
- Equity multiple
- 11.62×
- Total profit
- $148,688
- Equity at exit
- $97,139
Cash invested: $14,000 (down + closing). Projections, not guarantees.
Landlord ↔ Tenant lean methodology
- Overall (STATE)
- 81 Strongly Landlord-Friendly
- State Missouri
- 81 Strongly Landlord-Friendly · R+10
- County
- — inherits STATE
- City
- — inherits STATE
ZIP-level market 64125
- Home prices YoY
- 3.1%
- Active inventory
- 12
- Price-to-rent
- 3.9×
Monthly cashflow live
- Estimated rent
- $1,073 high interval (Pro) →
- Mortgage (P&I)
- −$262
- Tax from tax record
- −$67 /mo · $801/yr
- Insurance
- −$21
- HOA
- −$0
- Vacancy / Maint / Mgmt
- −$225
- Net cashflow
- $498
Break-even live
UW: 25.0% down · 7.5% · 30yr · 1.5% tax · 5.0% vac · 8.0% maint · 8.0% mgmt
Financing live
Cash to close
- Down payment
- $12,500
- Closing costs
- $1,500
- Reserves months
- —
- Total cash needed
- —
Loan-product check · same deal, 3 products live
Conventional
25% down · 7.5% · 30yr
- Down + closing
- —
- Monthly P&I
- —
- Monthly cashflow
- —
- DSCR
- —
- Eligible?
- —
Personal DTI + credit; lowest rate.
DSCR
20% down · 8.5% · 30yr
- Down + closing
- —
- Monthly P&I
- —
- Monthly cashflow
- —
- DSCR
- —
- Eligible?
- —
No personal income docs; deal must DSCR.
Hard money
10% down · 12.0% · 12mo
- Down + closing
- —
- Monthly P&I
- —
- Monthly cashflow
- —
- DSCR
- —
- Eligible?
- —
Short-term bridge; refi at stabilization.
Rent comps 9 comps
| Address | Beds | Baths | Sqft | Rent | $/sqft | DOM | Units | Dist |
|---|---|---|---|---|---|---|---|---|
| 8705 E Smart Ave Independence, MO | 2.0 | 1.0 | 750 | $1,000 | $1.33 | 43d | 1 | 0.13mi |
| 576 S Oxford Ave Independence, MO | 3.0 | 2.0 | 1098 | $1,400 | $1.28 | 43d | 1 | 0.74mi |
| 600 S Glenwood Ave Unit F Independence, MO | 2.0 | 1.0 | 750 | $995 | $1.33 | 19d | 1 | 0.78mi |
| 600 S Glenwood Ave Unit I Independence, MO | 1.0 | 1.0 | 700 | $695 | $0.99 | 43d | 1 | 0.79mi |
| 100 S Oxford Ave Independence, MO | 3.0 | 2.0 | 1141 | $1,425 | $1.25 | 44d | 1 | 0.83mi |
| 1138 S Glenwood Ave Independence, MO | 2.0 | 1.0 | 1180 | $1,095 | $0.93 | 19d | 1 | 0.97mi |
| 9528 E Winner Rd Independence, MO | 1.0–3.0 | 1.0 | 730 | $999 | $1.37 | 43d | 1 | 1.00mi |
| 611 Ewing Ave Unit B Kansas City, MO | 1.0 | 1.0 | 700 | $800 | $1.14 | 23d | 1 | 1.16mi |
| 10104 E Golf Ave Independence, MO | 3.0 | 2.0 | 1205 | $1,395 | $1.16 | 14d | 1 | 1.25mi |
Listing history 7 events
-
2026-06-09status $50,000 Pending 7 DOM
-
2026-06-08days on market $50,000 Active 7 DOM
-
2026-06-07days on market $50,000 Active 6 DOM
-
2026-06-05days on market $50,000 Active 3 DOM
-
2026-06-03days on market $50,000 Active 2 DOM
-
2026-06-02remarks 699-char remark
-
2026-06-02$50,000 Active 1 DOM
ⓘ Source: listings_history table (triggers on properties + properties_extension) + one-shot
backfill from property_details.listing_events for pre-trigger history.
Tax reassessment forecast MO · Resets to sale price
- Current annual tax
- $801 · $67/mo
- Projected year-2 tax
- $801 · $67/mo
- Expected delta
- $0/yr ($0/mo · 0.0%)
ⓘ Screening estimate from a state-policy table — verify with the county assessor before closing.
Climate risk First Street
- Flood 1/10 Low FEMA zone X (unshaded) · 0% chance over 30 yrs
- Wildfire 1/10 Low
- Heat 4/10 Moderate 7 d/yr ≥106°F today · 17 d/yr by 30 yrs out
- Wind 2/10 Low
- Air quality 3/10 Moderate 2 unhealthy d/yr today · 3 by 30 yrs out
Nearby sold comps map
Loading sold comps map…
Walkable amenities ~0.75 mi
Loading nearby amenities…
Taxation est. · year 1
- Rental income
- $12,871
- − Mortgage interest
- −$2,801
- − Property taxes
- −$801
- − Insurance
- −$250
- − Repairs & maintenance
- −$1,030
- − Management
- −$1,030
- − Depreciation
- −$1,455
- Taxable income
- $5,506
- Est. tax owed @ 24.0%
- −$1,321
- After-tax cash flow
- $4,650/yr
For passive investors: Depreciation is non-cash, so a rental often shows a tax loss while cash-flowing — sheltering income. Rental losses are passive: they offset passive income freely, and up to $25,000/yr can offset ordinary (W-2) income if you actively participate and your MAGI is under $100k (phasing out to $0 by $150k); unused losses carry forward. On sale, claimed depreciation is recaptured at up to 25%, and gains may owe capital-gains tax (a 1031 exchange can defer both). Figures are a year-1 estimate at your 24.0% rate — not tax advice; consult a CPA.
Schools (NCES district)
- District
- Kansas City 33
- NCES district ID
- 2916400
- Math proficiency
- 12% ▼ -8.00%
- Reading proficiency
- 24% ▬ 0.00%
- Median HH income
- $35,227
- Composite
- 14.8/100
- National rank
- #9387
- State rank
- #308 of 324 in MO
Livability — Kansas City
- Score
- 78/100
- State rank
- #28
- US rank
- #2671
Category grades
Schools grade is shown separately in the Schools card above.
Census & demographics
- Census place
- Kansas City, MO
- City population
- 439,467
- Population (ZIP)
- 2,723
Population outlook (Jackson County) Hauer SSP2
- Today (2025)
- 719,589 people
- By 2030
- 731,456 · +1.6%
- By 2040
- 746,689 · +3.8%
- By 2050
- 749,289 · +4.1%
- By 2075
- 736,227 · +2.3%
- By 2100
- 668,210 · -7.1%
Race, ethnicity, and origin ACS 2023
- Neighborhood character
- Majority Hispanic (61%)
- Race & ethnicity
- Hispanic / Latino 61% White 26% Black 10% Two or more races 7%
- Hispanic origin (detail)
- Mexican 50% Puerto Rican 1%
- Common ancestry
- Serbian 1% Slovak 1%
- Foreign-born
- 15% · Canada, South Korea
- Languages at home
- 52% English-only · Spanish 48%
Political lean MEDSL · Jackson
- 2024 margin
- D (+19.3) · D 58.9% · R 39.5% · Other 1.6%
- 2008→2024 swing
- -6.1pp toward R · 2008: 25.4pp · 2024: 19.3pp
- All cycles
- 2024: D+19.3 2020: D+22.0 2016: D+16.6 2012: D+19.0 2008: D+25.4
Not yet ingested
- Civics
- —
Market trends
- HPI YoY
- ▲ 14.18%
- Current HPI
- 471.552
- Rent YoY
- —
- Metro
- —
- State GDP YoY
- ▲ 1.84%
- F500 in state
- 20
Industry mix (Fortune 500 HQ in MO)
| Industry | F500 HQs | Revenue |
|---|---|---|
| Healthcare | 1 | $163B |
|
||
| Insurance | 1 | $21B |
|
||
| Industrial Technology | 1 | $17B |
|
||
| Retail | 1 | $16B |
|
||
| Industrial Distribution | 1 | $10B |
|
||
| Utilities | 1 | $9B |
|
||
Price history
2 events — show timeline
- 2026-06-01 Listed $50,000 Heartland MLS as Distributed by MLS Grid
- 1996-08-09 Sold (Public Records) — Public Records
Property tax history
+2.1%/yrLatest (2025): $801 · -28.3% YoY. Source: county tax records.
Cash-flow waterfall
monthlySold comps — $/sqft
last 12 mo · ≤1 miLoading sold comps…