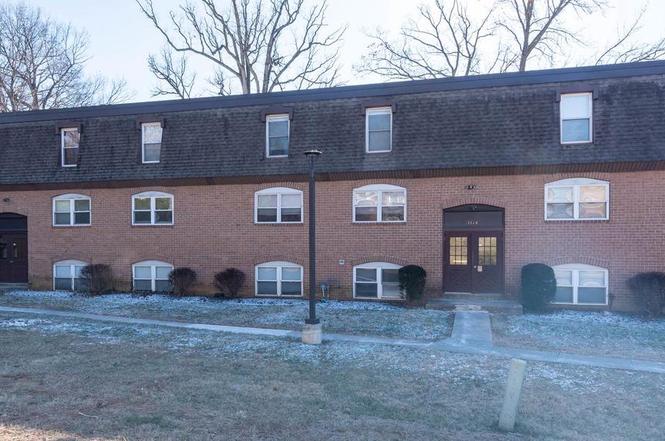
3714 Mayberry Ave Unit F · Baltimore, MD
Flood risk 1/10 · Minimal
- FEMA flood zone
- X (unshaded)
- Chance of flooding over 30 yrs
- 0.0%
- Est. flood insurance / yr
- $473 – $860
Fire risk 1/10 · Minimal
- Est. fire insurance / yr
- $755 – $1,403
Heat risk 7/10 · Major
- Hot days now (above 103°F)
- 7 days/yr
- Hot days in 30 yrs
- 14 days/yr
Wind risk 6/10 · Moderate
- Chance of severe wind over 30 yrs
- 27.0%
Air-quality risk 4/10 · Minor
- Unhealthy air days now
- 5 days/yr
- Unhealthy air days in 30 yrs
- 7 days/yr
Risk factors via First Street. Map © Google.
Why this score? — see what drove the B- grade
The composite is a weighted blend of 9 inputs, each scored 0–100. Each bar is that input's sub-score; the figure is the points it added to the 100-point composite (weight × sub-score).
- Cash flow +30.0/30.0
- 1% rule +10.0/10.0
- DSCR +10.0/10.0
- ARV discount +7.5/15.0
- Livability +3.8/5.0
- Rent growth +3.6/5.0
- Condition / age +2.5/5.0
- Schools +1.0/10.0
- Appreciation +0.0/10.0
$40,000
🖨 Deal sheet 📄 Offer letter ✓ Due diligence
Listing remarks MLS
ONE LEVEL LIVING FOR FIRST TIME HOMEOWNER OR EMPTY-NESTER! EASY TO CARE FOR. .. NO YARD WORK. -GAS HEAT, CENTRAL AIR. CONVENIENT TO TOWSON, I95,DOWNTOWN, 695 AND WHITE MARSH. COULD BECHEAPER THAN RENTING!!! Needs some TLC and updates and priced accordingly
Key facts
- Laminate flooring
- Balcony
- Granite countertops
Tags
Neighborhood map
What this means for you Summary
Snapshot
- This is a 2-bed/1.5-bath condo listed at $40k.
Deal economics
- At list price, monthly cash flow is $529 ($6k/yr) — positive.
- The deal already cash-flows at list — no discount required.
- Meets the 1% rule at list price ($2k rent vs $40k).
- Recommended offer: $39k (3.0% below list) — sets the bar for market timing.
- Cap rate 22.2% vs local median 6.0% in Baltimore — top-decile yield for the area; either an underpriced asset or a hidden risk that comps aren't pricing in. Stress-test before assuming the spread holds.
Location & tenants
- Location reads 76/100 on livability (#90 in MD, #3,396 nationally) — a middle-class / working-renter tenant base. Strengths: amenities A+, commute A+, housing A+; Watch: schools D, crime F.
- Baltimore City Public Schools (urban): math 7% / reading 16% proficiency, ranked #24 of 24 in MD (top 100%) — low school quality limits family demand, transient renter base, plan for 1-2y turnover; 79% free/reduced lunch — lower-income household profile, screen leases tightly.
- Market conditions: Rents rising fast (+4.4%/yr); 173 active listings in the ZIP; 37 comparable units currently listed for rent nearby; rentals at typical pace (median 24d on market — plan ~3-4 weeks tenant-placement turnaround); 1,273 units permitted in Baltimore city in 2024 (1,104 in 5+ unit buildings).
Forward outlook
- Local home prices are declining (-3.0%/yr); year-one equity from $277 of loan paydown is wiped out by about $1k of value loss. Plan a longer hold.
- Baltimore County population projected to shrink 4% by 2050 — rents likely to lag national; underwrite the cash flow, not the appreciation.
- At projected returns (-3.0% appreciation + 4.4% rent growth), your $11k cash investment doubles in ~2 years — after that, you're playing with house money.
Negotiation context
- It's been on market 44 days — a 3% lower offer ($39k) is reasonable based on typical stale-listing flexibility.
- 12 sale attempts since 29y ago with the ask held roughly flat each time — persistent listings suggest the price (not the market) is what's stuck; bring a comps-based counter.
Risks & watch-outs
- Watch-outs: HOA is 26% of rent.
- Climate carrying-cost: major wind risk, 27% chance of damaging wind over 30y; extreme-heat days projected 7→14/yr by 2055 (HVAC capex compounding) — expect insurance premiums to compound above CPI over the hold.
Questions for the listing agent
- It's been on market 44 days. Have you received any prior offers? Is the seller open to a 3% concession, seller financing, or rate buy-down credit?
- Built in 1960 — when were the roof, HVAC, electrical panel, plumbing, and water heater last replaced?
- What does the HOA fee cover, when was the last increase, and are there any pending special assessments or reserve-fund shortfalls?
- Any open or pending special assessments — roof, HVAC, plumbing, elevator, façade? What's the per-unit balance and payoff schedule, and is the seller paying it off at close or rolling it to the buyer?
- Is there a deadline driving the sale (1031 exchange, divorce, estate, relocation)? That informs how much negotiation room exists.
- Schools are D-rated, which usually means shorter tenancies and higher turnover. Who's the typical renter profile here, and what's been the actual vacancy rate?
- Crime grade is F in this area — have there been break-ins, vandalism, or insurance claims at this property in the last 3 years? What carrier currently insures it and at what premium?
- What's the average days-on-market for RENTAL listings here right now (not sales)? A rising rental-DOM trend means longer vacancies and softer asking-rent achievability than the comps imply.
- What's the recent tenant-quality profile in this submarket — average credit score on applications, eviction rate, late-payment / NSF rate, and stable-employment percentage? A property-management company in the area should have these aggregated.
- How much new apartment / multifamily construction is in the pipeline within 1–3 miles? Heavy new supply (>2% of stock underway) typically softens rents 12–24 months out; light construction supports rent growth.
Investment metrics
- 1% rule
- 3.89% ✓
- Cap rate
- 22.15%
- Cash-on-cash
- 56.65%
- DSCR
- 3.52
- GRM
- 2.1
CMA / ARV
No comps found within radius.
Projected returns pro-forma
-3.0% appreciation · 4.43% rent growth · sell at horizon
- IRR
- 57.8%
- Equity multiple
- 3.66×
- Total profit
- $29,746
- Equity at exit
- $5,964
- IRR
- 63.5%
- Equity multiple
- 8.14×
- Total profit
- $80,009
- Equity at exit
- $3,458
Cash invested: $11,200 (down + closing). Projections, not guarantees.
Landlord ↔ Tenant lean methodology
- Overall (CITY)
- 12 Strongly Tenant-Friendly
- State Maryland
- 27 Tenant-Leaning · D+14
- County
- — inherits STATE
- City Baltimore
- 12 Strongly Tenant-Friendly · D+58
ZIP-level market 21206
- Rents YoY
- 4.4%
- Active inventory
- 173
- Price-to-rent
- 2.1×
Monthly cashflow live
- Estimated rent
- $1,556 high interval (Pro) →
- Mortgage (P&I)
- −$210
- Tax from tax record
- −$74 /mo · $890/yr
- Insurance
- −$17
- HOA
- −$400
- Vacancy / Maint / Mgmt
- −$327
- Net cashflow
- $529
Break-even live
UW: 25.0% down · 7.5% · 30yr · 1.5% tax · 5.0% vac · 8.0% maint · 8.0% mgmt
Financing live
Cash to close
- Down payment
- $10,000
- Closing costs
- $1,200
- Reserves months
- —
- Total cash needed
- —
Loan-product check · same deal, 3 products live
Conventional
25% down · 7.5% · 30yr
- Down + closing
- —
- Monthly P&I
- —
- Monthly cashflow
- —
- DSCR
- —
- Eligible?
- —
Personal DTI + credit; lowest rate.
DSCR
20% down · 8.5% · 30yr
- Down + closing
- —
- Monthly P&I
- —
- Monthly cashflow
- —
- DSCR
- —
- Eligible?
- —
No personal income docs; deal must DSCR.
Hard money
10% down · 12.0% · 12mo
- Down + closing
- —
- Monthly P&I
- —
- Monthly cashflow
- —
- DSCR
- —
- Eligible?
- —
Short-term bridge; refi at stabilization.
Rent comps 37 comps
| Address | Beds | Baths | Sqft | Rent | $/sqft | DOM | Units | Dist |
|---|---|---|---|---|---|---|---|---|
| 6410 Walther Ave Baltimore, MD | 2.0 | 1.0–2.0 | 1195 | $1,995 | $1.67 | 43d | 7 | 0.05mi |
| 3807 Fleetwood Ave Unit 3 Baltimore, MD | 1.0 | 1.0 | 797 | $1,165 | $1.46 | 43d | 1 | 0.31mi |
| 3807 Fleetwood Ave Unit 1 Baltimore, MD | 2.0 | 1.0 | 969 | $1,490 | $1.54 | 4d | 1 | 0.31mi |
| 3807 Fleetwood Ave Unit 2 Baltimore, MD | 3.0 | 1.0 | 937 | $1,550 | $1.65 | 4d | 1 | 0.31mi |
| 5906 Benton Heights Ave Baltimore, MD | 2.0 | 1.0 | 780 | $1,350 | $1.73 | 43d | 1 | 0.67mi |
| 3607 Bayonne Ave Unit 2 Baltimore, MD | 2.0 | 1.0 | 900 | $1,300 | $1.44 | 24d | 1 | 0.75mi |
| 3607 Bayonne Ave Unit 1 Baltimore, MD | 1.0 | 1.0 | 750 | $1,100 | $1.47 | 24d | 1 | 0.75mi |
| 3010 Woodring Ave Unit 2 Baltimore, MD | 2.0 | 1.0 | 900 | $1,600 | $1.78 | 43d | 1 | 0.75mi |
| 6915 Harford Rd Unit 3 Baltimore, MD | 1.0 | 1.0 | 600 | $1,250 | $2.08 | 43d | 1 | 0.82mi |
| 6915 Harford Rd Unit 3 Baltimore, MD | 1.0 | 1.0 | 658 | $1,150 | $1.75 | 3d | 1 | 0.82mi |
| 6915 Harford Rd Unit 1 Baltimore, MD | 1.0 | 1.0 | 658 | $1,250 | $1.90 | 3d | 1 | 0.82mi |
| 35-C Mopec Cir Nottingham, MD | 2.0 | 1.0 | 1100 | $1,445 | $1.31 | 2d | 10 | 0.85mi |
| 3010 White Ave Unit B Baltimore, MD | 1.0 | 1.0 | 630 | $1,150 | $1.83 | 24d | 1 | 0.91mi |
| 4308 Hamilton Ave Baltimore, MD | 2.0 | 1.0 | 1110 | $1,416 | $1.28 | 24d | 1 | 1.05mi |
| 3014 Hamilton Ave Unit 1 Baltimore, MD | 2.0 | 1.0 | 850 | $1,575 | $1.85 | 24d | 1 | 1.08mi |
| 3033 Hamilton Ave Unit 1R Baltimore, MD | 2.0 | 1.0 | 720 | $1,195 | $1.66 | 4d | 1 | 1.10mi |
| 2825 Clearview Ave Unit 2 Parkville, MD | 1.0 | 1.0 | 650 | $1,200 | $1.85 | 4d | 1 | 1.10mi |
| 5424 Belle Vista Ave Baltimore, MD | 2.0 | 1.0 | 932 | $1,300 | $1.39 | 43d | 1 | 1.11mi |
| 3021 Echodale Ave Unit 2 Baltimore, MD | 2.0 | 1.0 | 750 | $999 | $1.33 | 43d | 1 | 1.24mi |
| 5738 Cedonia Ave Baltimore, MD | 2.0 | 1.0 | 797 | $1,385 | $1.74 | 3d | 3 | 1.25mi |
| 6211 Birchwood Ave Unit 1st FL Baltimore, MD | 1.0 | 1.0 | 600 | $1,300 | $2.17 | 24d | 1 | 1.25mi |
| 6612 Birchwood Ave Baltimore, MD | 3.0 | 2.0 | 1122 | $2,300 | $2.05 | 20d | 1 | 1.27mi |
| 2604 Hamilton Ave Apt 2 Baltimore, MD | 2.0 | 1.0 | 850 | $1,195 | $1.41 | 43d | 1 | 1.27mi |
| 5600 Birchwood Ave Unit 2 Baltimore, MD | 2.0 | 1.0 | 850 | $1,600 | $1.88 | 43d | 1 | 1.29mi |
| 4905 Hamilton Ave Apt B Baltimore, MD | 3.0 | 2.0 | 925 | $1,550 | $1.68 | 24d | 1 | 1.35mi |
| 4903 1/2 Hamilton Ave Unit A Baltimore, MD | 2.0 | 2.0 | 800 | $1,450 | $1.81 | 24d | 1 | 1.35mi |
| 4903 1/2 Hamilton Ave Apt B Baltimore, MD | 3.0 | 2.0 | 925 | $1,550 | $1.68 | 24d | 1 | 1.35mi |
| 4907 Hamilton Ave Unit B Baltimore, MD | 3.0 | 2.0 | 925 | $1,699 | $1.84 | 43d | 1 | 1.36mi |
| 6212 Laurelton Ave Baltimore, MD | 2.0 | 1.0 | 960 | $1,325 | $1.38 | 43d | 1 | 1.39mi |
| 4909 Hamilton Ave Baltimore, MD | 2.0–3.0 | 2.0 | 862 | $1,450 | $1.68 | 3d | 5 | 1.39mi |
| 5904 Arizona Ave Unit B Baltimore, MD | 3.0 | 2.0 | 925 | $1,550 | $1.68 | 24d | 1 | 1.40mi |
| 2423 Wellbridge Dr Baltimore, MD | 1.0–2.0 | 1.0 | 675 | $1,325 | $1.96 | 20d | 1 | 1.41mi |
| 4007 Biddison Ln Apt 1 Baltimore, MD | 2.0 | 1.0 | 1000 | $1,279 | $1.28 | 18d | 1 | 1.45mi |
| 2800 Linwood Ave Unit C Parkville, MD | 1.0 | 1.0 | 800 | $1,250 | $1.56 | 16d | 1 | 1.48mi |
| 4023 Belwood Ave Baltimore, MD | 3.0 | 1.0 | 1080 | $1,995 | $1.85 | 43d | 1 | 1.49mi |
| 4801 Edgar Ter Baltimore, MD | 1.0 | 1.0 | 850 | $1,200 | $1.41 | 15d | 1 | 1.50mi |
| 4801 Edgar Ter Unit 2 Baltimore, MD | 1.0 | 1.0 | 850 | $1,200 | $1.41 | 43d | 1 | 1.50mi |
HOA detail condo
- Monthly dues
- $400 · $4,800/yr
- Likely covers
- gas
- Assessments
- None detected in remarks — confirm with the listing agent.
Listing history 29 events
-
2026-03-25status Pending
-
2026-02-13status Active
-
2026-02-05historical
-
2026-02-02$40,000 Active
-
2016-11-30soldstatus $36,350 256-char remark
Show marketing remark (256 chars)
ONE LEVEL LIVING FOR FIRST TIME HOMEOWNER OR EMPTY-NESTER! EASY TO CARE FOR. .. NO YARD WORK. -GAS HEAT, CENTRAL AIR. CONVENIENT TO TOWSON, I95,DOWNTOWN, 695 AND WHITE MARSH. COULD BECHEAPER THAN RENTING!!! Needs some TLC and updates and priced accordingly
-
2016-11-30soldstatus $36,350 Sold 256-char remark
Show marketing remark (256 chars)
ONE LEVEL LIVING FOR FIRST TIME HOMEOWNER OR EMPTY-NESTER! EASY TO CARE FOR. .. NO YARD WORK. -GAS HEAT, CENTRAL AIR. CONVENIENT TO TOWSON, I95,DOWNTOWN, 695 AND WHITE MARSH. COULD BECHEAPER THAN RENTING!!! Needs some TLC and updates and priced accordingly
-
2016-10-28status Contingent (No Kick Out) 256-char remark
Show marketing remark (256 chars)
ONE LEVEL LIVING FOR FIRST TIME HOMEOWNER OR EMPTY-NESTER! EASY TO CARE FOR. .. NO YARD WORK. -GAS HEAT, CENTRAL AIR. CONVENIENT TO TOWSON, I95,DOWNTOWN, 695 AND WHITE MARSH. COULD BECHEAPER THAN RENTING!!! Needs some TLC and updates and priced accordingly
-
2016-09-22$42,000 Active 256-char remark
Show marketing remark (256 chars)
ONE LEVEL LIVING FOR FIRST TIME HOMEOWNER OR EMPTY-NESTER! EASY TO CARE FOR. .. NO YARD WORK. -GAS HEAT, CENTRAL AIR. CONVENIENT TO TOWSON, I95,DOWNTOWN, 695 AND WHITE MARSH. COULD BECHEAPER THAN RENTING!!! Needs some TLC and updates and priced accordingly
-
2006-01-24soldstatus $70,000
-
2005-12-28soldstatus $70,000
-
2005-10-28historical
-
2005-09-27$69,999
-
2004-05-07historical
-
2003-11-25
-
2002-11-07historical
-
2002-05-09
-
2001-02-27historical
-
2000-08-31
-
2000-02-20historical
-
1999-08-24
-
1999-08-21historical
-
1999-06-22
-
1997-12-17historical
-
1997-08-30
-
1997-05-19historical
-
1997-01-27historical
-
1997-01-25
-
1997-01-25
-
1991-10-21soldstatus $40,000
ⓘ Source: listings_history table (triggers on properties + properties_extension) + one-shot
backfill from property_details.listing_events for pre-trigger history.
Tax reassessment forecast MD · Partial reset (capped growth)
- Current annual tax
- $890 · $74/mo
- Projected year-2 tax
- $890 · $74/mo
- Expected delta
- $0/yr ($0/mo · 0.0%)
ⓘ Screening estimate from a state-policy table — verify with the county assessor before closing.
Climate risk First Street
- Flood 1/10 Low FEMA zone X (unshaded) · 0% chance over 30 yrs
- Wildfire 1/10 Low
- Heat 7/10 Severe 7 d/yr ≥103°F today · 14 d/yr by 30 yrs out
- Wind 6/10 Major 27% chance of damaging wind over 30 yrs
- Air quality 4/10 Moderate 5 unhealthy d/yr today · 7 by 30 yrs out
Nearby sold comps map
Loading sold comps map…
Walkable amenities ~0.75 mi
Loading nearby amenities…
Taxation est. · year 1
- Rental income
- $18,673
- − Mortgage interest
- −$2,241
- − Property taxes
- −$890
- − Insurance
- −$200
- − Repairs & maintenance
- −$1,494
- − Management
- −$1,494
- − HOA
- −$4,800
- − Depreciation
- −$1,164
- Taxable income
- $6,391
- Est. tax owed @ 24.0%
- −$1,534
- After-tax cash flow
- $4,810/yr
For passive investors: Depreciation is non-cash, so a rental often shows a tax loss while cash-flowing — sheltering income. Rental losses are passive: they offset passive income freely, and up to $25,000/yr can offset ordinary (W-2) income if you actively participate and your MAGI is under $100k (phasing out to $0 by $150k); unused losses carry forward. On sale, claimed depreciation is recaptured at up to 25%, and gains may owe capital-gains tax (a 1031 exchange can defer both). Figures are a year-1 estimate at your 24.0% rate — not tax advice; consult a CPA.
Schools (NCES district)
- District
- Baltimore City Public Schools
- NCES district ID
- 2400090
- Math proficiency
- 7% ▼ -9.00%
- Reading proficiency
- 16% ▼ -5.00%
- Median HH income
- $42,108
- Composite
- 10.08/100
- National rank
- #9805
- State rank
- #24 of 24 in MD
Livability — Baltimore
- Score
- 76/100
- State rank
- #90
- US rank
- #3396
Category grades
Schools grade is shown separately in the Schools card above.
Census & demographics
- Census place
- Baltimore, MD
- County
- Baltimore City · 558,601 people
- City population
- 588,727
- Metro
- Baltimore-Columbia-Towson, MD
- Population (ZIP)
- 48,902
- Household income
- $64,531
- Rent vs Own
- Severe rent burden
- 2317.0
Population outlook (Baltimore County) Hauer SSP2
- Today (2025)
- 624,249 people
- By 2030
- 621,541 · -0.4%
- By 2040
- 609,756 · -2.3%
- By 2050
- 597,249 · -4.3%
- By 2075
- 552,236 · -11.5%
- By 2100
- 513,934 · -17.7%
Race, ethnicity, and origin ACS 2023
- Neighborhood character
- Predominantly Black (73%)
- Race & ethnicity
- Black 73% White 20% Two or more races 3% Hispanic / Latino 3% Asian 2%
- Common ancestry
- Romanian 3% Ukrainian 1%
- Foreign-born
- 8% · Canada
- Languages at home
- 92% English-only · Spanish 2% Arabic 2% Other Indo-European 1%
Political lean MEDSL · Baltimore
- 2024 margin
- Solid D (+73.0) · D 85.2% · R 12.2% · Other 2.6%
- 2008→2024 swing
- -2.5pp toward R · 2008: 75.5pp · 2024: 73.0pp
- All cycles
- 2024: D+73.0 2020: D+76.6 2016: D+74.6 2012: D+76.4 2008: D+75.5
Not yet ingested
- Civics
- —
Market trends
- HPI YoY
- ▼ -191.83%
- Current HPI
- 284.5645
- Rent YoY
- ▲ 4.43%
- Metro
- Baltimore-Columbia-Towson, MD
- State GDP YoY
- ▲ 2.97%
- F500 in state
- 12
Industry mix (Fortune 500 HQ in MD)
| Industry | F500 HQs | Revenue |
|---|---|---|
| Aerospace / Defense | 1 | $71B |
|
||
| Utilities | 1 | $25B |
|
||
| Hotels | 1 | $24B |
|
||
| Consumer Goods | 1 | $7B |
|
||
| Real Estate | 1 | $6B |
|
||
| Chemicals | 1 | $2B |
|
||
Price history
+0.0% since first listed29 events — show timeline
- 2026-03-25 Pending — BRIGHT MLS
- 2026-02-13 Relisted — BRIGHT MLS
- 2026-02-05 Listing Removed — BRIGHT MLS
- 2026-02-02 Listed $40,000 BRIGHT MLS
- 2016-11-30 Sold (MLS) $36,350 MRIS
- 2016-11-30 Sold (MLS) $36,350 BRIGHT MLS
- 2016-10-28 Pending — MRIS
- 2016-09-22 Listed $42,000 MRIS
- 2006-01-24 Sold (Public Records) $70,000 Public Records
- 2005-12-28 Sold (MLS) $70,000 MRIS
- 2005-10-28 Delisted — MRIS
- 2005-09-27 Listed $69,999 MRIS
- 2004-05-07 Delisted — MRIS
- 2003-11-25 Listed — MRIS
- 2002-11-07 Delisted — MRIS
- 2002-05-09 Listed — MRIS
- 2001-02-27 Delisted — MRIS
- 2000-08-31 Listed — MRIS
- 2000-02-20 Delisted — MRIS
- 1999-08-24 Listed — MRIS
- 1999-08-21 Delisted — MRIS
- 1999-06-22 Listed — MRIS
- 1997-12-17 Delisted — MRIS
- 1997-08-30 Listed — MRIS
- 1997-05-19 Delisted — MRIS
- 1997-01-27 Delisted — MRIS
- 1997-01-25 Listed — MRIS
- 1997-01-25 Listed — MRIS
- 1991-10-21 Sold (Public Records) $40,000 Public Records
Property tax history
-3.6%/yrLatest (2025): $890 · +0.0% YoY. Source: county tax records.
Cash-flow waterfall
monthlySold comps — $/sqft
last 12 mo · ≤1 miLoading sold comps…