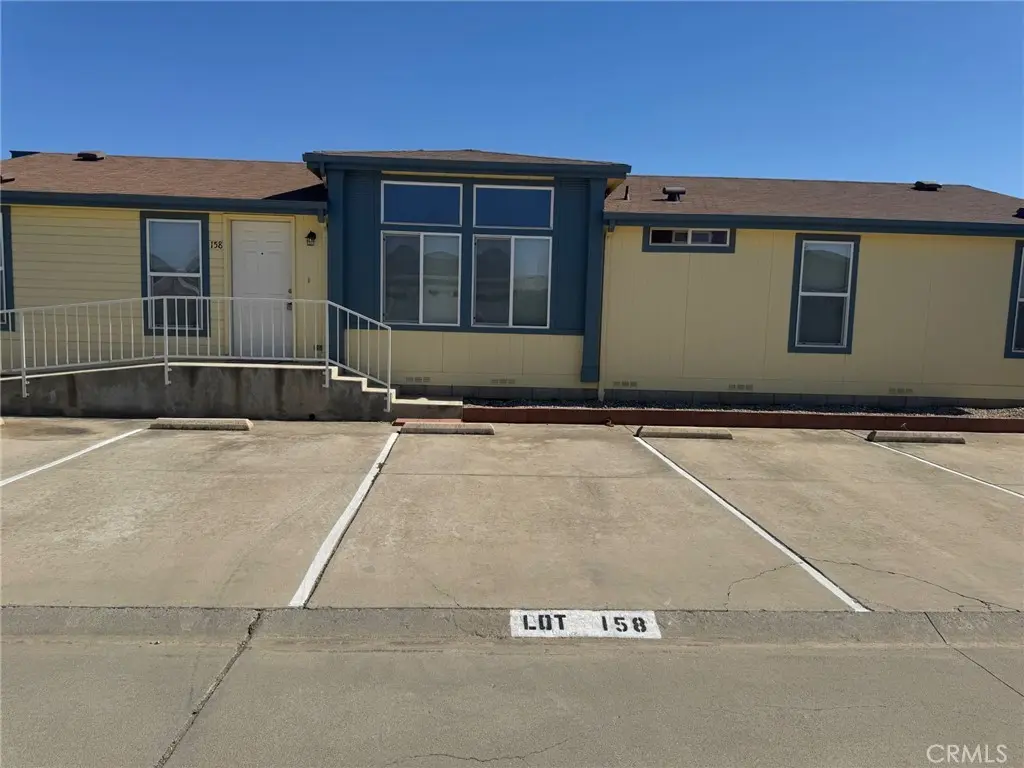
27250 Murrieta Rd #158 · Menifee, CA
Flood risk 1/10 · Minimal
- FEMA flood zone
- X (unshaded)
- Chance of flooding over 30 yrs
- 0.0%
- Est. flood insurance / yr
- $507 – $1,088
Fire risk 7/10 · Major
- Est. fire insurance / yr
- $659 – $1,223
Heat risk 7/10 · Major
- Hot days now (above 105°F)
- 7 days/yr
- Hot days in 30 yrs
- 20 days/yr
Wind risk 1/10 · Minimal
- Chance of severe wind over 30 yrs
- —
Air-quality risk 5/10 · Moderate
- Unhealthy air days now
- 9 days/yr
- Unhealthy air days in 30 yrs
- 11 days/yr
Risk factors via First Street. Map © Google.
Why this score? — see what drove the B grade
The composite is a weighted blend of 9 inputs, each scored 0–100. Each bar is that input's sub-score; the figure is the points it added to the 100-point composite (weight × sub-score).
- Cash flow +29.5/30.0
- DSCR +10.0/10.0
- 1% rule +8.3/10.0
- ARV discount +7.5/15.0
- Schools +4.5/10.0
- Rent growth +4.0/5.0
- Condition / age +3.8/5.0
- Livability +3.2/5.0
- Appreciation +0.0/10.0
$179,000
🖨 Deal sheet 📄 Offer letter ✓ Due diligence
Listing remarks
Beautiful 2003 Silvercrest mobile home located in the highly desirable Sun Meadows 55+ community. This charming 2-bedroom, 2-bath home with Den, sits on a prime corner lot and is filled with natural light thanks to the abundance of windows throughout. The bright and open floor plan offers a warm, inviting atmosphere with spacious living areas perfect for relaxing or entertaining. Enjoy comfortable living in a peaceful community featuring resort-style amenities and beautifully maintained grounds. A wonderful opportunity to enjoy easy living in one of Menifee’s most sought-after senior communities. Plenty of guest parking.
Key facts
- Open floor plan
- Natural light
- Corner lot
Tags
Property features AI
Finance
- Other: Rent includes pool
- Financial info: Land lease (current) with monthly amount
- HOA & community: Senior community; Park name: Sun Meadows; Community features include biking; Manager approval required; Pets: contact manager
Exterior
- Parking: Attached garage (2 spaces); Has parking
- Security: Gated community
- Utilities: Public sewer; District/public water; Natural gas available; Electricity available; Water available; Sewer available
- Home design: Manufactured home (cottage model); Double body type; Single-story; Entry at front; Mobile home remains
- Construction: Shingle roof; Estimated year built
- Exterior features: Awning; Patio; Community pool; Back yard / yard
Interior
- Kitchen: 6-burner stove; Gas cooktop; Dishwasher
- Bedrooms: All bedrooms on main level
- Flooring: Vinyl flooring; Carpet
- Bathrooms: 2 full bathrooms with showers
- Heating & cooling: Central heating (furnace); Central air conditioning
- Interior features: Formica counters; Gated community; Community spa; One-level home; Front entry
- Laundry & utility: Separate laundry room
Neighborhood map
What this means for you Summary
Snapshot
- This is a 2-bed/2.0-bath manufactured listed at $179k. Condition is rated good.
Deal economics
- At list price, monthly cash flow is $638 ($8k/yr) — positive.
- The deal already cash-flows at list — no discount required.
- Meets the 1% rule at list price ($2k rent vs $179k).
- Cap rate 10.6% vs local median 3.6% in Menifee — top-decile yield for the area; either an underpriced asset or a hidden risk that comps aren't pricing in. Stress-test before assuming the spread holds.
Location & tenants
- Location reads 64/100 on livability (#407 in CA) — a middle-class / working-renter tenant base. Strengths: housing A+, crime A, employment A-; Watch: schools D+, health & safety D+, amenities D.
- Menifee Union Elementary (suburban): math 43% / reading 56% proficiency, ranked #434 of 1,400 in CA (top 31%) — families likely to look elsewhere, expect single-tenant / working-renter base with shorter leases.
- Market conditions: Rents rising fast (+6.1%/yr); 197 active listings in the ZIP; 24 comparable units currently listed for rent nearby; rentals leasing fast (median 2d on market — plan ~1-2 weeks tenant-placement turnaround); 9,195 units permitted in Riverside County in 2024 (1,512 in 5+ unit buildings).
- At $2,374/mo this rent would consume 49% of the median local household income ($58k/yr) (locally 1163% of renters already pay >50% of income on rent) — very limited rent-growth headroom before tenants either downsize or default.
Forward outlook
- Local home prices are declining (-3.0%/yr); year-one equity from $1k of loan paydown is wiped out by about $5k of value loss. Plan a longer hold.
- Riverside County population projected at +22% by 2050 — long-run rental-demand tailwind backs the buy-and-hold thesis.
- At projected returns (-3.0% appreciation + 6.1% rent growth), your $50k cash investment doubles in ~7 years — after that, you're playing with house money.
Negotiation context
- Only 11 days on market — expect competitive offers; lowballing is unlikely to land.
Risks & watch-outs
- Climate carrying-cost: major wildfire risk; extreme-heat days projected 7→20/yr by 2055 (HVAC capex compounding) — expect insurance premiums to compound above CPI over the hold.
Questions for the listing agent
- Is there a deadline driving the sale (1031 exchange, divorce, estate, relocation)? That informs how much negotiation room exists.
- Schools are D-rated, which usually means shorter tenancies and higher turnover. Who's the typical renter profile here, and what's been the actual vacancy rate?
- What's the average days-on-market for RENTAL listings here right now (not sales)? A rising rental-DOM trend means longer vacancies and softer asking-rent achievability than the comps imply.
- What's the recent tenant-quality profile in this submarket — average credit score on applications, eviction rate, late-payment / NSF rate, and stable-employment percentage? A property-management company in the area should have these aggregated.
- How much new for-sale + rental construction is in the pipeline within 1–3 miles? Heavy new supply typically softens prices + rents 12–24 months out; constrained supply supports both.
Investment metrics
- 1% rule
- 1.33% ✓
- Cap rate
- 10.57%
- Cash-on-cash
- 15.28%
- DSCR
- 1.68
- GRM
- 6.3
CMA / ARV
- ARV (on-the-fly)
- $107,520
- Comps found
- 12
Show comp detail 12 sales within ~0.75 mi
| Address | Dist | Beds/Ba | Sqft | Sold | Price | $/sf | Match |
|---|---|---|---|---|---|---|---|
| 27250 Murrieta Rd #359 | 0.05mi | 2/2.0 | 1,320 (-2%) | 1mo | $55,000 | $42 | 94 |
| 27250 Murrieta Rd #216 | 0.05mi | 2/2.0 | 1,296 (-4%) | 2mo | $110,000 | $85 | 90 |
| 27250 Murrieta #120 | 0.05mi | 2/2.0 | 1,440 (+7%) | 1mo | $200,000 | $139 | 85 |
| 27250 Murrieta Rd #109 | 0.05mi | 2/2.0 | 1,440 (+7%) | 1mo | $170,600 | $118 | 85 |
| 27250 Murrieta #217 | 0.05mi | 3/2.0 (+1) | 1,488 (+11%) | 2mo | $215,000 | $144 | 73 |
| 27701 Murrieta Rd #255 | 0.62mi | 2/2.0 | 1,344 (0%) | 0mo | $45,000 | $33 | 71 |
| 27601 Sun City Blvd #306 | 0.66mi | 3/2.0 (+1) | 1,320 (-2%) | 0mo | $173,000 | $131 | 61 |
| 27701 Murrieta #82 | 0.62mi | 2/2.0 | 1,440 (+7%) | 1mo | $100,000 | $69 | 58 |
| 27601 Sun City Blvd #65 | 0.74mi | 2/2.0 | 1,440 (+7%) | 1mo | $115,000 | $80 | 53 |
| 27701 Murrieta #56 | 0.62mi | 3/2.0 (+1) | 1,440 (+7%) | 2mo | $100,000 | $69 | 53 |
| 27601 Sun City Blvd #94 | 0.74mi | 2/2.0 | 1,488 (+11%) | 0mo | $115,000 | $77 | 48 |
| 27701 Murrieta Rd #111 | 0.62mi | 3/2.0 (+1) | 1,508 (+12%) | 2mo | $115,000 | $76 | 44 |
Match score weights: distance 35% · size 25% · config 20% · recency 20%. Top-matched comps best support the ARV.
Projected returns pro-forma
-3.0% appreciation · 6.1% rent growth · sell at horizon
- IRR
- 9.4%
- Equity multiple
- 1.39×
- Total profit
- $19,316
- Equity at exit
- $26,689
- IRR
- 21.1%
- Equity multiple
- 3.05×
- Total profit
- $102,699
- Equity at exit
- $15,477
Cash invested: $50,120 (down + closing). Projections, not guarantees.
Landlord ↔ Tenant lean methodology
- Overall (STATE)
- 18 Strongly Tenant-Friendly
- State California
- 18 Strongly Tenant-Friendly · D+13
- County
- — inherits STATE
- City
- — inherits STATE
ZIP-level market 92586
- Home prices YoY
- -19.1%
- Rents YoY
- 6.1%
- Active inventory
- 197
- Price-to-rent
- 6.3×
Monthly cashflow live
- Estimated rent
- $2,374 high interval (Pro) →
- Mortgage (P&I)
- −$939
- Tax est. 1.5%
- −$224 /mo · $2,685/yr
- Insurance
- −$75
- HOA
- −$0
- Vacancy / Maint / Mgmt
- −$499
- Net cashflow
- $638
Break-even live
UW: 25.0% down · 7.5% · 30yr · 1.5% tax · 5.0% vac · 8.0% maint · 8.0% mgmt
Financing live
Cash to close
- Down payment
- $44,750
- Closing costs
- $5,370
- Reserves months
- —
- Total cash needed
- —
Loan-product check · same deal, 3 products live
Conventional
25% down · 7.5% · 30yr
- Down + closing
- —
- Monthly P&I
- —
- Monthly cashflow
- —
- DSCR
- —
- Eligible?
- —
Personal DTI + credit; lowest rate.
DSCR
20% down · 8.5% · 30yr
- Down + closing
- —
- Monthly P&I
- —
- Monthly cashflow
- —
- DSCR
- —
- Eligible?
- —
No personal income docs; deal must DSCR.
Hard money
10% down · 12.0% · 12mo
- Down + closing
- —
- Monthly P&I
- —
- Monthly cashflow
- —
- DSCR
- —
- Eligible?
- —
Short-term bridge; refi at stabilization.
Rent comps 24 comps
| Address | Beds | Baths | Sqft | Rent | $/sqft | DOM | Units | Dist |
|---|---|---|---|---|---|---|---|---|
| 29196 Crestone Dr Sun City, CA | 2.0 | 2.0 | 1393 | $1,995 | $1.43 | 19d | 1 | 0.24mi |
| 26772 Maris Ct Menifee, CA | 3.0 | 2.0 | 1715 | $2,800 | $1.63 | 1d | 1 | 0.57mi |
| 27305 Uppercrest Ct Menifee, CA | 3.0 | 2.0 | 1318 | $2,353 | $1.79 | 21d | 1 | 0.59mi |
| 27055 Fan Ln Menifee, CA | 2.0 | 2.0 | 1800 | $2,950 | $1.64 | 1d | 1 | 0.60mi |
| 25615 Union Hill Dr Menifee, CA | 3.0 | 2.0 | 1350 | $2,550 | $1.89 | 14d | 1 | 0.71mi |
| 28055 Grosse Point Dr Menifee, CA | 1.0 | 1.0 | 1767 | $1,495 | $0.85 | 1d | 1 | 0.72mi |
| 25861 McCall Blvd Menifee, CA | 2.0 | 2.0 | 1378 | $2,350 | $1.71 | 1d | 1 | 0.80mi |
| 26805 China Dr Menifee, CA | 3.0 | 2.5 | 1773 | $3,000 | $1.69 | 24d | 1 | 0.81mi |
| 26156 Birkdale Rd Menifee, CA | 2.0 | 2.0 | 1285 | $2,000 | $1.56 | 1d | 1 | 0.85mi |
| 26217 Birkdale Rd Menifee, CA | 1.0 | 1.0 | 876 | $2,150 | $2.45 | 1d | 1 | 0.88mi |
| 28033 Radford Dr Menifee, CA | 2.0 | 2.0 | 1520 | $2,400 | $1.58 | 10d | 1 | 0.88mi |
| 28375 Paseo Grande Dr Menifee, CA | 2.0 | 2.0 | 1285 | $2,395 | $1.86 | 1d | 1 | 0.90mi |
| 28323 Murrieta Rd Menifee, CA | 2.0 | 2.0 | 1098 | $2,350 | $2.14 | 20d | 1 | 1.04mi |
| 25650 Hartwick Rd Menifee, CA | 3.0 | 2.0 | 1603 | $2,650 | $1.65 | 21d | 1 | 1.10mi |
| 28244 Encanto Dr Menifee, CA | 2.0 | 2.0 | 900 | $2,300 | $2.56 | 1d | 1 | 1.25mi |
| 28301 Encanto Dr Unit 10 Menifee, CA | 2.0 | 2.0 | 900 | $2,200 | $2.44 | 17d | 1 | 1.28mi |
| 26542 Sun City Blvd Menifee, CA | 2.0 | 2.0 | 1530 | $2,295 | $1.50 | 10d | 1 | 1.30mi |
| 28461 Portsmouth Dr Menifee, CA | 3.0 | 2.0 | 1450 | $2,685 | $1.85 | 1d | 1 | 1.34mi |
| 28301 Encanto Dr Menifee, CA | 2.0 | 1.0–2.0 | 873 | $2,025 | $2.32 | 1d | 5 | 1.36mi |
| 28082 Bavaria Dr Menifee, CA | 2.0 | 2.0 | 1065 | $2,250 | $2.11 | 1d | 1 | 1.37mi |
| 27709 Camino Donaire Menifee, CA | 3.0 | 2.0 | 1317 | $3,000 | $2.28 | 1d | 1 | 1.41mi |
| 28377 Encanto Dr Menifee, CA | 1.0–3.0 | 1.0–2.0 | 815 | $2,150 | $2.64 | 1d | 7 | 1.48mi |
| 28230 Avenida Francesca Menifee, CA | 2.0 | 2.0 | 1116 | $2,250 | $2.02 | 1d | 1 | 1.49mi |
| 25781 Interlechen Dr Menifee, CA | 3.0 | 2.0 | 1554 | $2,800 | $1.80 | 1d | 1 | 1.50mi |
Listing history 9 events
-
2026-06-18days on market $179,000 Active 11 DOM
-
2026-06-17days on market $179,000 Active 10 DOM
-
2026-06-16days on market $179,000 Active 9 DOM
-
2026-06-15days on market $179,000 Active 8 DOM
-
2026-06-13days on market $179,000 Active 6 DOM
-
2026-06-09days on market $179,000 Active 2 DOM
-
2026-06-08remarks 628-char remark
-
2026-06-08remarks 603-char remark
-
2026-06-08$179,000 Active 1 DOM
ⓘ Source: listings_history table (triggers on properties + properties_extension) + one-shot
backfill from property_details.listing_events for pre-trigger history.
Climate risk First Street
- Flood 1/10 Low FEMA zone X (unshaded) · 0% chance over 30 yrs
- Wildfire 7/10 Severe
- Heat 7/10 Severe 7 d/yr ≥105°F today · 20 d/yr by 30 yrs out
- Wind 1/10 Low
- Air quality 5/10 Major 9 unhealthy d/yr today · 11 by 30 yrs out
Nearby sold comps map
Loading sold comps map…
Walkable amenities ~0.75 mi
Loading nearby amenities…
Taxation est. · year 1
- Rental income
- $28,486
- − Mortgage interest
- −$10,027
- − Property taxes
- −$2,685
- − Insurance
- −$895
- − Repairs & maintenance
- −$2,279
- − Management
- −$2,279
- − Depreciation
- −$5,207
- Taxable income
- $5,114
- Est. tax owed @ 24.0%
- −$1,227
- After-tax cash flow
- $6,432/yr
For passive investors: Depreciation is non-cash, so a rental often shows a tax loss while cash-flowing — sheltering income. Rental losses are passive: they offset passive income freely, and up to $25,000/yr can offset ordinary (W-2) income if you actively participate and your MAGI is under $100k (phasing out to $0 by $150k); unused losses carry forward. On sale, claimed depreciation is recaptured at up to 25%, and gains may owe capital-gains tax (a 1031 exchange can defer both). Figures are a year-1 estimate at your 24.0% rate — not tax advice; consult a CPA.
Condition & rehab AI · 12 photos
This 2003 Silvercrest mobile home in Sun Meadows 55+ community is in good condition with minor repairs needed. Painting the exterior and replacing the carpet would significantly increase its value.
Repairs flagged
- Minor Carpeted floors — Some wear, could be replaced
- Minor Landscaping — Some grass needs trimming
Value-add opportunities
- Both Paint exterior — Enhances curb appeal and value
- Both Replace carpet — Fresh carpet improves comfort and value
Renovation cost estimate screening
| Repair item | Severity | Est. cost |
|---|---|---|
| Carpeted floors · Some wear, could be replaced | Minor | $500–3,000 |
| Landscaping · Some grass needs trimming | Minor | $500–3,000 |
| Total estimated repair cost · 2 items | $1,000–6,000 |
Value-add ROI direction
- Both Paint exterior — Enhances curb appeal and value ↑
- Both Replace carpet — Fresh carpet improves comfort and value ↑
ⓘ Cost ranges are severity-bucket heuristics (US national rule-of-thumb). Get contractor quotes + a written scope before underwriting a rehab budget.
Schools (NCES district)
- District
- Menifee Union Elementary
- NCES district ID
- 0624540
- Math proficiency
- 43% ▬ 0.00%
- Reading proficiency
- 56% ▲ 3.00%
- Median HH income
- $58,228
- Composite
- 45.17/100
- National rank
- #5790
- State rank
- #434 of 1400 in CA
Livability — Menifee
- Score
- 64/100
- State rank
- #407
- US rank
- #13882
Category grades
Schools grade is shown separately in the Schools card above.
Census & demographics
- Census place
- Menifee, CA
- County
- Riverside County · 2,287,001 people
- City population
- 111,667
- Metro
- Riverside-San Bernardino-Ontario, CA
- Population (ZIP)
- 20,767
- Household income
- $57,708
- Rent vs Own
- Severe rent burden
- 1163.0
Population outlook (Riverside County) Hauer SSP2
- Today (2025)
- 2,664,475 people
- By 2030
- 2,802,692 · +5.2%
- By 2040
- 3,050,904 · +14.5%
- By 2050
- 3,256,783 · +22.2%
- By 2075
- 3,655,058 · +37.2%
- By 2100
- 3,766,594 · +41.4%
Race, ethnicity, and origin ACS 2023
- Neighborhood character
- Diverse neighborhood (Simpson 0.59)
- Race & ethnicity
- White 55% Hispanic / Latino 31% Two or more races 17% Black 6% Asian 3%
- Hispanic origin (detail)
- Mexican 25% Puerto Rican 1%
- Common ancestry
- Lithuanian 3% Italian 2% Romanian 1%
- Foreign-born
- 15% · Canada, Vietnam, China
- Languages at home
- 77% English-only · Spanish 18% Other Asian/Pacific 1% Other Indo-European 1%
Political lean MEDSL · Riverside
- 2024 margin
- Toss-up / Even · D 48.0% · R 49.3% · Other 2.6%
- 2008→2024 swing
- -3.6pp toward R · 2008: 2.3pp · 2024: -1.3pp
- All cycles
- 2024: R+1.3 2020: D+8.0 2016: D+4.3 2012: R+0.4 2008: D+2.3
Not yet ingested
- Civics
- —
Market trends
- HPI YoY
- ▼ -86.18%
- Current HPI
- 364.9577
- Rent YoY
- ▲ 6.10%
- Metro
- Riverside-San Bernardino-Ontario, CA
- State GDP YoY
- ▲ 3.21%
- F500 in state
- 116
Industry mix (Fortune 500 HQ in CA)
| Industry | F500 HQs | Revenue |
|---|---|---|
| Technology | 27 | $1,492B |
|
||
| Financial Services | 3 | $174B |
|
||
| Retail | 3 | $44B |
|
||
| Insurance | 3 | $26B |
|
||
| Media / Entertainment | 2 | $115B |
|
||
| Pharmaceuticals / Biotech | 2 | $62B |
|
||
Price history
+2.3% since first listed2 events — show timeline
- 2026-06-07 Price Changed $179,000 CRMLS
- 2026-06-07 Listed $175,000 CRMLS
Cash-flow waterfall
monthlySold comps — $/sqft
last 12 mo · ≤1 miLoading sold comps…