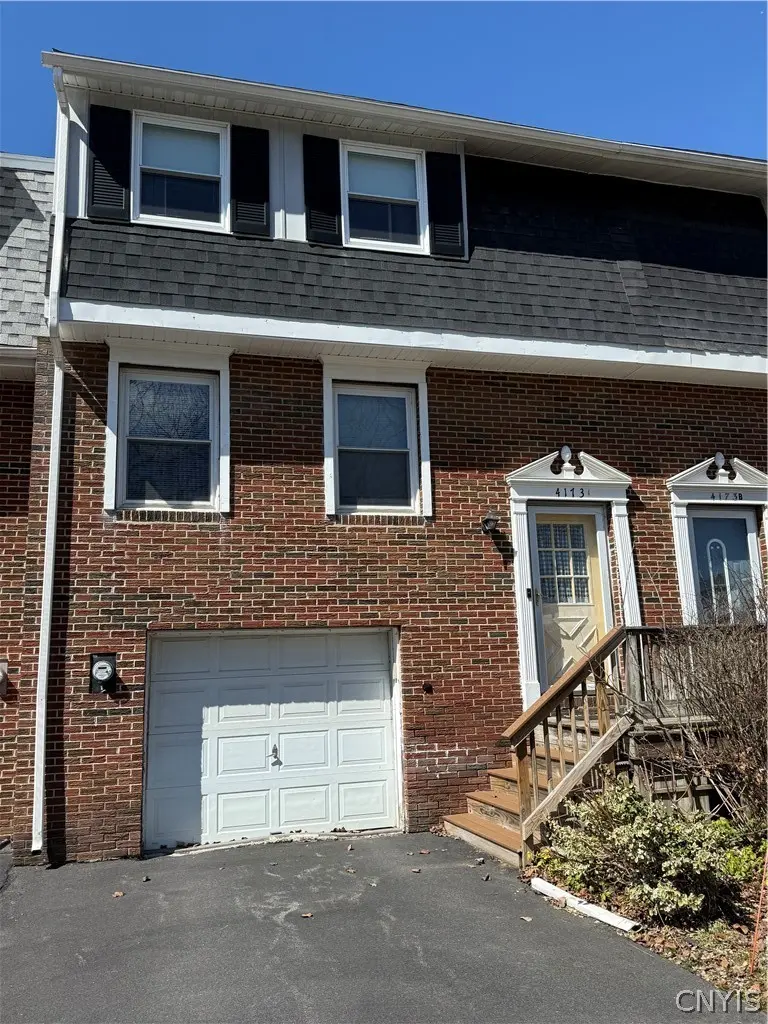
4173 Burningtree Rd · Radisson, NY
Flood risk 1/10 · Minimal
- FEMA flood zone
- X (unshaded)
- Chance of flooding over 30 yrs
- 0.0%
- Est. flood insurance / yr
- $473 – $860
Fire risk 1/10 · Minimal
- Est. fire insurance / yr
- $691 – $1,283
Heat risk 3/10 · Minor
- Hot days now (above 95°F)
- 7 days/yr
- Hot days in 30 yrs
- 16 days/yr
Wind risk 1/10 · Minimal
- Chance of severe wind over 30 yrs
- 0.0%
Air-quality risk 2/10 · Minimal
- Unhealthy air days now
- 1 days/yr
- Unhealthy air days in 30 yrs
- 1 days/yr
Risk factors via First Street. Map © Google.
Why this score? — see what drove the B+ grade
The composite is a weighted blend of 9 inputs, each scored 0–100. Each bar is that input's sub-score; the figure is the points it added to the 100-point composite (weight × sub-score).
- Cash flow +29.7/30.0
- ARV discount +13.9/15.0
- DSCR +10.0/10.0
- 1% rule +8.4/10.0
- Schools +4.3/10.0
- Condition / age +3.8/5.0
- Rent growth +2.5/5.0
- Livability +2.5/5.0
- Appreciation +0.0/10.0
$176,999
🖨 Deal sheet 📄 Offer letter ✓ Due diligence
Listing remarks
DON'T MISS THIS 3 BEDROOM, 1.5 BATH TOWNHOUSE IN A FANTASTIC LOCATION. OFFERING COMFORTABLE LIVING SPACE AND CLOSE PROXIMITY TO SHOPPING, RESTAURANTS, SCHOOLS AND MAJOR CONVENIENCES PERFECT FOR HOMEOWNERS AND INVESTORS ALIKE. ENJOY A BRIGHT EAT IN KITCHEN FOR COMFORTABLE DINING. LARGE LIVING ROOM WITH SLIDERS OUT TO THE BACKYARD. UPSTAIRS YOU'LL FIND 3 SPACIOUS BEDROOMS A FULL BATH AND PLENTY OF CLOSET SPACE. NEWER ROOF, NEWER FURNACE AND NEW ATTIC INSULATION. MAKE YOUR APPOINTMENT TODAY.
Key facts
- Newer furnace
- Newer roof
- Backyard
Tags
Neighborhood map
What this means for you Summary
Snapshot
- This is a 3-bed/1.5-bath townhouse listed at $177k. Condition is rated good.
Deal economics
- At list price, monthly cash flow is $645 ($8k/yr) — positive.
- The deal already cash-flows at list — no discount required.
- Meets the 1% rule at list price ($2k rent vs $177k).
- Cap rate 10.7% vs local median 3.5% in Radisson — top-decile yield for the area; either an underpriced asset or a hidden risk that comps aren't pricing in. Stress-test before assuming the spread holds.
Location & tenants
- Location reads: area grade B — affects rentability + tenant quality, not the cash-flow math above.
- Liverpool Central School District (suburban): math 49% / reading 49% proficiency, ranked #381 of 590 in NY (top 65%) — families likely to look elsewhere, expect single-tenant / working-renter base with shorter leases.
- Market conditions: 96 active listings in the ZIP; 3 comparable units currently listed for rent nearby; rentals leasing fast (median 14d on market — plan ~1-2 weeks tenant-placement turnaround); solid renter incomes; 616 units permitted in Onondaga County in 2024 (256 in 5+ unit buildings).
- This rent runs 32% of the median local income ($88k/yr) — at the standard rent-burdened threshold; future hikes will face affordability resistance.
Forward outlook
- Local home prices are declining (-3.0%/yr); year-one equity from $1k of loan paydown is wiped out by about $5k of value loss. Plan a longer hold.
- Onondaga County population projected to shrink 9% by 2050 — rents likely to lag national; underwrite the cash flow, not the appreciation.
- At projected returns (-3.0% appreciation + 3.0% rent growth), your $50k cash investment doubles in ~8 years — after that, you're playing with house money.
Negotiation context
- Only 13 days on market — expect competitive offers; lowballing is unlikely to land.
Questions for the listing agent
- Built in 1975 — when were the roof, HVAC, electrical panel, plumbing, and water heater last replaced?
- Is there a deadline driving the sale (1031 exchange, divorce, estate, relocation)? That informs how much negotiation room exists.
- What's the average days-on-market for RENTAL listings here right now (not sales)? A rising rental-DOM trend means longer vacancies and softer asking-rent achievability than the comps imply.
- What's the recent tenant-quality profile in this submarket — average credit score on applications, eviction rate, late-payment / NSF rate, and stable-employment percentage? A property-management company in the area should have these aggregated.
- How much new for-sale + rental construction is in the pipeline within 1–3 miles? Heavy new supply typically softens prices + rents 12–24 months out; constrained supply supports both.
Investment metrics
- 1% rule
- 1.34% ✓
- Cap rate
- 10.66%
- Cash-on-cash
- 15.61%
- DSCR
- 1.69
- GRM
- 6.2
CMA / ARV
- ARV (on-the-fly)
- $206,400
- Comps found
- 12
Show comp detail 12 sales within ~0.75 mi
| Address | Dist | Beds/Ba | Sqft | Sold | Price | $/sf | Match |
|---|---|---|---|---|---|---|---|
| 4176B Burningtree Rd | 0.05mi | 3/1.5 | 1,200 (0%) | 1mo | $176,000 | $147 | 97 |
| 8402B Shallowcreek Rd | 0.05mi | 3/1.5 | 1,200 (0%) | 3mo | $220,000 | $183 | 95 |
| 8408A Shallowcreek Rd | 0.02mi | 3/1.5 | 1,200 (0%) | 11mo | $206,000 | $172 | 90 |
| 8408B Shallowcreek Rd | 0.02mi | 3/1.5 | 1,200 (0%) | 12mo | $200,000 | $167 | 90 |
| 8385 Shallowcreek Rd Unit A | 0.15mi | 2/1.5 (-1) | 1,200 (0%) | 2mo | $182,500 | $152 | 86 |
| 4174 Burningtree Rd Unit A | 0.05mi | 3/1.5 | 1,260 (+5%) | 19mo | $161,000 | $128 | 74 |
| 4170A Burningtree Rd | 0.04mi | 3/1.5 | 1,120 (-7%) | 21mo | $120,000 | $107 | 70 |
| 8253 Beehive Cir | 0.59mi | 2/1.5 (-1) | 1,192 (-1%) | 3mo | $226,025 | $190 | 63 |
| 8236 Beehive Cir | 0.60mi | 2/1.5 (-1) | 1,204 (+0%) | 19mo | $215,000 | $179 | 51 |
| 8203 Honeysuckle Dr | 0.64mi | 2/1.5 (-1) | 1,204 (+0%) | 21mo | $215,000 | $179 | 47 |
| 8192 Honeysuckle Dr | 0.67mi | 2/1.5 (-1) | 1,212 (+1%) | 22mo | $175,000 | $144 | 44 |
| 8253 Honeysuckle Dr | 0.57mi | 2/1.5 (-1) | 1,304 (+9%) | 24mo | $226,000 | $173 | 34 |
Match score weights: distance 35% · size 25% · config 20% · recency 20%. Top-matched comps best support the ARV.
Projected returns pro-forma
-3.0% appreciation · 3.0% rent growth · sell at horizon
- IRR
- 6.4%
- Equity multiple
- 1.25×
- Total profit
- $12,425
- Equity at exit
- $26,391
- IRR
- 15.8%
- Equity multiple
- 2.29×
- Total profit
- $63,850
- Equity at exit
- $15,304
Cash invested: $49,560 (down + closing). Projections, not guarantees.
Landlord ↔ Tenant lean methodology
- Overall (STATE)
- 15 Strongly Tenant-Friendly
- State New York
- 15 Strongly Tenant-Friendly · D+10
- County
- — inherits STATE
- City
- — inherits STATE
ZIP-level market 13090
- Active inventory
- 96
- Price-to-rent
- 6.2×
Monthly cashflow live
- Estimated rent
- $2,365 medium interval (Pro) →
- Mortgage (P&I)
- −$928
- Tax est. 1.5%
- −$221 /mo · $2,655/yr
- Insurance
- −$74
- HOA
- −$0
- Vacancy / Maint / Mgmt
- −$497
- Net cashflow
- $645
Break-even live
UW: 25.0% down · 7.5% · 30yr · 1.5% tax · 5.0% vac · 8.0% maint · 8.0% mgmt
Financing live
Cash to close
- Down payment
- $44,250
- Closing costs
- $5,310
- Reserves months
- —
- Total cash needed
- —
Loan-product check · same deal, 3 products live
Conventional
25% down · 7.5% · 30yr
- Down + closing
- —
- Monthly P&I
- —
- Monthly cashflow
- —
- DSCR
- —
- Eligible?
- —
Personal DTI + credit; lowest rate.
DSCR
20% down · 8.5% · 30yr
- Down + closing
- —
- Monthly P&I
- —
- Monthly cashflow
- —
- DSCR
- —
- Eligible?
- —
No personal income docs; deal must DSCR.
Hard money
10% down · 12.0% · 12mo
- Down + closing
- —
- Monthly P&I
- —
- Monthly cashflow
- —
- DSCR
- —
- Eligible?
- —
Short-term bridge; refi at stabilization.
Rent comps 3 comps
| Address | Beds | Baths | Sqft | Rent | $/sqft | DOM | Units | Dist |
|---|---|---|---|---|---|---|---|---|
| 8545 Morgan Rd Clay, NY | 1.0–2.0 | 1.0 | 725 | $2,175 | $3.00 | 13d | 6 | 0.59mi |
| 4220 Anguilla Dr Liverpool, NY | 2.0 | 1.5 | 1212 | $2,200 | $1.82 | 13d | 1 | 1.32mi |
| 3754C Helios Ct Baldwinsville, NY | 2.0 | 2.5 | 1358 | $1,750 | $1.29 | 13d | 1 | 1.49mi |
Listing history 3 events
-
2026-04-09status Pending
-
2026-04-04price $176,999
-
2026-03-27$179,900 Active
ⓘ Source: listings_history table (triggers on properties + properties_extension) + one-shot
backfill from property_details.listing_events for pre-trigger history.
Climate risk First Street
- Flood 1/10 Low FEMA zone X (unshaded) · 0% chance over 30 yrs
- Wildfire 1/10 Low
- Heat 3/10 Moderate 7 d/yr ≥95°F today · 16 d/yr by 30 yrs out
- Wind 1/10 Low 0% chance of damaging wind over 30 yrs
- Air quality 2/10 Low 1 unhealthy d/yr today · 1 by 30 yrs out
Nearby sold comps map
Loading sold comps map…
Walkable amenities ~0.75 mi
Loading nearby amenities…
Taxation est. · year 1
- Rental income
- $28,375
- − Mortgage interest
- −$9,915
- − Property taxes
- −$2,655
- − Insurance
- −$885
- − Repairs & maintenance
- −$2,270
- − Management
- −$2,270
- − Depreciation
- −$5,149
- Taxable income
- $5,232
- Est. tax owed @ 24.0%
- −$1,256
- After-tax cash flow
- $6,483/yr
For passive investors: Depreciation is non-cash, so a rental often shows a tax loss while cash-flowing — sheltering income. Rental losses are passive: they offset passive income freely, and up to $25,000/yr can offset ordinary (W-2) income if you actively participate and your MAGI is under $100k (phasing out to $0 by $150k); unused losses carry forward. On sale, claimed depreciation is recaptured at up to 25%, and gains may owe capital-gains tax (a 1031 exchange can defer both). Figures are a year-1 estimate at your 24.0% rate — not tax advice; consult a CPA.
Condition & rehab AI · 13 photos
This 3-bedroom townhouse is in good condition with recent updates, offering a comfortable living space and potential for further improvements to enhance its curb appeal and value.
Value-add opportunities
- Both Paint exterior — Enhances curb appeal and value
- Both Replace window treatments — Freshens look and improves energy efficiency
- Both Update flooring in bathrooms — Modernizes spaces and improves resale value
Renovation cost estimate screening
Value-add ROI direction
- Both Paint exterior — Enhances curb appeal and value ↑
- Both Replace window treatments — Freshens look and improves energy efficiency ↑
- Both Update flooring in bathrooms — Modernizes spaces and improves resale value ↑
ⓘ Cost ranges are severity-bucket heuristics (US national rule-of-thumb). Get contractor quotes + a written scope before underwriting a rehab budget.
Schools (NCES district)
- District
- Liverpool Central School District
- NCES district ID
- 3617520
- Math proficiency
- 49% ▼ -6.00%
- Reading proficiency
- 49% ▲ 1.00%
- Median HH income
- $59,134
- Composite
- 42.84/100
- National rank
- #3134
- State rank
- #381 of 590 in NY
Livability — Radisson
No livability data for this city. (Only ~50 U.S. cities are tracked.)
Census & demographics
- County
- Onondaga County · 247,257 people
- Metro
- Syracuse, NY
- Population (ZIP)
- 29,004
- Household income
- $88,492
- Rent vs Own
- Severe rent burden
- 733.0
Population outlook (Onondaga County) Hauer SSP2
- Today (2025)
- 467,894 people
- By 2030
- 463,381 · -1.0%
- By 2040
- 447,697 · -4.3%
- By 2050
- 426,399 · -8.9%
- By 2075
- 373,661 · -20.1%
- By 2100
- 307,967 · -34.2%
Race, ethnicity, and origin ACS 2023
- Neighborhood character
- Predominantly White (79%)
- Race & ethnicity
- White 79% Two or more races 9% Hispanic / Latino 7% Black 6% Asian 3%
- Hispanic origin (detail)
- Mexican 1% Puerto Rican 4%
- Common ancestry
- Romanian 7% Lithuanian 4% Italian 2%
- Foreign-born
- 6% · Canada, China, South Korea
- Languages at home
- 93% English-only · Other Indo-European 2% Spanish 1% Russian/Polish/Slavic 1%
Political lean MEDSL · Onondaga
- 2024 margin
- D (+17.3) · D 58.6% · R 41.4%
- 2008→2024 swing
- -3.0pp toward R · 2008: 20.3pp · 2024: 17.3pp
- All cycles
- 2024: D+17.3 2020: D+20.6 2016: D+12.8 2012: D+21.1 2008: D+20.3
Not yet ingested
- Civics
- —
Market trends
- HPI YoY
- ▼ -228.53%
- Current HPI
- 320.4989
- Rent YoY
- —
- Metro
- Syracuse, NY
- State GDP YoY
- ▲ 2.60%
- F500 in state
- 92
Industry mix (Fortune 500 HQ in NY)
| Industry | F500 HQs | Revenue |
|---|---|---|
| Financial Services | 10 | $950B |
|
||
| Consumer Goods | 9 | $162B |
|
||
| Insurance | 4 | $225B |
|
||
| Telecommunications | 2 | $144B |
|
||
| Pharmaceuticals | 2 | $112B |
|
||
| Media / Entertainment | 2 | $69B |
|
||
Price history
-1.6% since first listed3 events — show timeline
- 2026-04-09 Pending — CNYIS
- 2026-04-04 Price Changed $176,999 CNYIS
- 2026-03-27 Listed $179,900 CNYIS
Cash-flow waterfall
monthlySold comps — $/sqft
last 12 mo · ≤1 miLoading sold comps…