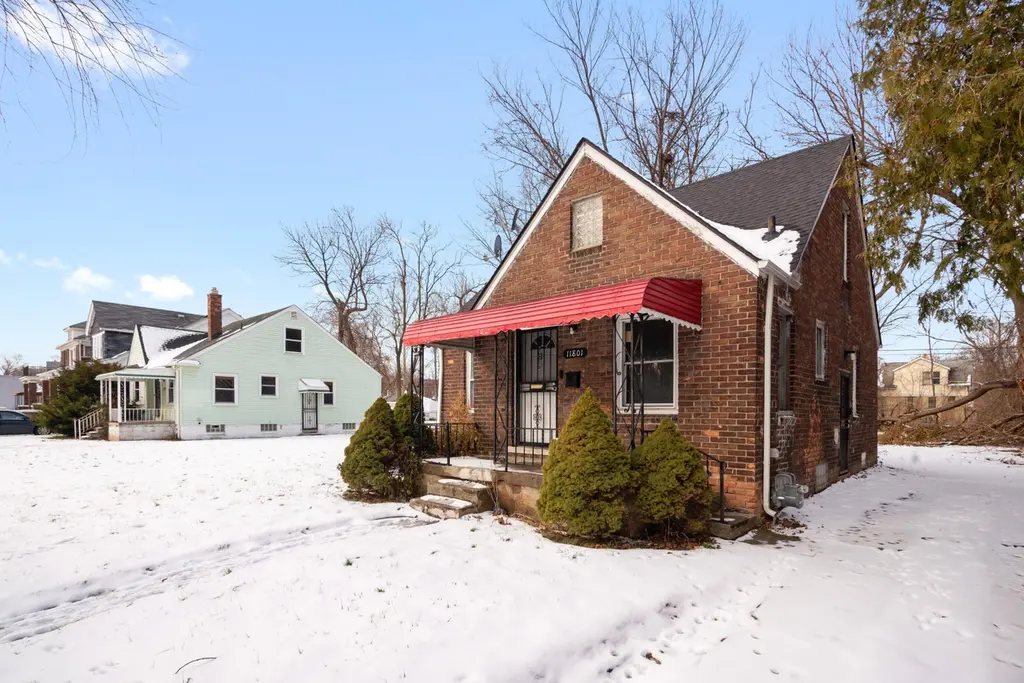
11801 Elmdale St · Detroit, MI
Flood risk 2/10 · Minimal
- FEMA flood zone
- X (unshaded)
- Chance of flooding over 30 yrs
- 0.09%
- Est. flood insurance / yr
- $473 – $860
Fire risk 1/10 · Minimal
- Est. fire insurance / yr
- $784 – $1,456
Heat risk 3/10 · Minor
- Hot days now (above 96°F)
- 7 days/yr
- Hot days in 30 yrs
- 14 days/yr
Wind risk 2/10 · Minimal
- Chance of severe wind over 30 yrs
- —
Air-quality risk 3/10 · Minor
- Unhealthy air days now
- 2 days/yr
- Unhealthy air days in 30 yrs
- 5 days/yr
Risk factors via First Street. Map © Google.
Why this score? — see what drove the B- grade
The composite is a weighted blend of 9 inputs, each scored 0–100. Each bar is that input's sub-score; the figure is the points it added to the 100-point composite (weight × sub-score).
- Cash flow +30.0/30.0
- 1% rule +10.0/10.0
- DSCR +10.0/10.0
- ARV discount +9.1/15.0
- Livability +3.7/5.0
- Rent growth +2.5/5.0
- Condition / age +2.5/5.0
- Schools +1.3/10.0
- Appreciation +0.0/10.0
$40,000
🖨 Deal sheet 📄 Offer letter ✓ Due diligence
Listing remarks MLS
This turnkey brick bungalow is the perfect opportunity for both seasoned investors and first-time buyers. With 3 bedrooms, 1 full bath, and a functional layout, this home used to rented out for $1,300/month, making it an ideal cash-flowing asset from day one. The main level features a light-filled living space, cozy dining area, and an efficient kitchen setup--clean, updated, and ready to go. Two bedrooms and a full bath complete the first floor, while the entire second story offers a spacious third bedroom or flex space that's perfect for a private suite, office, or creative zone . Classic curb appeal shines with a brick exterior, front porch, and a deep lot offering future backyard potential.
Key facts
- Brick bungalow
- Cozy dining area
- Private suite
Tags
Neighborhood map
What this means for you Summary
Snapshot
- This is a 3-bed/1.0-bath single-family listed at $40k.
Deal economics
- At list price, monthly cash flow is $643 ($8k/yr) — positive.
- The deal already cash-flows at list — no discount required.
- Meets the 1% rule at list price ($1k rent vs $40k).
- Recommended offer: $38k (6.0% below list) — sets the bar for market timing.
- Cap rate 25.6% vs local median 10.2% in Detroit — top-decile yield for the area; either an underpriced asset or a hidden risk that comps aren't pricing in. Stress-test before assuming the spread holds.
Location & tenants
- Location reads 73/100 on livability (#218 in MI) — a middle-class / working-renter tenant base. Strengths: amenities A+, commute A+, cost of living A+; Watch: schools F, crime F, employment F.
- Detroit Public Schools Community District (urban): math 10% / reading 24% proficiency, ranked #499 of 540 in MI (top 92%) — low school quality limits family demand, transient renter base, plan for 1-2y turnover; 90% free/reduced lunch — lower-income household profile, screen leases tightly.
- Market conditions: 190 active listings in the ZIP; 13 comparable units currently listed for rent nearby; rentals at typical pace (median 17d on market — plan ~3-4 weeks tenant-placement turnaround); lower-income renter base — watch delinquency; 2,639 units permitted in Wayne County in 2024 (1,216 in 5+ unit buildings).
- This rent runs 45% of the median local income ($34k/yr) — at the standard rent-burdened threshold; future hikes will face affordability resistance.
Forward outlook
- Local home prices are declining (-3.0%/yr); year-one equity from $277 of loan paydown is wiped out by about $1k of value loss. Plan a longer hold.
- Wayne County population projected at -17% by 2050 — secular population decline; favor cash flow + early exit over multi-decade hold.
- At projected returns (-3.0% appreciation + 3.0% rent growth), your $11k cash investment doubles in ~2 years — after that, you're playing with house money.
Negotiation context
- It's been on market 78 days — a 6% lower offer ($38k) is reasonable based on typical stale-listing flexibility.
- 8 sale attempts since 22y ago; this cycle's ask has dropped $19k (32%) from the opening price — seller is motivated, your offer sets the floor, not the list.
- Current owner paid $20k; list at $40k implies a 95% gain — meaningful room to come down on a strong offer.
Risks & watch-outs
- Watch-outs: property tax is 4.0% of price; built in 1940 — expect roof / HVAC / electrical / plumbing capex.
Questions for the listing agent
- It's been on market 78 days. Have you received any prior offers? Is the seller open to a 6% concession, seller financing, or rate buy-down credit?
- Built in 1940 — when were the roof, HVAC, electrical panel, plumbing, and water heater last replaced?
- Property tax is high relative to price — has the assessment been appealed recently, and will the sale trigger a re-assessment?
- Why hasn't it sold? Are there any deal-killer items the seller is aware of (foundation, flood, title, zoning, code violations)?
- Is there a deadline driving the sale (1031 exchange, divorce, estate, relocation)? That informs how much negotiation room exists.
- Schools are F-rated, which usually means shorter tenancies and higher turnover. Who's the typical renter profile here, and what's been the actual vacancy rate?
- Crime grade is F in this area — have there been break-ins, vandalism, or insurance claims at this property in the last 3 years? What carrier currently insures it and at what premium?
- What's the average days-on-market for RENTAL listings here right now (not sales)? A rising rental-DOM trend means longer vacancies and softer asking-rent achievability than the comps imply.
- What's the recent tenant-quality profile in this submarket — average credit score on applications, eviction rate, late-payment / NSF rate, and stable-employment percentage? A property-management company in the area should have these aggregated.
- How much new for-sale + rental construction is in the pipeline within 1–3 miles? Heavy new supply typically softens prices + rents 12–24 months out; constrained supply supports both.
Investment metrics
- 1% rule
- 3.18% ✓
- Cap rate
- 25.58%
- Cash-on-cash
- 68.89%
- DSCR
- 4.07
- GRM
- 2.6
CMA / ARV
- ARV (median comp)
- $41,491
- List price
- $40,000
- Delta
- -3.59%
- Verdict
- FAIR
- Comps
- 20 within 1.0 mi
Show comp detail 10 sales within ~0.75 mi
| Address | Dist | Beds/Ba | Sqft | Sold | Price | $/sf | Match |
|---|---|---|---|---|---|---|---|
| 12561 Maiden St | 0.48mi | 3/1.0 | 963 (+5%) | 1mo | $69,690 | $72 | 68 |
| 12016 Elmdale St | 0.10mi | 2/1.0 (-1) | 948 (+4%) | 24mo | $60,000 | $63 | 65 |
| 12521 Chelsea St | 0.44mi | 2/1.0 (-1) | 953 (+4%) | 18mo | $27,000 | $28 | 53 |
| 11151 Rosemary St | 0.52mi | 3/1.0 | 1,000 (+9%) | 10mo | $29,900 | $30 | 52 |
| 12527 Glenfield St | 0.71mi | 3/1.0 | 935 (+2%) | 16mo | $22,000 | $24 | 50 |
| 12623 Wade St | 0.54mi | 3/1.0 | 948 (+4%) | 22mo | $30,000 | $32 | 50 |
| 12389 Camden St | 0.46mi | 2/1.0 (-1) | 864 (-6%) | 18mo | $40,000 | $46 | 50 |
| 12534 Evanston St | 0.56mi | 3/1.0 | 960 (+5%) | 21mo | $65,000 | $68 | 48 |
| 12541 Camden St | 0.49mi | 2/1.0 (-1) | 1,014 (+11%) | 9mo | $29,525 | $29 | 46 |
| 8801 E Outer Dr | 0.62mi | 3/1.5 | 1,047 (+14%) | 1mo | $40,000 | $38 | 44 |
Match score weights: distance 35% · size 25% · config 20% · recency 20%. Top-matched comps best support the ARV.
Projected returns pro-forma
-3.0% appreciation · 3.0% rent growth · sell at horizon
- IRR
- 68.4%
- Equity multiple
- 4.08×
- Total profit
- $34,540
- Equity at exit
- $5,964
- IRR
- 72.5%
- Equity multiple
- 8.42×
- Total profit
- $83,096
- Equity at exit
- $3,458
Cash invested: $11,200 (down + closing). Projections, not guarantees.
Landlord ↔ Tenant lean methodology
- Overall (STATE)
- 62 Landlord-Friendly
- State Michigan
- 62 Landlord-Friendly · EVEN
- County
- — inherits STATE
- City
- — inherits STATE
ZIP-level market 48213
- Active inventory
- 190
- Price-to-rent
- 2.6×
Monthly cashflow live
- Estimated rent
- $1,271 high interval (Pro) →
- Mortgage (P&I)
- −$210
- Tax from tax record
- −$134 /mo · $1,612/yr
- Insurance
- −$17
- HOA
- −$0
- Vacancy / Maint / Mgmt
- −$267
- Net cashflow
- $643
Break-even live
UW: 25.0% down · 7.5% · 30yr · 1.5% tax · 5.0% vac · 8.0% maint · 8.0% mgmt
Financing live
Cash to close
- Down payment
- $10,000
- Closing costs
- $1,200
- Reserves months
- —
- Total cash needed
- —
Loan-product check · same deal, 3 products live
Conventional
25% down · 7.5% · 30yr
- Down + closing
- —
- Monthly P&I
- —
- Monthly cashflow
- —
- DSCR
- —
- Eligible?
- —
Personal DTI + credit; lowest rate.
DSCR
20% down · 8.5% · 30yr
- Down + closing
- —
- Monthly P&I
- —
- Monthly cashflow
- —
- DSCR
- —
- Eligible?
- —
No personal income docs; deal must DSCR.
Hard money
10% down · 12.0% · 12mo
- Down + closing
- —
- Monthly P&I
- —
- Monthly cashflow
- —
- DSCR
- —
- Eligible?
- —
Short-term bridge; refi at stabilization.
Rent comps 13 comps
| Address | Beds | Baths | Sqft | Rent | $/sqft | DOM | Units | Dist |
|---|---|---|---|---|---|---|---|---|
| 12210 Longview St Detroit, MI | 3.0 | 1.0 | 1020 | $1,100 | $1.08 | 43d | 1 | 0.27mi |
| 11765 Glenfield Ave Unit 1510880P Detroit, MI | 2.0 | 1.0 | 990 | $3,102 | $3.13 | 14d | 1 | 0.59mi |
| 13067 Wade St Detroit, MI | 2.0 | 1.0 | 660 | $900 | $1.36 | 4d | 1 | 0.81mi |
| 13137 Elmdale St Detroit, MI | 3.0 | 1.0 | 1115 | $1,400 | $1.26 | 24d | 1 | 0.85mi |
| 12110 Christy St Detroit, MI | 2.0 | 1.5 | 950 | $1,200 | $1.26 | 17d | 1 | 0.96mi |
| 12112 Christy St Unit 12110 Detroit, MI | 2.0 | 1.0 | 950 | $1,200 | $1.26 | 43d | 1 | 0.96mi |
| 13400 Longview St Detroit, MI | 3.0 | 1.5 | 1000 | $1,400 | $1.40 | 43d | 1 | 0.98mi |
| 12740 August St Detroit, MI | 2.0 | 1.0 | 900 | $1,300 | $1.44 | 4d | 1 | 1.09mi |
| 11700 Engleside St Detroit, MI | 3.0 | 1.0 | 1000 | $1,175 | $1.18 | 43d | 1 | 1.19mi |
| 9142 Isham Detroit, MI | 3.0 | 1.0 | 1000 | $1,344 | $1.34 | 17d | 1 | 1.21mi |
| 9354 Bessemore St Detroit, MI | 3.0 | 1.0 | 1125 | $1,294 | $1.15 | 17d | 1 | 1.26mi |
| 9190 Hayes St Unit 1 Detroit, MI | 2.0 | 1.0 | 750 | $850 | $1.13 | 14d | 1 | 1.30mi |
| 5342 Cooper St Detroit, MI | 3.0 | 1.0 | 1125 | $1,200 | $1.07 | 24d | 1 | 1.41mi |
Listing history 44 events
-
2026-06-18days on market $40,000 Active 78 DOM
-
2026-06-17days on market $40,000 Active 77 DOM
-
2026-06-15days on market $40,000 Active 75 DOM
-
2026-06-13days on market $40,000 Active 73 DOM
-
2026-06-13days on market $40,000 Active 72 DOM
-
2026-06-09days on market $40,000 Active 69 DOM
-
2026-06-08days on market $40,000 Active 68 DOM
-
2026-06-07pricedays on market $40,000 Active 67 DOM
-
2026-06-04days on market $45,900 Active 64 DOM
-
2026-06-03days on market $45,900 Active 63 DOM
-
2026-06-02days on market $45,900 Active 62 DOM
-
2026-06-01days on market $45,900 Active 61 DOM
-
2026-05-31days on market $45,900 Active 60 DOM
-
2026-04-15price $45,900 703-char remark
Show marketing remark (704 chars)
This turnkey brick bungalow is the perfect opportunity for both seasoned investors and first-time buyers. With 3 bedrooms, 1 full bath, and a functional layout, this home used to rented out for $1,300/month, making it an ideal cash-flowing asset from day one. The main level features a light-filled living space, cozy dining area, and an efficient kitchen setup--clean, updated, and ready to go. Two bedrooms and a full bath complete the first floor, while the entire second story offers a spacious third bedroom or flex space that's perfect for a private suite, office, or creative zone . Classic curb appeal shines with a brick exterior, front porch, and a deep lot offering future backyard potential.
-
2026-04-15price $45,900 704-char remark
Show marketing remark (704 chars)
This turnkey brick bungalow is the perfect opportunity for both seasoned investors and first-time buyers. With 3 bedrooms, 1 full bath, and a functional layout, this home used to rented out for $1,300/month, making it an ideal cash-flowing asset from day one. The main level features a light-filled living space, cozy dining area, and an efficient kitchen setup--clean, updated, and ready to go. Two bedrooms and a full bath complete the first floor, while the entire second story offers a spacious third bedroom or flex space that's perfect for a private suite, office, or creative zone . Classic curb appeal shines with a brick exterior, front porch, and a deep lot offering future backyard potential.
-
2026-04-15price $45,900
Show marketing remark (704 chars)
This turnkey brick bungalow is the perfect opportunity for both seasoned investors and first-time buyers. With 3 bedrooms, 1 full bath, and a functional layout, this home used to rented out for $1,300/month, making it an ideal cash-flowing asset from day one. The main level features a light-filled living space, cozy dining area, and an efficient kitchen setup--clean, updated, and ready to go. Two bedrooms and a full bath complete the first floor, while the entire second story offers a spacious third bedroom or flex space that's perfect for a private suite, office, or creative zone . Classic curb appeal shines with a brick exterior, front porch, and a deep lot offering future backyard potential.
-
2026-04-01$58,900 Active 703-char remark
Show marketing remark (704 chars)
This turnkey brick bungalow is the perfect opportunity for both seasoned investors and first-time buyers. With 3 bedrooms, 1 full bath, and a functional layout, this home used to rented out for $1,300/month, making it an ideal cash-flowing asset from day one. The main level features a light-filled living space, cozy dining area, and an efficient kitchen setup--clean, updated, and ready to go. Two bedrooms and a full bath complete the first floor, while the entire second story offers a spacious third bedroom or flex space that's perfect for a private suite, office, or creative zone . Classic curb appeal shines with a brick exterior, front porch, and a deep lot offering future backyard potential.
-
2026-04-01$58,900 Active 704-char remark
Show marketing remark (704 chars)
This turnkey brick bungalow is the perfect opportunity for both seasoned investors and first-time buyers. With 3 bedrooms, 1 full bath, and a functional layout, this home used to rented out for $1,300/month, making it an ideal cash-flowing asset from day one. The main level features a light-filled living space, cozy dining area, and an efficient kitchen setup--clean, updated, and ready to go. Two bedrooms and a full bath complete the first floor, while the entire second story offers a spacious third bedroom or flex space that's perfect for a private suite, office, or creative zone . Classic curb appeal shines with a brick exterior, front porch, and a deep lot offering future backyard potential.
-
2026-04-01$58,900 Active
Show marketing remark (704 chars)
This turnkey brick bungalow is the perfect opportunity for both seasoned investors and first-time buyers. With 3 bedrooms, 1 full bath, and a functional layout, this home used to rented out for $1,300/month, making it an ideal cash-flowing asset from day one. The main level features a light-filled living space, cozy dining area, and an efficient kitchen setup--clean, updated, and ready to go. Two bedrooms and a full bath complete the first floor, while the entire second story offers a spacious third bedroom or flex space that's perfect for a private suite, office, or creative zone . Classic curb appeal shines with a brick exterior, front porch, and a deep lot offering future backyard potential.
-
2026-04-01historical
Show marketing remark (704 chars)
This turnkey brick bungalow is the perfect opportunity for both seasoned investors and first-time buyers. With 3 bedrooms, 1 full bath, and a functional layout, this home used to rented out for $1,300/month, making it an ideal cash-flowing asset from day one. The main level features a light-filled living space, cozy dining area, and an efficient kitchen setup--clean, updated, and ready to go. Two bedrooms and a full bath complete the first floor, while the entire second story offers a spacious third bedroom or flex space that's perfect for a private suite, office, or creative zone . Classic curb appeal shines with a brick exterior, front porch, and a deep lot offering future backyard potential.
-
2026-03-31historical
-
2026-02-21price $58,900
-
2026-02-20price $58,900
-
2026-02-20price $58,900
-
2026-02-07price $68,900
-
2026-02-06price $68,900
-
2026-02-06price $68,900
-
2026-01-31price $72,900
-
2026-01-30price $72,900
-
2026-01-30price $72,900
-
2026-01-22price $78,900
-
2026-01-21price $78,900
-
2026-01-21price $78,900
-
2026-01-09$85,000 Active
-
2026-01-09$85,000 Active
-
2026-01-07historical
-
2005-02-01soldstatus $20,500
-
2005-01-04historical
-
2004-11-14$21,500
-
2004-10-25historical
-
2004-10-25historical
-
2004-09-29$21,500
-
2004-09-29$21,500
-
2003-07-29soldstatus $80,000
ⓘ Source: listings_history table (triggers on properties + properties_extension) + one-shot
backfill from property_details.listing_events for pre-trigger history.
Tax reassessment forecast MI · Partial reset (capped growth)
- Current annual tax
- $1,612 · $134/mo
- Projected year-2 tax
- $1,612 · $134/mo
- Expected delta
- $0/yr ($0/mo · 0.0%)
ⓘ Screening estimate from a state-policy table — verify with the county assessor before closing.
Climate risk First Street
- Flood 2/10 Low FEMA zone X (unshaded) · 9% chance over 30 yrs
- Wildfire 1/10 Low
- Heat 3/10 Moderate 7 d/yr ≥96°F today · 14 d/yr by 30 yrs out
- Wind 2/10 Low
- Air quality 3/10 Moderate 2 unhealthy d/yr today · 5 by 30 yrs out
Nearby sold comps map
Loading sold comps map…
Walkable amenities ~0.75 mi
Loading nearby amenities…
Taxation est. · year 1
- Rental income
- $15,246
- − Mortgage interest
- −$2,241
- − Property taxes
- −$1,612
- − Insurance
- −$200
- − Repairs & maintenance
- −$1,220
- − Management
- −$1,220
- − Depreciation
- −$1,164
- Taxable income
- $7,591
- Est. tax owed @ 24.0%
- −$1,822
- After-tax cash flow
- $5,894/yr
For passive investors: Depreciation is non-cash, so a rental often shows a tax loss while cash-flowing — sheltering income. Rental losses are passive: they offset passive income freely, and up to $25,000/yr can offset ordinary (W-2) income if you actively participate and your MAGI is under $100k (phasing out to $0 by $150k); unused losses carry forward. On sale, claimed depreciation is recaptured at up to 25%, and gains may owe capital-gains tax (a 1031 exchange can defer both). Figures are a year-1 estimate at your 24.0% rate — not tax advice; consult a CPA.
Schools (NCES district)
- District
- Detroit Public Schools Community District
- NCES district ID
- 2601103
- Math proficiency
- 10% ▼ -2.00%
- Reading proficiency
- 24% ▲ 6.00%
- Median HH income
- $25,815
- Composite
- 13.06/100
- National rank
- #9564
- State rank
- #499 of 540 in MI
Livability — Detroit
- Score
- 73/100
- State rank
- #218
- US rank
- #5427
Category grades
Schools grade is shown separately in the Schools card above.
Census & demographics
- Census place
- Detroit, MI
- County
- Wayne County · 1,562,939 people
- City population
- 572,865
- Metro
- Detroit-Warren-Dearborn, MI
- Population (ZIP)
- 20,075
- Household income
- $34,003
- Rent vs Own
- Severe rent burden
- 1202.0
Population outlook (Wayne County) Hauer SSP2
- Today (2025)
- 1,675,273 people
- By 2030
- 1,620,300 · -3.3%
- By 2040
- 1,502,341 · -10.3%
- By 2050
- 1,384,039 · -17.4%
- By 2075
- 1,124,592 · -32.9%
- By 2100
- 881,193 · -47.4%
Race, ethnicity, and origin ACS 2023
- Neighborhood character
- Predominantly Black (92%)
- Race & ethnicity
- Black 92% White 4% Hispanic / Latino 2% Two or more races 1%
- Common ancestry
- Slovak 1%
- Foreign-born
- 2% · Canada
- Languages at home
- 97% English-only · Arabic 1% Spanish 1%
Political lean MEDSL · Wayne
- 2024 margin
- Strong D (+29.0) · D 62.7% · R 33.7% · Other 3.6%
- 2008→2024 swing
- -20.5pp toward R · 2008: 49.5pp · 2024: 29.0pp
- All cycles
- 2024: D+29.0 2020: D+38.1 2016: D+37.3 2012: D+46.9 2008: D+49.5
Not yet ingested
- Civics
- —
Market trends
- HPI YoY
- ▼ -122.86%
- Current HPI
- 217.2037
- Rent YoY
- —
- Metro
- Detroit-Warren-Dearborn, MI
- State GDP YoY
- ▲ 1.37%
- F500 in state
- 28
Industry mix (Fortune 500 HQ in MI)
| Industry | F500 HQs | Revenue |
|---|---|---|
| Automotive Parts | 3 | $48B |
|
||
| Automotive | 2 | $372B |
|
||
| Chemicals | 1 | $45B |
|
||
| Automotive Retail | 1 | $29B |
|
||
| Healthcare / Medical Devices | 1 | $23B |
|
||
| Automotive Technology | 1 | $20B |
|
||
Price history
-42.6% since first listed31 events — show timeline
- 2026-04-15 Price Changed $45,900 MiRealSource-MiMLS
- 2026-04-15 Price Changed $45,900 REALCOMP
- 2026-04-15 Price Changed $45,900 SW Michigan MLS
- 2026-04-01 Listing Removed — MiRealSource-MiMLS
- 2026-04-01 Listed $58,900 SW Michigan MLS
- 2026-04-01 Listed $58,900 REALCOMP
- 2026-04-01 Listed $58,900 MiRealSource-MiMLS
- 2026-03-31 Listing Removed — REALCOMP
- 2026-02-21 Price Changed $58,900 MiRealSource-MiMLS
- 2026-02-20 Price Changed $58,900 REALCOMP
- 2026-02-20 Price Changed $58,900 SW Michigan MLS
- 2026-02-07 Price Changed $68,900 MiRealSource-MiMLS
- 2026-02-06 Price Changed $68,900 REALCOMP
- 2026-02-06 Price Changed $68,900 SW Michigan MLS
- 2026-01-31 Price Changed $72,900 MiRealSource-MiMLS
- 2026-01-30 Price Changed $72,900 REALCOMP
- 2026-01-30 Price Changed $72,900 SW Michigan MLS
- 2026-01-22 Price Changed $78,900 MiRealSource-MiMLS
- 2026-01-21 Price Changed $78,900 REALCOMP
- 2026-01-21 Price Changed $78,900 SW Michigan MLS
- 2026-01-09 Listed $85,000 REALCOMP
- 2026-01-09 Listed $85,000 MiRealSource-MiMLS
- 2026-01-07 Coming Soon — MiRealSource-MiMLS
- 2005-02-01 Sold (MLS) $20,500 MiRealSource-MiMLS
- 2005-01-04 Listing Removed — MiRealSource-MiMLS
- 2004-11-14 Listed $21,500 MiRealSource-MiMLS
- 2004-10-25 Listing Removed — REALCOMP
- 2004-10-25 Listing Removed — MiRealSource-MiMLS
- 2004-09-29 Listed $21,500 REALCOMP
- 2004-09-29 Listed $21,500 MiRealSource-MiMLS
- 2003-07-29 Sold (Public Records) $80,000 Public Records
Property tax history
+3.3%/yrLatest (2025): $1,612 · -54.2% YoY. Source: county tax records.
Cash-flow waterfall
monthlySold comps — $/sqft
last 12 mo · ≤1 miLoading sold comps…