 Duplex
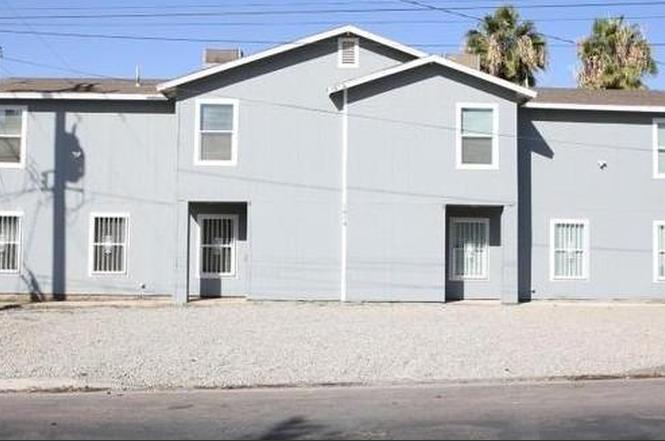
1814 Virginia St · East Bakersfield, CA
Flood risk 1/10 · Minimal
- FEMA flood zone
- X (unshaded)
- Chance of flooding over 30 yrs
- 0.0%
- Est. flood insurance / yr
- $507 – $1,088
Fire risk 1/10 · Minimal
- Est. fire insurance / yr
- $659 – $1,223
Heat risk 8/10 · Major
- Hot days now (above 105°F)
- 7 days/yr
- Hot days in 30 yrs
- 19 days/yr
Wind risk 1/10 · Minimal
- Chance of severe wind over 30 yrs
- —
Air-quality risk 10/10 · Severe
- Unhealthy air days now
- 39 days/yr
- Unhealthy air days in 30 yrs
- 45 days/yr
Risk factors via First Street. Map © Google.
Why this score? — see what drove the B grade
The composite is a weighted blend of 9 inputs, each scored 0–100. Each bar is that input's sub-score; the figure is the points it added to the 100-point composite (weight × sub-score).
- Cash flow +28.3/30.0
- ARV discount +10.9/15.0
- DSCR +10.0/10.0
- 1% rule +8.4/10.0
- Rent growth +4.2/5.0
- Schools +3.4/10.0
- Livability +2.5/5.0
- Condition / age +2.5/5.0
- Appreciation +0.0/10.0
$239,900
🖨 Deal sheet (PDF) 📄 Offer letter ✓ Due diligence
Multi-family units
County records classify this as Multi-Family (2-4 Unit). Listing-text estimate: 2 units. confirmed
Listing remarks MLS
This duplex was built in 2017, this property features 6 bedrooms 4 bathrroms and 2,849 sq ft of living space.
Key facts
- 3,920 sq ft lot
- Built 2017
Neighborhood map
What this means for you Summary
Snapshot
- This is a 2 × 3-bed/2.0-bath units multifamily listed at $240k.
Deal economics
- At list price, monthly cash flow is $767 ($9k/yr) — positive. Per door: $383/mo.
- The deal already cash-flows at list — no discount required.
- Meets the 1% rule at list price ($3k rent vs $240k).
Location & tenants
- Location reads: area grade B — affects rentability + tenant quality, not the cash-flow math above.
- Kern High (urban): math 21% / reading 51% proficiency, ranked #860 of 1,400 in CA (top 61%) — families likely to look elsewhere, expect single-tenant / working-renter base with shorter leases.
- Market conditions: Rents rising fast (+6.8%/yr); 143 active listings in the ZIP; lower-income renter base — watch delinquency; 3,244 units permitted in Kern County in 2024 (73 in 5+ unit buildings).
- At $3,212/mo this rent would consume 89% of the median local household income ($43k/yr) (locally 2376% of renters already pay >50% of income on rent) — very limited rent-growth headroom before tenants either downsize or default.
Forward outlook
- Local home prices are declining (-3.0%/yr); year-one equity from $2k of loan paydown is wiped out by about $7k of value loss. Plan a longer hold.
- Kern County population projected at +17% by 2050 — long-run rental-demand tailwind backs the buy-and-hold thesis.
- At projected returns (-3.0% appreciation + 6.8% rent growth), your $67k cash investment doubles in ~7 years — after that, you're playing with house money.
Negotiation context
- Only 0 days on market — expect competitive offers; lowballing is unlikely to land.
- 8 sale attempts since 11y ago with the ask held roughly flat each time — persistent listings suggest the price (not the market) is what's stuck; bring a comps-based counter.
Risks & watch-outs
- Climate carrying-cost: extreme-heat days projected 7→19/yr by 2055 (HVAC capex compounding) — expect insurance premiums to compound above CPI over the hold.
Questions for the listing agent
- Can we see the unit-by-unit rent roll, current vacancy, and any below-market leases? What's the average tenancy length?
- What capital expenditures (roof, boiler, parking lot, exteriors) have been made in the last 5 years, and what's planned in the next 2?
- Is there a deadline driving the sale (1031 exchange, divorce, estate, relocation)? That informs how much negotiation room exists.
- What's the average days-on-market for RENTAL listings here right now (not sales)? A rising rental-DOM trend means longer vacancies and softer asking-rent achievability than the comps imply.
- What's the recent tenant-quality profile in this submarket — average credit score on applications, eviction rate, late-payment / NSF rate, and stable-employment percentage? A property-management company in the area should have these aggregated.
- How much new apartment / multifamily construction is in the pipeline within 1–3 miles? Heavy new supply (>2% of stock underway) typically softens rents 12–24 months out; light construction supports rent growth.
Investment metrics
- 1% rule
- 1.34% ✓
- Cap rate
- 10.13%
- Cash-on-cash
- 13.69%
- DSCR
- 1.61
- GRM
- 6.2
CMA / ARV
- ARV (on-the-fly)
- $259,259
- Comps found
- 1
Show comp detail 1 sale within ~0.75 mi
| Address | Dist | Beds/Ba | Sqft | Sold | Price | $/sf | Match |
|---|---|---|---|---|---|---|---|
| 1529 Palm Dr | 0.37mi | 7/3.0 (+1) | 2,761 (-3%) | 18mo | $250,000 | $91 | 53 |
Match score weights: distance 35% · size 25% · config 20% · recency 20%. Top-matched comps best support the ARV.
Projected returns pro-forma
-3.0% appreciation · 6.79% rent growth · sell at horizon
- IRR
- 8.3%
- Equity multiple
- 1.34×
- Total profit
- $22,782
- Equity at exit
- $35,770
- IRR
- 20.7%
- Equity multiple
- 3.08×
- Total profit
- $139,599
- Equity at exit
- $20,742
Cash invested: $67,172 (down + closing). Projections, not guarantees.
Landlord ↔ Tenant lean methodology
- Overall (STATE)
- 18 Strongly Tenant-Friendly
- State California
- 18 Strongly Tenant-Friendly · D+13
- County
- — inherits STATE
- City
- — inherits STATE
ZIP-level market 93305
- Home prices YoY
- -29.9%
- Rents YoY
- 6.8%
- Active inventory
- 143
- Price-to-rent
- 12.4×
Monthly cashflow live
- Estimated rent
- $3,212 high interval (Pro) →
- Mortgage (P&I)
- −$1,258
- Tax from tax record
- −$413 /mo · $4,955/yr
- Insurance
- −$100
- HOA
- −$0
- Vacancy / Maint / Mgmt
- −$675
- Net cashflow
- $767
Break-even live
Sensitivity live
| Price | -10% $902 | -5% $834 | +0% $767 | +5% $699 | +10% $631 |
|---|---|---|---|---|---|
| Rent | -10% $513 | -5% $640 | +0% $767 | +5% $893 | +10% $1,020 |
| Rate | -1.0pp $887 | -0.5pp $828 | base $767 | +0.5pp $704 | +1.0pp $641 |
2-unit breakdown (identical units grouped — click to expand)
| Units | Beds | Baths | Est. rent |
|---|---|---|---|
| 2× units | 3 | 2 | $3,212 |
| #1 | 3 | 2 | $1,606 |
| #2 | 3 | 2 | $1,606 |
| Total (2 units) | $3,212 | ||
UW: 25.0% down · 7.5% · 30yr · 1.5% tax · 5.0% vac · 8.0% maint · 8.0% mgmt
Financing live
Cash to close
- Down payment
- $59,975
- Closing costs
- $7,197
- Reserves months
- —
- Total cash needed
- —
Loan-product check · same deal, 3 products live
Conventional
25% down · 7.5% · 30yr
- Down + closing
- —
- Monthly P&I
- —
- Monthly cashflow
- —
- DSCR
- —
- Eligible?
- —
Personal DTI + credit; lowest rate.
DSCR
20% down · 8.5% · 30yr
- Down + closing
- —
- Monthly P&I
- —
- Monthly cashflow
- —
- DSCR
- —
- Eligible?
- —
No personal income docs; deal must DSCR.
Hard money
10% down · 12.0% · 12mo
- Down + closing
- —
- Monthly P&I
- —
- Monthly cashflow
- —
- DSCR
- —
- Eligible?
- —
Short-term bridge; refi at stabilization.
Listing history 35 events
-
2025-05-29historical
-
2020-08-06soldstatus $240,000 109-char remark
Show marketing remark (108 chars)
This duplex was built in 2017, this property features 6 bedrooms, 4 bathrooms, and 2,849 sq of living space.
-
2020-08-06soldstatus $240,000 Sold 108-char remark
Show marketing remark (108 chars)
This duplex was built in 2017, this property features 6 bedrooms, 4 bathrooms, and 2,849 sq of living space.
-
2020-08-06soldstatus $240,000
Show marketing remark (108 chars)
This duplex was built in 2017, this property features 6 bedrooms, 4 bathrooms, and 2,849 sq of living space.
-
2020-06-17status Pending 108-char remark
Show marketing remark (108 chars)
This duplex was built in 2017, this property features 6 bedrooms, 4 bathrooms, and 2,849 sq of living space.
-
2020-04-08$239,900
Show marketing remark (108 chars)
This duplex was built in 2017, this property features 6 bedrooms, 4 bathrooms, and 2,849 sq of living space.
-
2020-04-08$239,900 109-char remark
Show marketing remark (108 chars)
This duplex was built in 2017, this property features 6 bedrooms, 4 bathrooms, and 2,849 sq of living space.
-
2020-04-08$239,900 Active 108-char remark
Show marketing remark (108 chars)
This duplex was built in 2017, this property features 6 bedrooms, 4 bathrooms, and 2,849 sq of living space.
-
2019-01-10price $210,000
-
2019-01-07soldstatus $210,000 Sold
-
2018-11-21status Pending
-
2018-11-20price $220,000
-
2018-10-25$220,000 Active
-
2018-08-02price $229,000
-
2018-06-05price $239,000
-
2017-09-14historical
-
2017-09-14historical
-
2017-07-11$259,000 Active
-
2017-07-10$259,000
-
2017-06-05price $269,900
-
2017-05-22price $269,999
-
2017-05-18price $299,999
-
2016-06-01price $20,000
-
2016-05-31soldstatus $20,000 Sold
-
2016-05-31soldstatus $20,000
-
2016-05-20historical
-
2016-05-19price $24,000
-
2016-04-20price $24,000
-
2016-04-04price $27,500
-
2016-02-25$32,500 Active
-
2015-06-18soldstatus $8,900
-
2015-04-17historical
-
2015-04-17price $14,900
-
2015-01-21$8,900
-
1986-07-28soldstatus $22,000
ⓘ Source: listings_history table (triggers on properties + properties_extension) + one-shot
backfill from property_details.listing_events for pre-trigger history.
Tax reassessment forecast CA · Resets to sale price
- Current annual tax
- $4,955 · $413/mo
- Projected year-2 tax
- $4,955 · $413/mo
- Expected delta
- $0/yr ($0/mo · 0.0%)
ⓘ Screening estimate from a state-policy table — verify with the county assessor before closing.
Climate risk First Street
- Flood 1/10 Low FEMA zone X (unshaded) · 0% chance over 30 yrs
- Wildfire 1/10 Low
- Heat 8/10 Severe 7 d/yr ≥105°F today · 19 d/yr by 30 yrs out
- Wind 1/10 Low
- Air quality 10/10 Extreme 39 unhealthy d/yr today · 45 by 30 yrs out
Nearby sold comps map
Loading sold comps map…
Walkable amenities ~0.75 mi
Loading nearby amenities…
Taxation est. · year 1
- Rental income
- $38,544
- − Mortgage interest
- −$13,438
- − Property taxes
- −$4,955
- − Insurance
- −$1,200
- − Repairs & maintenance
- −$3,084
- − Management
- −$3,084
- − Depreciation
- −$6,979
- Taxable income
- $5,806
- Est. tax owed @ 24.0%
- −$1,393
- After-tax cash flow
- $7,805/yr
For passive investors: Depreciation is non-cash, so a rental often shows a tax loss while cash-flowing — sheltering income. Rental losses are passive: they offset passive income freely, and up to $25,000/yr can offset ordinary (W-2) income if you actively participate and your MAGI is under $100k (phasing out to $0 by $150k); unused losses carry forward. On sale, claimed depreciation is recaptured at up to 25%, and gains may owe capital-gains tax (a 1031 exchange can defer both). Figures are a year-1 estimate at your 24.0% rate — not tax advice; consult a CPA.
Schools (NCES district)
- District
- Kern High
- NCES district ID
- 0619540
- Math proficiency
- 21% ▬ 0.00%
- Reading proficiency
- 51% ▲ 2.00%
- Median HH income
- $49,686
- Composite
- 33.68/100
- National rank
- #10443
- State rank
- #860 of 1400 in CA
Livability — East Bakersfield
No livability data for this city. (Only ~50 U.S. cities are tracked.)
Census & demographics
- Census place
- East Bakersfield, CA
- County
- Kern County · 710,371 people
- Metro
- Bakersfield, CA
- Population (ZIP)
- 37,714
- Household income
- $43,244
- Rent vs Own
- Severe rent burden
- 2376.0
Population outlook (Kern County) Hauer SSP2
- Today (2025)
- 947,286 people
- By 2030
- 978,984 · +3.3%
- By 2040
- 1,045,018 · +10.3%
- By 2050
- 1,105,232 · +16.7%
- By 2075
- 1,229,538 · +29.8%
- By 2100
- 1,238,059 · +30.7%
Race, ethnicity, and origin ACS 2023
- Neighborhood character
- Predominantly Hispanic (76%)
- Race & ethnicity
- Hispanic / Latino 76% Two or more races 18% White 16% Black 5% Native American 3%
- Hispanic origin (detail)
- Mexican 69% Puerto Rican 1%
- Common ancestry
- Lithuanian 1% Serbian 1% Dutch 1%
- Foreign-born
- 22% · Canada
- Languages at home
- 45% English-only · Spanish 54%
Political lean MEDSL · Kern
- 2024 margin
- Strong R (+21.1) · D 38.2% · R 59.3% · Other 2.5%
- 2008→2024 swing
- -3.3pp toward R · 2008: -17.8pp · 2024: -21.1pp
- All cycles
- 2024: R+21.1 2020: R+10.2 2016: R+15.0 2012: R+20.9 2008: R+17.8
Not yet ingested
- Civics
- —
Market trends
- HPI YoY
- ▼ -181.24%
- Current HPI
- 424.6051
- Rent YoY
- ▲ 6.79%
- Metro
- Bakersfield, CA
- State GDP YoY
- ▲ 3.21%
- F500 in state
- 116
Industry mix (Fortune 500 HQ in CA)
| Industry | F500 HQs | Revenue |
|---|---|---|
| Technology | 27 | $1,492B |
|
||
| Financial Services | 3 | $174B |
|
||
| Retail | 3 | $44B |
|
||
| Insurance | 3 | $26B |
|
||
| Media / Entertainment | 2 | $115B |
|
||
| Pharmaceuticals / Biotech | 2 | $62B |
|
||
Price history
+990.9% since first listed35 events — show timeline
- 2025-05-29 Delisted — KCBOR
- 2020-08-06 Sold (Public Records) $240,000 Public Records
- 2020-08-06 Sold (MLS) $240,000 GEMLS
- 2020-08-06 Sold (MLS) $240,000 FRESNOMLS
- 2020-06-17 Pending — GEMLS
- 2020-04-08 Listed $239,900 GEMLS
- 2020-04-08 Listed $239,900 FRESNOMLS
- 2020-04-08 Listed $239,900 KCBOR
- 2019-01-10 Price Changed $210,000 GEMLS
- 2019-01-07 Sold (MLS) $210,000 GEMLS
- 2018-11-21 Pending — GEMLS
- 2018-11-20 Price Changed $220,000 GEMLS
- 2018-10-25 Listed $220,000 GEMLS
- 2018-08-02 Price Changed $229,000 GEMLS
- 2018-06-05 Price Changed $239,000 GEMLS
- 2017-09-14 Listing Removed — SDMLS
- 2017-09-14 Listing Removed — CRMLS
- 2017-07-11 Listed $259,000 CRMLS
- 2017-07-10 Listed $259,000 SDMLS
- 2017-06-05 Price Changed $269,900 GEMLS
- 2017-05-22 Price Changed $269,999 GEMLS
- 2017-05-18 Price Changed $299,999 GEMLS
- 2016-06-01 Price Changed $20,000 GEMLS
- 2016-05-31 Sold (Public Records) $20,000 Public Records
- 2016-05-31 Sold (MLS) $20,000 GEMLS
- 2016-05-20 Delisted — GEMLS
- 2016-05-19 Price Changed $24,000 GEMLS
- 2016-04-20 Price Changed $24,000 GEMLS
- 2016-04-04 Price Changed $27,500 GEMLS
- 2016-02-25 Listed $32,500 GEMLS
- 2015-06-18 Sold (MLS) $8,900 GEMLS
- 2015-04-17 Price Changed $14,900 GEMLS
- 2015-04-17 Delisted — GEMLS
- 2015-01-21 Listed $8,900 GEMLS
- 1986-07-28 Sold (Public Records) $22,000 Public Records
Property tax history
+25.8%/yrLatest (2025): $4,955 · +2.2% YoY. Source: county tax records.
Cash-flow waterfall
monthlySold comps — $/sqft
last 12 mo · ≤1 miLoading sold comps…