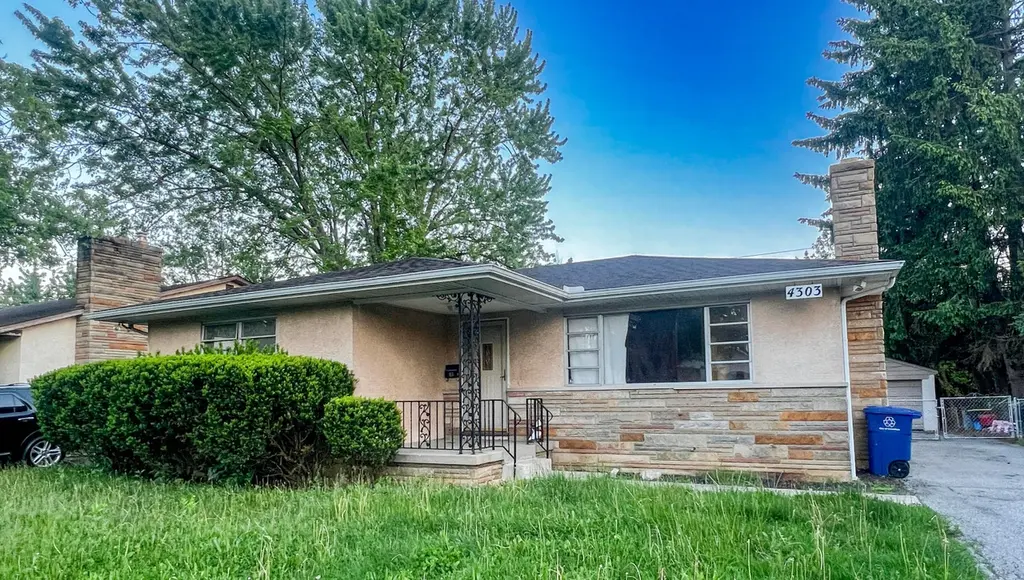
4303 Colby Ave · Columbus, OH
Flood risk 1/10 · Minimal
- FEMA flood zone
- X (unshaded)
- Chance of flooding over 30 yrs
- 0.0%
- Est. flood insurance / yr
- $473 – $860
Fire risk 1/10 · Minimal
- Est. fire insurance / yr
- $713 – $1,323
Heat risk 3/10 · Minor
- Hot days now (above 99°F)
- 7 days/yr
- Hot days in 30 yrs
- 18 days/yr
Wind risk 2/10 · Minimal
- Chance of severe wind over 30 yrs
- 0.0%
Air-quality risk 2/10 · Minimal
- Unhealthy air days now
- 1 days/yr
- Unhealthy air days in 30 yrs
- 1 days/yr
Risk factors via First Street. Map © Google.
Why this score? — see what drove the C+ grade
The composite is a weighted blend of 9 inputs, each scored 0–100. Each bar is that input's sub-score; the figure is the points it added to the 100-point composite (weight × sub-score).
- Cash flow +22.3/30.0
- ARV discount +15.0/15.0
- DSCR +7.2/10.0
- 1% rule +7.1/10.0
- Livability +4.0/5.0
- Rent growth +3.8/5.0
- Condition / age +2.5/5.0
- Schools +1.7/10.0
- Appreciation +0.0/10.0
$120,000
🖨 Deal sheet 📄 Offer letter ✓ Due diligence
Listing remarks
ONLINE AUCTION, the RESERVE (Minimum Bid) is $120,000. The auction ends at 7:00 PM, Thursday, June 4th, 2026. BUYERS MUST SIGN ACKNOWLEDGEMENT OF TERMS to bid. Agents, please see 'A2A'. This 3-bedroom, 1.5-bath ranch home sits on approximately 0.17± acres. Built in 1959, the home offers approximately 1,228 square feet of living space with one-level living. The lot measures approximately 60' of frontage by 120' in depth. The property includes a full basement and a two-car detached garage.
Key facts
- 6,969 sq ft lot
- 2 garage spots
- Built 1959
Property features AI
Finance
- Other: Listing offered via auction and standard listing
Exterior
- Parking: Detached 2-car garage
- Utilities: Public water; Public sewer
- Home design: Single-family home; One story; Built in 1959; No shared/common walls
- Construction: Block foundation (already noted)
- Exterior features: Block foundation
Interior
- Bedrooms: 3 main-level bedrooms
- Bathrooms: 1 full bathroom; 1 half bathroom (1.5 total)
- Interior features: Full basement
Neighborhood map
What this means for you Summary
Snapshot
- This is a 3-bed/1.5-bath single-family listed at $120k.
Deal economics
- At list price, monthly cash flow is $198 ($2k/yr) — positive.
- The deal already cash-flows at list — no discount required.
- Meets the 1% rule at list price ($1k rent vs $120k).
- Recommended offer: $116k (3.0% below list) — sets the bar for market timing.
- Cap rate 8.3% vs local median 3.8% in Columbus — top-decile yield for the area; either an underpriced asset or a hidden risk that comps aren't pricing in. Stress-test before assuming the spread holds.
Location & tenants
- Location reads 81/100 on livability (#97 in OH, #1,491 nationally) — a professional / high-income tenant draw. Strengths: commute A+, cost of living A+, housing A+; Watch: employment C-, crime F.
- Columbus City School District (urban): math 15% / reading 26% proficiency, ranked #626 of 656 in OH (top 95%) — low school quality limits family demand, transient renter base, plan for 1-2y turnover; 72% free/reduced lunch — lower-income household profile, screen leases tightly.
- Market conditions: Rents rising fast (+5.2%/yr); 61 active listings in the ZIP; 40 comparable units currently listed for rent nearby; rentals at typical pace (median 24d on market — plan ~3-4 weeks tenant-placement turnaround); 45% of comp listings sitting > 30 days — soft ceiling on asking rent; 8,139 units permitted in Franklin County in 2024 (5,940 in 5+ unit buildings).
- This rent runs 36% of the median local income ($48k/yr) — at the standard rent-burdened threshold; future hikes will face affordability resistance.
Forward outlook
- Local home prices are declining (-3.0%/yr); year-one equity from $830 of loan paydown is wiped out by about $4k of value loss. Plan a longer hold.
- Franklin County population projected at +34% by 2050 — long-run rental-demand tailwind backs the buy-and-hold thesis.
- At projected returns (-3.0% appreciation + 5.2% rent growth), your $34k cash investment doubles in ~10 years — after that, you're playing with house money.
Negotiation context
- It's been on market 31 days — a 3% lower offer ($116k) is reasonable based on typical stale-listing flexibility.
- Current owner paid $90k; 33% above their basis — modest negotiation headroom, anchor on the comps not their cost.
Risks & watch-outs
- Watch-outs: property tax is 2.7% of price; built in 1959 — expect roof / HVAC / electrical / plumbing capex.
Questions for the listing agent
- It's been on market 31 days. Have you received any prior offers? Is the seller open to a 3% concession, seller financing, or rate buy-down credit?
- Built in 1959 — when were the roof, HVAC, electrical panel, plumbing, and water heater last replaced?
- Property tax is high relative to price — has the assessment been appealed recently, and will the sale trigger a re-assessment?
- Is there a deadline driving the sale (1031 exchange, divorce, estate, relocation)? That informs how much negotiation room exists.
- Crime grade is F in this area — have there been break-ins, vandalism, or insurance claims at this property in the last 3 years? What carrier currently insures it and at what premium?
- What's the average days-on-market for RENTAL listings here right now (not sales)? A rising rental-DOM trend means longer vacancies and softer asking-rent achievability than the comps imply.
- What's the recent tenant-quality profile in this submarket — average credit score on applications, eviction rate, late-payment / NSF rate, and stable-employment percentage? A property-management company in the area should have these aggregated.
- How much new for-sale + rental construction is in the pipeline within 1–3 miles? Heavy new supply typically softens prices + rents 12–24 months out; constrained supply supports both.
Investment metrics
- 1% rule
- 1.21% ✓
- Cap rate
- 8.28%
- Cash-on-cash
- 7.09%
- DSCR
- 1.32
- GRM
- 6.9
CMA / ARV
- ARV (median comp)
- $195,122
- List price
- $120,000
- Delta
- -38.50%
- Verdict
- UNDERPRICED
- Comps
- 20 within 1.0 mi
Show comp detail 12 sales within ~0.75 mi
| Address | Dist | Beds/Ba | Sqft | Sold | Price | $/sf | Match |
|---|---|---|---|---|---|---|---|
| 4472 Aragon Ave | 0.29mi | 3/1.5 | 1,284 (+5%) | 1mo | $229,900 | $179 | 78 |
| 1370 Erickson Rd | 0.21mi | 3/2.0 | 1,073 (-13%) | 0mo | $235,000 | $219 | 67 |
| 1612 Simpson Dr | 0.52mi | 4/2.0 (+1) | 1,270 (+3%) | 3mo | $232,000 | $183 | 60 |
| 1377 Marble Dr | 0.51mi | 3/1.0 | 1,152 (-6%) | 4mo | $220,000 | $191 | 60 |
| 4589 Belfast Dr | 0.69mi | 3/1.5 | 1,282 (+4%) | 1mo | $205,000 | $160 | 60 |
| 1639 Shady Lane Rd | 0.57mi | 4/2.0 (+1) | 1,270 (+3%) | 2mo | $119,250 | $94 | 59 |
| 4111 Colby Ave | 0.28mi | 4/2.0 (+1) | 1,073 (-13%) | 1mo | $200,000 | $186 | 58 |
| 3990 Astor Ave | 0.57mi | 3/1.5 | 1,104 (-10%) | 0mo | $241,000 | $218 | 56 |
| 1284 Thurston Dr | 0.36mi | 3/1.0 | 1,056 (-14%) | 3mo | $205,000 | $194 | 55 |
| 1642 Vilardo Ln | 0.59mi | 4/1.5 (+1) | 1,319 (+7%) | 0mo | $135,000 | $102 | 55 |
| 4236 E Mound St | 0.48mi | 3/2.5 | 1,080 (-12%) | 0mo | $298,900 | $277 | 53 |
| 4701 Janis Dr | 0.67mi | 4/2.0 (+1) | 1,320 (+8%) | 1mo | $240,000 | $182 | 49 |
Match score weights: distance 35% · size 25% · config 20% · recency 20%. Top-matched comps best support the ARV.
Projected returns pro-forma
-3.0% appreciation · 5.22% rent growth · sell at horizon
- IRR
- -2.6%
- Equity multiple
- 0.90×
- Total profit
- $-3,403
- Equity at exit
- $17,892
- IRR
- 9.7%
- Equity multiple
- 1.83×
- Total profit
- $27,914
- Equity at exit
- $10,375
Cash invested: $33,600 (down + closing). Projections, not guarantees.
Landlord ↔ Tenant lean methodology
- Overall (STATE)
- 73 Landlord-Friendly
- State Ohio
- 73 Landlord-Friendly · R+6
- County
- — inherits STATE
- City
- — inherits STATE
ZIP-level market 43227
- Rents YoY
- 5.2%
- Active inventory
- 61
- Price-to-rent
- 6.9×
Monthly cashflow live
- Estimated rent
- $1,451 high interval (Pro) →
- Mortgage (P&I)
- −$629
- Tax from tax record
- −$268 /mo · $3,219/yr
- Insurance
- −$50
- HOA
- −$0
- Vacancy / Maint / Mgmt
- −$305
- Net cashflow
- $198
Break-even live
UW: 25.0% down · 7.5% · 30yr · 1.5% tax · 5.0% vac · 8.0% maint · 8.0% mgmt
Financing live
Cash to close
- Down payment
- $30,000
- Closing costs
- $3,600
- Reserves months
- —
- Total cash needed
- —
Loan-product check · same deal, 3 products live
Conventional
25% down · 7.5% · 30yr
- Down + closing
- —
- Monthly P&I
- —
- Monthly cashflow
- —
- DSCR
- —
- Eligible?
- —
Personal DTI + credit; lowest rate.
DSCR
20% down · 8.5% · 30yr
- Down + closing
- —
- Monthly P&I
- —
- Monthly cashflow
- —
- DSCR
- —
- Eligible?
- —
No personal income docs; deal must DSCR.
Hard money
10% down · 12.0% · 12mo
- Down + closing
- —
- Monthly P&I
- —
- Monthly cashflow
- —
- DSCR
- —
- Eligible?
- —
Short-term bridge; refi at stabilization.
Rent comps 40 comps
| Address | Beds | Baths | Sqft | Rent | $/sqft | DOM | Units | Dist |
|---|---|---|---|---|---|---|---|---|
| 1462 Elaine Rd Columbus, OH | 2.0 | 1.5 | 975 | $1,324 | $1.36 | 23d | 1 | 0.26mi |
| 1250 Kelburn Rd Columbus, OH | 2.0 | 1.0 | 970 | $1,099 | $1.13 | 43d | 1 | 0.27mi |
| 1250 Kelburn Rd Columbus, OH | 2.0 | 1.0 | 970 | $1,200 | $1.24 | 12d | 1 | 0.27mi |
| 1250 Kelburn Rd Columbus, OH | 2.0 | 1.0 | 970 | $1,099 | $1.13 | 21d | 1 | 0.27mi |
| 1537 Duffield Dr Columbus, OH | 3.0 | 2.0 | 1020 | $1,500 | $1.47 | 43d | 1 | 0.27mi |
| 4048 E Livingston Ave Columbus, OH | 3.0 | 1.0 | 961 | $1,000 | $1.04 | 19d | 1 | 0.36mi |
| 4056 Carlton Ave Columbus, OH | 2.0 | 1.5 | 1100 | $1,250 | $1.14 | 23d | 1 | 0.42mi |
| 4003 Carlton Ave Columbus, OH | 4.0 | 1.0 | 1300 | $1,700 | $1.31 | 43d | 1 | 0.50mi |
| 1665 Elaine Rd Columbus, OH | 3.0 | 1.0 | 1240 | $1,500 | $1.21 | 43d | 1 | 0.51mi |
| 1718 Carstare Dr Columbus, OH | 2.0 | 1.5 | 720 | $950 | $1.32 | 43d | 1 | 0.60mi |
| 1705 Carstare Dr Columbus, OH | 2.0 | 1.5 | 720 | $950 | $1.32 | 43d | 1 | 0.60mi |
| 1303 Dellwood Ave Columbus, OH | 3.0 | 1.0 | 900 | $1,500 | $1.67 | 43d | 1 | 0.61mi |
| 1789 Elaine Rd Columbus, OH | 2.0 | 1.5 | 960 | $1,270 | $1.32 | 1d | 2 | 0.67mi |
| 1660 Huxley Dr Columbus, OH | 3.0 | 1.0 | 1248 | $1,695 | $1.36 | 7d | 1 | 0.74mi |
| 3974 Andrus Ave Columbus, OH | 2.0 | 1.5 | 950 | $1,235 | $1.30 | 23d | 3 | 0.74mi |
| 3974 Andrus Ct E Unit 3996C Columbus, OH | 2.0 | 1.5 | 950 | $1,185 | $1.25 | 23d | 1 | 0.76mi |
| 3974 Andrus Ct E Unit 3982D Columbus, OH | 2.0 | 1.5 | 950 | $1,285 | $1.35 | 23d | 1 | 0.76mi |
| 1246 Arkwood Ave Columbus, OH | 3.0 | 1.0 | 1094 | $1,740 | $1.59 | 43d | 1 | 0.78mi |
| 3855 E Mound St Columbus, OH | 3.0 | 1.0 | 1476 | $1,885 | $1.28 | 43d | 1 | 0.89mi |
| 4163 Wright Park Columbus, OH | 2.0 | 2.0 | 1008 | $1,750 | $1.74 | 43d | 1 | 0.92mi |
| 3632 Cushing Dr Columbus, OH | 2.0 | 1.0 | 950 | $1,050 | $1.11 | 12d | 1 | 0.94mi |
| 3632 Cushing Dr Unit D Columbus, OH | 2.0 | 1.0 | 950 | $1,050 | $1.11 | 16d | 1 | 0.94mi |
| 3632 Cushing Dr Unit B Columbus, OH | 2.0 | 1.0 | 900 | $950 | $1.06 | 19d | 1 | 0.94mi |
| 3605 Cushing Dr Unit A Columbus, OH | 2.0 | 1.0 | 900 | $815 | $0.91 | 10d | 1 | 0.98mi |
| 3600 Cushing Dr Unit C Columbus, OH | 2.0 | 1.0 | 810 | $900 | $1.11 | 43d | 1 | 0.99mi |
| 1256 Rand Ave Columbus, OH | 2.0 | 1.0 | 967 | $1,299 | $1.34 | 43d | 1 | 1.04mi |
| 4661 Jae Ave Columbus, OH | 4.0 | 2.0 | 1230 | $1,799 | $1.46 | 21d | 1 | 1.07mi |
| 973 Exeter Rd Columbus, OH | 3.0 | 1.0 | 1054 | $1,710 | $1.62 | 43d | 1 | 1.11mi |
| 984 Exeter Rd Columbus, OH | 3.0 | 2.0 | 1161 | $1,500 | $1.29 | 43d | 1 | 1.12mi |
| 685-687 Valerie Ln Whitehall, OH | 2.0 | 1.0 | 800 | $1,153 | $1.44 | 43d | 1 | 1.16mi |
| 3486 Roswell Dr Columbus, OH | 3.0 | 2.0 | 1116 | $1,625 | $1.46 | 43d | 1 | 1.18mi |
| 2038 Noe Bixby Rd Columbus, OH | 2.0 | 1.0 | 1000 | $1,365 | $1.36 | 3d | 1 | 1.25mi |
| 1303 Barnett Rd Unit 1303 Columbus, OH | 2.0 | 1.0 | 1020 | $1,150 | $1.13 | 12d | 1 | 1.37mi |
| 1317 Barnett Rd Columbus, OH | 3.0 | 1.0 | 1057 | $1,299 | $1.23 | 12d | 1 | 1.37mi |
| 496 S Hamilton Rd Whitehall, OH | 1.0–2.0 | 1.0 | 663 | $850 | $1.28 | 23d | 4 | 1.39mi |
| 3540 E Main St Columbus, OH | 2.0 | 1.0 | 914 | $1,074 | $1.18 | 3d | 5 | 1.41mi |
| 2400 Shore Blvd W Columbus, OH | 1.0–2.0 | 1.0–1.5 | 729 | $1,249 | $1.71 | 2d | 34 | 1.44mi |
| 892 Ruby Ave Columbus, OH | 2.0 | 2.0 | 1100 | $1,500 | $1.36 | 43d | 1 | 1.45mi |
| 2258 Majestic Dr W Columbus, OH | 3.0 | 1.0 | 1396 | $1,885 | $1.35 | 43d | 1 | 1.45mi |
| 4363 Chandler Dr Columbus, OH | 3.0 | 1.0 | 1328 | $1,830 | $1.38 | 23d | 1 | 1.45mi |
Listing history 8 events
-
2026-06-07statusdays on market $120,000 Pending 31 DOM
-
2026-06-05days on market $120,000 Active 29 DOM
-
2026-06-03days on market $120,000 Active 28 DOM
-
2026-06-02days on market $120,000 Active 27 DOM
-
2026-06-01days on market $120,000 Active 26 DOM
-
2026-05-31days on market $120,000 Active 25 DOM
-
2026-05-06$120,000 Active 499-char remark
-
2002-09-20soldstatus $90,000
ⓘ Source: listings_history table (triggers on properties + properties_extension) + one-shot
backfill from property_details.listing_events for pre-trigger history.
Tax reassessment forecast OH · Partial reset (capped growth)
- Current annual tax
- $3,219 · $268/mo
- Projected year-2 tax
- $3,219 · $268/mo
- Expected delta
- $0/yr ($0/mo · 0.0%)
ⓘ Screening estimate from a state-policy table — verify with the county assessor before closing.
Climate risk First Street
- Flood 1/10 Low FEMA zone X (unshaded) · 0% chance over 30 yrs
- Wildfire 1/10 Low
- Heat 3/10 Moderate 7 d/yr ≥99°F today · 18 d/yr by 30 yrs out
- Wind 2/10 Low 0% chance of damaging wind over 30 yrs
- Air quality 2/10 Low 1 unhealthy d/yr today · 1 by 30 yrs out
Nearby sold comps map
Loading sold comps map…
Walkable amenities ~0.75 mi
Loading nearby amenities…
Taxation est. · year 1
- Rental income
- $17,407
- − Mortgage interest
- −$6,722
- − Property taxes
- −$3,219
- − Insurance
- −$600
- − Repairs & maintenance
- −$1,393
- − Management
- −$1,393
- − Depreciation
- −$3,491
- Taxable income
- $590
- Est. tax owed @ 24.0%
- −$142
- After-tax cash flow
- $2,239/yr
For passive investors: Depreciation is non-cash, so a rental often shows a tax loss while cash-flowing — sheltering income. Rental losses are passive: they offset passive income freely, and up to $25,000/yr can offset ordinary (W-2) income if you actively participate and your MAGI is under $100k (phasing out to $0 by $150k); unused losses carry forward. On sale, claimed depreciation is recaptured at up to 25%, and gains may owe capital-gains tax (a 1031 exchange can defer both). Figures are a year-1 estimate at your 24.0% rate — not tax advice; consult a CPA.
Schools (NCES district)
- District
- Columbus City School District
- NCES district ID
- 3904380
- Math proficiency
- 15% ▼ -17.00%
- Reading proficiency
- 26% ▼ -12.00%
- Median HH income
- $38,483
- Composite
- 17.19/100
- National rank
- #9105
- State rank
- #626 of 656 in OH
Livability — Columbus
- Score
- 81/100
- State rank
- #97
- US rank
- #1491
Category grades
Schools grade is shown separately in the Schools card above.
Census & demographics
- Census place
- Columbus, OH
- County
- Franklin County · 1,351,780 people
- City population
- 612,189
- Metro
- Columbus, OH
- Population (ZIP)
- 25,358
- Household income
- $48,159
- Rent vs Own
- Severe rent burden
- 1467.0
Population outlook (Franklin County) Hauer SSP2
- Today (2025)
- 1,456,139 people
- By 2030
- 1,556,890 · +6.9%
- By 2040
- 1,757,349 · +20.7%
- By 2050
- 1,950,539 · +34.0%
- By 2075
- 2,376,171 · +63.2%
- By 2100
- 2,636,796 · +81.1%
Race, ethnicity, and origin ACS 2023
- Neighborhood character
- Majority Black (63%)
- Race & ethnicity
- Black 63% White 23% Hispanic / Latino 9% Two or more races 5%
- Hispanic origin (detail)
- Mexican 3%
- Common ancestry
- Swiss 1% Slovak 1%
- Foreign-born
- 11% · Canada
- Languages at home
- 87% English-only · Spanish 7% French/Haitian/Cajun 1%
Political lean MEDSL · Franklin
- 2024 margin
- Strong D (+28.4) · D 63.7% · R 35.3% · Other 1.0%
- 2008→2024 swing
- +7.7pp toward D · 2008: 20.7pp · 2024: 28.4pp
- All cycles
- 2024: D+28.4 2020: D+31.4 2016: D+25.9 2012: D+21.7 2008: D+20.7
Not yet ingested
- Civics
- —
Market trends
- HPI YoY
- ▼ -193.50%
- Current HPI
- 301.3767
- Rent YoY
- ▲ 5.22%
- Metro
- Columbus, OH
- State GDP YoY
- ▲ 1.98%
- F500 in state
- 48
Industry mix (Fortune 500 HQ in OH)
| Industry | F500 HQs | Revenue |
|---|---|---|
| Insurance | 3 | $145B |
|
||
| Industrial Machinery | 3 | $49B |
|
||
| Financial Services | 3 | $24B |
|
||
| Consumer Goods | 2 | $93B |
|
||
| Aerospace / Defense | 2 | $47B |
|
||
| Utilities | 2 | $33B |
|
||
Price history
+33.3% since first listed3 events — show timeline
- 2026-06-06 Pending — CBRMLS
- 2026-05-06 Listed $120,000 CBRMLS
- 2002-09-20 Sold (Public Records) $90,000 Public Records
Property tax history
-3.8%/yrLatest (2024): $3,219 · +1.3% YoY. Source: county tax records.
Cash-flow waterfall
monthlySold comps — $/sqft
last 12 mo · ≤1 miLoading sold comps…